

 PDF
PDF Citation
 Print
Print


INTRODUCTION
The National Health Plan (HP 2030), which was established to promote the health of the South Korean (hereafter, Korean) people and prevent diseases, is aimed at increasing healthy life expectancy (HLE) and improving health equity. A plan for reducing health inequality among regions should also be included in the Community Health Plan, which is adopted by each local government. To achieve these goals, life expectancy (LE) and HLE are used as summary evaluation indicators, and regular monitoring of these indicators is necessary.1 LE is calculated based on the probability of death by age and measures the average number of years a person is expected to live and the overall health level of a population.23 However, a limitation of this index is that it cannot reflect the quality of life. HLE considers a combination of disease, quality of life, and death, and denotes the period for which a person is expected to survive in good health without a disability or health problem.123 An increase in LE should be accompanied by a corresponding rise in HLE to avoid risks for the national healthcare financing system, such as rising costs of long-term care due to longer periods of illness and poor health.13 Given that LE is continuing to increase in Korea alongside a rapid rise in the elderly population,4 it is necessary to consider HLE in tandem with LE when planning health policies.
HLE can be calculated using various indicators, such as health status (e.g., subjective health level, number of hospitalization and sick days, and cause of death) and disability level (e.g., daily living ability and activity limitations).135678 Some Korean studies have also measured HLE using the EuroQol-5 Dimension (EQ-5D), an instrument that evaluates the quality of life via Community Health Surveys.39 Although various indicators can be used to estimate HLE, few studies have considered cancer, which has a serious disease burden in Korea. To the best of our knowledge, cancer-free LE, which is defined as the average number of years that individuals are expected to live without cancer, has never been calculated at the level of small administrative areas in Korea.
While cancer is still the highest ranking cause of death in Korea, the 5-year cancer survival rate (70.4%) is steadily increasing and the duration of illness due to cancer has also been prolonged.10 The public health field and local communities have been encouraged to establish a medical–public health–social welfare coordination model for effective cancer prevention, treatment, and post-treatment management according to the National Cancer Control Plan.11 To properly allocate resources to each stage (e.g., prevention, diagnosis, and curative and palliative care) for cancer control planning, an understanding of indicators related to the local or regional burden of cancer is required.121314 Regions where cancer-related policies need to be preferentially implemented should be identified, and the effectiveness of those regional programs should be evaluated. While HLE (including cancer-free LE) has been calculated at the national and district level,3151617 scant data exist for cancer-free LE in small administrative areas, such as eups/myeons/dongs (i.e., towns, townships, and neighborhoods, respectively). For this reason, it can be difficult to understand which areas are particularly suffering from the burden of cancer and to establish specific strategies for cancer management in small administrative areas. To further increase the effectiveness of cancer-related policies and cancer management programs in such areas, information on cancer-free LE is required at the eup/myeon/dong level.
In addition, a more extensive empirical analysis is required to assess whether the socioeconomic characteristics of a region affect the cancer-free LE of the people residing within it. These investigations are necessary to develop policies that not only improve the cancer-related health status of local residents, but also alleviate inequality in cancer-related health among regions. Information on the relationship between regional socioeconomic characteristics and the cancer-free LE, as well as the burden of cancer, can assist in the selection of priority areas for cancer-related healthcare policies and may serve as a basis for local governments to establish and implement related programs.
In light of the necessity of calculating cancer related health indicators in small administrative units, the purpose of this study was to provide scientific evidence for developing policies to alleviate cancer-related health inequality among these areas by estimating cancer-free LE and the burden of cancer at the eup/myeon/dong level in Korea and examining the relationship between the socioeconomic characteristics of an area and its cancer-related indicators.
METHODS
Unit of analysis
The unit of analysis for this study is the eup/myeon/dong, the smallest-scale administrative unit in the classification of administrative districts in Korea. A total of 3,396 eups/myeons/dongs were reclassified from the 3,955 eups/myeons/dongs listed in the 2008–2017 Korea Administrative District Classification of the National Statistical Office. As it is regarded that 5,000 person-years per region are the minimum necessary for a reliable and robust calculation of LE at birth,18 25 regions that had a population by sex of less than 500 for each year were integrated with a neighboring area, following the method used in prior studies.1920 The other areas were rearranged according to changes in administrative districts over the 10-year study period.
Data and statistical analysis
We utilized the Eligibility Database (DB) and the Treatment DB of the National Health Information DB (NHID) provided by the National Health Insurance Service. We obtained data on population and deaths from the Eligibility DB to calculate mortality. A person alive as of January 1 was assumed to be a survivor of the previous year, and deaths in the population were tracked for the year. From the data of population and deaths, the mortality data for each year were generated at the eup/myeon/dong level by age (19 age groups: 0, 1–4, 5–9, 10–14, ..., 85+ years) and by sex from 2008 to 2017. Prior Korean studies also employed this approach and presented small-area-level mortality metrics.1920 The cancer prevalence rates from 2008 to 2017 were calculated from the aggregate data (without any personal information) of hospitalization (more than once per year) or outpatient treatment (more than twice per year) for cancer from the Treatment DB. The International Classification of Diseases 10th revision (ICD-10) codes C00-C97, D45, D46, D47.1, D47.3, D47.4, and D47.5 were included, while excluding thyroid cancer. Cancer-free LE was calculated by applying Sullivan's method21 to the collected mortality and cancer prevalence data.
Income indices are regarded as indicators of the overall socioeconomic characteristics of a region. This study used health insurance premium data obtained from the NHID as a proxy index for income.22232425 Regional health insurance premiums were obtained by calculating the equivalized insurance premium per person by eup/myeon/dong during 10 years, reflecting the number of household members and the premium increase rate for each year (2008–2017). Because health insurance premiums are charged per household, all members of the same household have the same insurance premium. The equivalized insurance premiums by eup/myeon/dong were transformed into z-scores to present the national distribution of regional insurance premiums. This is the first study in Korea to employ national health insurance premiums at the small area level.
Correlation and regression analyses were performed to analyze the association of cancer-free LE and the regional burden of cancer with health insurance premiums by eup/myeon/dong. Data pre-processing, calculations of cancer-free LE and insurance premiums, and analyses of the correlations between them were performed using SAS 9.4 (SAS Institute, Cary, NC, USA).
Ethics statement
The present study protocol was reviewed and approved by the National Health Insurance Service of Korea (NHIS-2021-1-215) and the Seoul National University Hospital Institutional Review Board (IRB No. E-2002-016-1098). The requirement for informed consent was exempted by the board. Aggregate data without any personal information from the NHIS were utilized for this study.
RESULTS
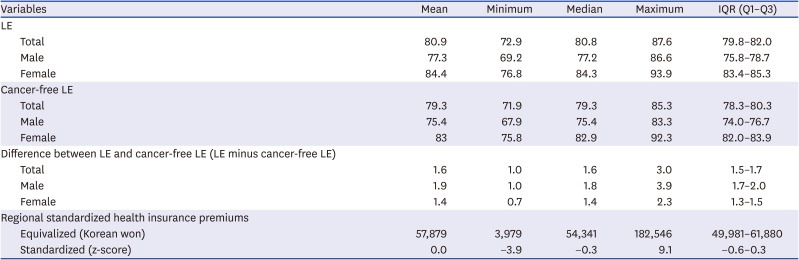
Table 1 shows the descriptive information of LE, cancer-free LE, LE minus cancer-free LE and standardized health insurance premiums in 3,396 eups/myeons/dongs in Korea. The median value of LE for the total population was 80.8 years, and the inter-quartile range (IQR), which represents the spread from the first quartile (Q1) to the third quartile (Q3) of data, was 79.8–82.0 years. For males, the median LE by eup/myeon/dong was 77.2 years (IQR: 75.8–78.7 years), while the corresponding value for females was 84.3 years (IQR: 83.4–85.3 years). The median regional LE for females was approximately 7.1 years higher than that for males. The median cancer-free LE for the total population by eup/myeon/dong was 79.3 years (IQR: 78.3–80.3 years). For males, it was 75.4 years (IQR: 74.0–76.7 years), and for females it was 82.9 (IQR: 82.0–83.9 years). The median difference between LE and cancer-free LE, which reflects the burden of cancer, was 1.6 years for the total population by eup/myeon/dong, and the IQR of the difference ranged from 1.5–1.7 years. For males, the median difference between LE and cancer-free LE was 1.8 years (IQR: 1.7–2.0 years), and for females it was 1.4 years (IQR: 1.3–1.5 years). The mean equivalized health insurance premium by eup/myeon/dong was KRW 57,879 (median value = KRW 54,341), and the difference between the maximum and minimum health insurance premiums by eup/myeon/dong was KRW 178,567 (IQR: KRW 49,981–61,880). The standardized health insurance premium by eup/myeon/dong ranged from -3.9 to 9.1 (mean = 0, median = −0.3, IQR: −0.6–0.3).
Table 1
Descriptive statistics of LE at birth (unit: years), cancer-free LE (unit: years), and standardized health insurance premiums by eup/myeon/dong (n = 3,396): findings from the National Health Information Database, 2008–2017
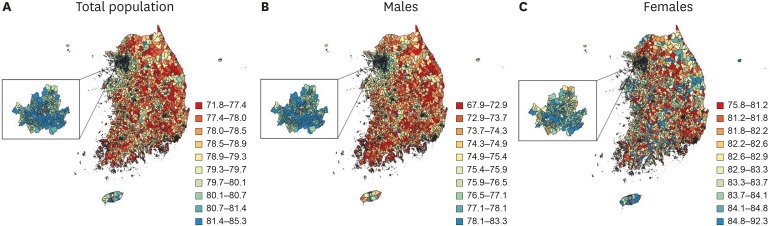
The maps in Figs. 1 and 2 show the national distributions of LE and cancer-free LE by eup/myeon/dong. Both LE and cancer-free LE tended to be higher in eups/myeons/dongs of metropolitan areas for the total population than in eups/myeons/dongs of non-metropolitan areas. Similar distributions were observed for LE and cancer-free LE of the male population. LE and cancer-free LE for females also tended to be higher in metropolitan areas, but those were also likely to be high for females in some eups/myeons/dongs in Gangwon-do, Gyeongsangbuk-do, Gyeongsangnam-do, Jeollabuk-do and Jeollanam-do outside metropolitan areas.
Fig. 1
National distributions of life expectancy at birth in 3,396 eups/myeons/dongs for (A) total population, (B) males, and (C) females, shown in 10 color groups with ranges for the categories determined by the deciles of life expectancy at birth: findings from the National Health Information Database, 2008–2017.
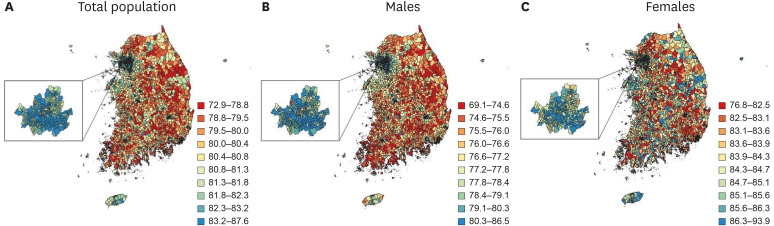
Fig. 2
National distributions of cancer-free life expectancy in 3,396 eups/myeons/dongs for (A) total population, (B) males, and (C) females, shown in 10 color groups with ranges for the categories determined by the deciles of cancer-free life expectancy: findings from the National Health Information Database, 2008–2017.
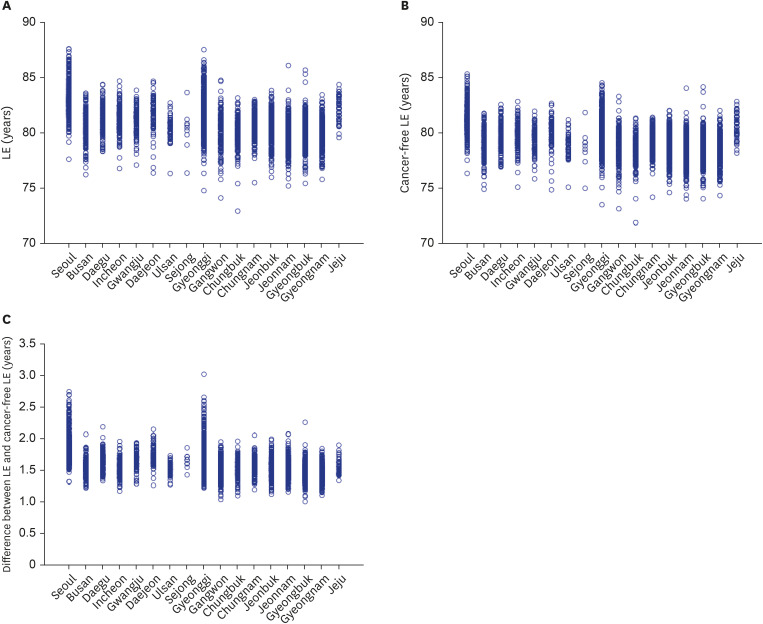
To better understand the distribution of LE and cancer-free LE by eup/myeon/dong, the small-area-level distributions of LE and cancer-free LE by metropolitan and provincial cities were considered (Fig. 3 and Supplementary Table 1). As shown in the national distributions (Figs. 1 and 2), the LE and cancer-free LE of eups/myeons/dongs in the metropolitan areas such as Seoul and Gyeonggi-do were higher than those in other provincial cities (median LE = 82.9 years in Seoul and 81.4 years in Gyeonggi-do; and median cancer-free LE = 81.1 years in Seoul and 79.8 years in Gyeonggi-do) (Fig. 3A, B, and Supplementary Table 1). However, eups/myeons/dongs in Seoul and Gyeonggi-do were also likely to have a larger difference between LE and cancer-free LE than other areas (median = 1.8 years in Seoul and 1.6 years in Gyeonggi-do) (Fig. 3C and Supplementary Table 1).
Fig. 3
Regional distributions of (A) LE at birth, (B) cancer-free LE, and (C) difference between LE and cancer-free LE for eups/myeons/dongs in 17 metropolitan/provincial cities: findings from the National Health Information Database, 2008–2017.
LE = life expectancy.
In particular, when the median cancer-free LE in eups/myeons/dongs was 79.3 years, 95.8 percent of eups/myeons/dongs had a cancer-free LE above the median value in Seoul, while only 4.2 percent were below the median (Supplementary Fig. 1B). In contrast, 21.9 percent of eups/myeons/dongs had a cancer-free LE above the median value in Gyeongsangnam-do, while 78.1 percent were below the median value (Supplementary Fig. 1B). Given that the median difference between the LE and cancer-free LE of all eups/myeons/dongs is 1.6 years, about 96.5 percent of eups/myeons/dongs in Seoul showed a difference over 1.6 years. Conversely, only about 15.8% of eups/myeons/dongs in Gyeongsangnam-do showed a difference of more than 1.6 years (Supplementary Fig. 1C). For the large number of remaining eups/myeons/dongs in Gyeongsangnam-do, the difference between LE and cancer-free LE was less than 1.6 years (Supplementary Fig. 1C).
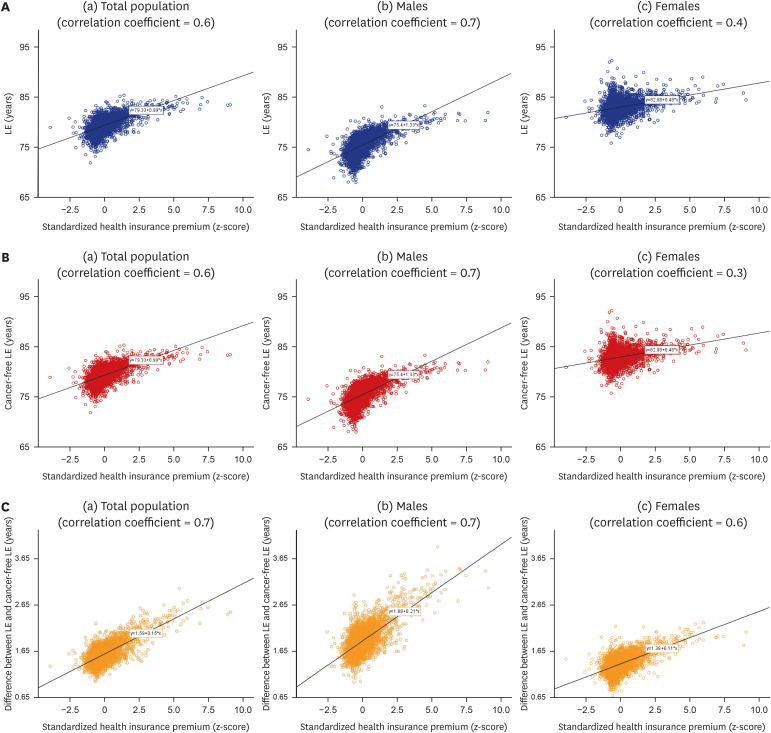
The correlations of regional standardized insurance premiums with LE and cancer-free LE by eup/myeon/dong are shown in Fig. 4A and B. The standardized health insurance premium by eup/myeon/dong was statistically significantly associated with LE (r = 0.6, P < 0.001) and cancer-free LE (r = 0.6, P < 0.001) for the total population. Regression analyses also confirmed the statistically significant relationships of regional standardized insurance premiums with LE and cancer-free LE by eup/myeon/dong (β = 1.1, P < 0.001 for LE and β = 1.0, P < 0.001 for cancer-free LE) (Supplementary Table 2). While significant relationships were observed for males (r = 0.7, P < 0.001 and r = 0.7, P < 0.001, respectively), LE and cancer-free LE by eup/myeon/dong did not show strong correlations with the standardized health insurance premium for females (r = 0.4, P < 0.001 and r = 0.3, P < 0.001, respectively) (Fig. 4A and B). Regression analyses also revealed statistically significant associations between the regional standardized health insurance premium and LE and cancer-free LE by eup/myeon/dong for male populations (β = 1.5, P < 0.001 for LE and β = 1.3, P < 0.001 for cancer-free LE) (Supplementary Table 2). For females, while the statistically significant relationship was confirmed, the regression coefficients were smaller than those for the total or male populations. In addition, the standardized health insurance premium by eup/myeon/dong was significantly associated with the difference between LE and cancer-free LE (β = 0.2, P < 0.001 for the total population) (Fig. 4C and Supplementary Table 2). All of these regression models have R-square values ranging from 0.1 to 0.5.
Fig. 4
Correlations of standardized health insurance premium with (A) LE at birth, (B) cancer-free LE and (C) difference between LE and cancer-free LE in 3,396 eups/myeons/dongs: findings from the National Health Information Database, 2008–2017. (A) Correlation of standardized health insurance premium with LE in 3,396 eups/myeons/dongs for (a) total population, (b) males and (c) females; solid lines represent fitted regression lines. (B) Correlation of standardized health insurance premium with cancer-free LE in 3,396 eups/myeons/dongs for (a) total population, (b) males and (c) females; solid lines represent fitted regression lines. (C) Correlation of standardized health insurance premium with difference between LE and cancer-free LE in 3,396 eups/myeons/dongs for (a) total population, (b) males and (c) females; solid lines represent fitted regression lines.
LE = life expectancy.
DISCUSSION
This study analyzed the relationships between regional health insurance premiums and cancer-free LE by eup/myeon/dong in Korea using data from the NHID. First, this study showed the existence of regional inequality in terms of LE, cancer-free LE and the burden of cancer (LE minus cancer-free LE) by eup/myeon/dong. This result is in line with studies1520242627 that have found regional health inequalities by city/county/district or in urban versus rural areas in terms of LE or HLE. As shown in Figs. 1, 2, and 3, metropolitan cities, including Seoul and Gyeonggi-do, tended to have higher LEs and cancer-free LEs compared to provincial areas. Previous studies152426 have also generally shown a tendency for LE to be higher in large cities than in rural areas. This study added evidence that even in metropolitan and large areas, where LE and HLE are relatively high, there exist eups/myeons/dongs with poorer cancer-related health levels than those of eups/myeons/dongs located in rural or non-metropolitan areas (Fig. 3). In other words, information about small and vulnerable areas with a lower cancer-free LE, which could not have been observed through the analysis of wider administrative unit areas, was found by analyzing small administrative areas. These findings could facilitate the implementation of community-centered cancer control policies in areas that more urgently need them and help ensure that the effectiveness of the project is accurately communicated to the local residents.
A gender gap was also found in regional LE, cancer-free LE and burden of cancer. As in previous studies, females had higher LE and cancer-free LE than males. For males, LE and cancer-free LE by eup/myeon/dong (Figs. 1B and 2B) showed distributions very similar to LE and cancer-free LE for the total population (Figs. 1A and 2A), whereas LE and cancer-free LE for females (Figs. 1C and 2C) showed distributions that were slightly different from those of the male population. For females, the eups/myeons/dongs with high LE and cancer-free LE were less strongly concentrated in metropolitan areas than those for males. This indicates that the proportion of female deaths (affecting female LE) and female cancer prevalence (affecting female cancer-free LE) were likely to be lower in non-metropolitan areas than those for males.
Moreover, as the duration of illness due to disease or accidents is prolonged given the increase in LE and advances in medical technology,2 the gap between LE and HLE (reflecting years of healthy life lost from illness) is an important issue.128 This study indicated that the median value of cancer-free LE was lower than the median of LE by eup/myeon/dong (1.6 years for the total population, 1.8 years for males, and 1.4 years for females). The period during which a person can live a healthy life without hospitalization and outpatient treatment for cancer can be shortened by the abovementioned period and quality of life may be degraded due to the burden of cancer during that period. Notably, while eups/myeons/dongs in Seoul and Gyeonggi-do tended to have higher LE and cancer-free LE than those of eups/myeons/dongs in other cities, the differences between LE and cancer-free LE were larger in Seoul and Gyeonggi-do (Fig. 3 and Supplementary Table 1). Those who live in the regions known to have better socioeconomic conditions were likely to show a cancer survival for a longer time and lower cancer mortality rate,2930 while it also means that the period for which a person survives from cancer could be a large burden of cancer. The variances of LE, cancer-free LE, and the burden of cancer by eup/myeon/dong were also larger in Seoul and Gyeonggi-do than in other regions (Fig. 3). In other words, regional differences in health levels existed among eups/myeons/dongs within metropolitan cities, such as Seoul and Gyeonggi-do. A wider regional gap also existed in difference between LE and cancer-free LE for males than for females, indicating that the regional inequality in the burden of cancer was more prominent for males than females (Table 1).
In this study, the associations of the regional standardized health insurance premiums with LE, cancer-free LE, and the burden of cancer (LE minus cancer-free LE) by eup/myeon/dong were statistically significant. Eups/myeons/dongs with a higher socioeconomic position (SEP), as reflected by a higher health insurance premium, tended to present higher LE and cancer-free LE than regions with the low SEP. Regional health insurance premiums also showed a significant association with the difference between LE and cancer-free LE by eup/myeon/dong. Notably, this finding suggests that the gap between LE and cancer-free LE, which indicates the burden of cancer, was not necessarily larger in areas with a lower SEP. Rather, it tended to be greater in regions with a higher SEP, as quantified using insurance premiums. One explanation would be that cancer prevalence rates employed in this study for the calculation of cancer-free LE may reflect healthcare utilization and overutilization in regions with higher SEP and/or underutilization in regions with lower SEP. It might have contributed to the positive relationship between regional health insurance premiums and the burden of cancer. Another explanation would be that people living in eups/myeons/dongs with high health insurance premiums, compared to those who live in areas with low health insurance premiums, could experience a degradation in the quality of life caused by cancer for a longer period of time. People living in areas with high health insurance premiums may be more likely to have high LE and to extend their lifespan through early detection of cancer and appropriate treatment. Therefore, people living in regions with a higher SEP tend to have higher cancer-free LE, but a greater burden of cancer, compared to those living in regions with a lower SEP. Even though people with a higher SEP have an advantage in the early detection and treatment of cancer, it could be especially important for them to focus on cancer prevention to stay healthy for a longer period.
Finally, the associations of regional health insurance premiums with LE, cancer-free LE, and the burden of cancer were more prominent in males than females. Similar results have been reported in previous studies, which noted that household income or health insurance premiums did not significantly affect LE or HLE for females or showed a weaker correlation with LE in females than in males.7253132 In addition, some studies could not confirm a significant relationship between LE of females and the regional deprivation index, which is a comprehensive indicator of the socioeconomic deficiency level of a region,133 while others found only weaker associations of LE with the regional deprivation index for females than for males.34 A possible reason for the weak correlation between LE and cancer-free LE for females by eup/myeon/dong and regional health insurance premiums is that the total mortality rates for females (the main factor determining LE) by eup/myeon/dong are generally lower and the variations of regional LE for females are smaller than those for the male population. Moreover, this study assumed that the same regional health insurance premium was applied equally to all members of the same household, since the premiums are charged on a household basis. Therefore, the health insurance premium may not fully reflect the regional socioeconomic status of females.
This study has some limitations. In general, HLE varies depending on the type of health information and health status criteria used to calculate life expectancy. To calculate cancer-free LE, this study used information on hospitalization (more than once a year) or outpatient treatment (more than twice a year) for cancer disease from the Eligibility and Treatment DBs in the NHID. The cancer prevalence used in our study might be underestimated because we included patients who are actively involved in cancer treatment after cancer diagnosis and could not consider groups that have not been treated for cancer for various reasons in a community. It is also possible that the cancer prevalence could be overestimated if the events of hospitalization and outpatient treatment for cancer were caused by early diagnosis process of the suspected cancer rather than actual cancer treatment. Therefore, it may be difficult to compare the results of this study with those of other works that calculated cancer-free LE by using other cancer-related information or applying different criteria. Careful attention is therefore required to interpret the results of such studies. In addition, robust calculations of LE and cancer-free LE require data with at least 5,000 person-years from all regions.18 This study integrated the data of 25 regions with annual average populations by sex of less than 500 in 2008–2017 with those of neighboring regions, and as a result, the actual information of these regions was replaced by the LE and cancer-free LE of the adjacent areas. However, we were careful to integrate the data of regions that showed very similar socioeconomic and environmental characteristics by tracking changes in administrative district information.
Despite these limitations, this study produced valuable information on cancer-free LE and the burden of cancer at the eup/myeon/dong level in Korea. Moreover, this is the first study in Korea utilizing national health insurance premiums at the eup/myeon/dong level as a neighborhood SEP indicator. The significance of this work lies in its creation of the necessary foundation to determine regional priorities for implementing cancer-related regional health policies within small administrative areas and to evaluate the effectiveness of regional cancer management programs.
 XML Download