

 PDF
PDF Citation
 Print
Print


INTRODUCTION
Chronic rhinosinusitis (CRS) is one of the common medical conditions around the world and is characterized by local inflammation of the sinonasal mucosa.12 Symptoms of CRS persist for at least 12 weeks, resulting in a profound impact on patients' quality of life.3 CRS is further classified into 2 clinical phenotypes: chronic rhinosinusitis with nasal polyps (CRSwNP) and CRS without nasal polyps.4 Regardless of clinical phenotypes, endoscopic sinus surgery (ESS) is the mainstay treatment option for refractory CRS.5 However, there is still a 20–50% recurrence rate after ESS.6 Surgical outcomes can be determined by subjective nose-specific symptoms as well as objective findings measured by endoscopic examination and/or radiographic imaging. Given these, clarification of the risk factors of poor subjective and/or objective outcomes of ESS and establishment of predictive models with the risk factors can be helpful for physicians to predict ESS outcomes.
Many studies have reported the potential factors predicting ESS outcomes. One relatively well-studied factor is the presence of nasal polyps, unilateral or bilateral disease, and disease severity determined by computed tomography (CT) score and/or nasal endoscopic score.6 Additionally, comorbid diseases such as asthma, allergy, and gastroesophageal reflux disease, and demographic factors including age and gender, and previous history of ESS are also considered as risk factors.78910 Furthermore, recent studies have found that presence of osteitis involving bony paranasal sinuses, tissue eosinophilia and blood eosinophilia is significantly related to severity of CRS and poor postoperative outcomes.711121314 However, risk factors related to poor postoperative outcome are still controversial and remain unclear due to complicated pathophysiology of CRS. Moreover, risk factors related to poor ESS outcomes showed ethnic, geographic, and environmental differences and most studies were conducted in a single institution.
In this study, we demonstrated clinical features of CRS during the last 12 years and analyzed the prognostic factors of postoperative outcomes in CRS in a multicenter study in South Korea. Furthermore, we sought to establish the prediction model of risk factors for postoperative outcomes in CRS.
METHODS
Subjects
Adult CRS patients who received ESS were enrolled in this study. All CRS subjects met clinical criteria for CRS as defined by the EPOS guideline.1 The medical records were retrospectively analyzed at nine different medical institutions in 2005, 2010, and 2016. Patients who were younger than 18 years old and patients with antrochoanal polyp, postoperative cyst, mucocele, odontogenic sinusitis, and other benign or malignant tumors were excluded from this study.
According to the postoperative patient's subjective satisfaction and physician's objective satisfaction, postoperative outcomes were defined as good, moderate, and poor group. If a patient had no sinonasal discomfort after ESS, the patient was considered as good group, while poor was defined as the sinonasal symptoms not having improved at all after ESS. Physician's objective satisfaction was determined by postoperative endoscopic evaluation. If the sinonasal mucosa showed no abnormal findings, it was determined to be good, while poor was defined as presence of mucosal scarring, crusting, edema, polyps, and discharge. Postoperative status was determined at least 6 months after ESS.
Demographic factors including sex, age, smoking history, presence of atopy and asthma, nose-specific symptoms, and olfactory function were evaluated. Olfactory function including threshold, identification, and discrimination was assessed by the Korean version of the Sniffin' Stick test (KVSS II).15
CT severity
Severity of disease was determined by preoperative CT scans using the Lund-Mackay scoring system.16 Additionally, sinus dominancy was assessed by the ratio of the ethmoid sinus scores and maxillary sinus scores (E/M ratio). If the E/M ratio was lesser than 0.5, disease severity of the maxillary sinus was considered to be more severe than that of the ethmoid sinus. In contrast, if the E/M ratio was greater than 2, disease severity of the ethmoid sinus was considered to be more severe than that of the maxillary sinus. If E/M ratio is between 0.5 and 2, it was considered as “similar.”
Degree of eosinophilia in nasal tissue and peripheral blood
To assess the degree of eosinophilia in nasal tissue, nasal polyp tissues obtained during ESS were used. In the hematoxylin-and-eosin-stained tissue sections, the number of eosinophils in the submucosal area was counted in 5 high power field (HPF) by two independent physicians and the mean numbers of eosinophils were calculated.
In addition, eosinophilia in peripheral blood was also determined and expressed as counts and/or percentage.
Statistical analysis
Summary for variables were performed using descriptive analysis, the values of mean and standard deviation presented for quantitative variables and the values of frequency and percent for qualitative variables. For univariate analysis, comparisons by post-operative subjective satisfaction variable (good vs. moderate vs. poor) and objective satisfaction (good vs. moderate vs. poor) were performed using one-way analysis of variance and χ2 test. And multiple comparison result was performed by Scheffe method. To obtain cut-off points for quantitative variables, a simulation algorithm was used. The simulation algorithm was performed with the following steps: 1) divide the interval from minimum value to maximum value into 100 points 2) analyze using 100 points and carry out whether it is significant or not 3) find all cut-off points which analysis was significant 4) among the significant points, determine the cut-off point closest to the median value. For multivariate analysis, the multinomial logistic regression model with forward conditional method was used and the good satisfaction category was used as reference value. The results were expressed by odds ratio (OR), 95% confidence interval (CI) and P value. Finally, to obtain a prediction equation for postoperative objective satisfaction (good vs. moderate and poor), the binary logistic regression model was used and the value of prediction probability was calculated. The range of prediction probability value from prediction equation is 0 to 1. When the prediction probability value is greater than 0.5, the patient will be predicted as a good satisfaction group. And if the prediction probability value is less than 0.5, the patient will be predicted as a moderate and poor satisfaction group. The data analysis was performed by a medical statistician. All statistical analyses were performed using the IBM SPSS software package for Windows (version 19.0, Chicago, IL, USA). And all tests were 2-sided and P values of less than 0.05 indicated statistical significance.
RESULTS
Subject demographics and clinical characteristics of CRS
Patients' demographics are shown in Table 1. Of a total of 1,249 patients, 301 CRS patients in 2005, 466 patients in 2010, and 482 patients in 2016 were enrolled in this study.
Table 1
Demographic and clinical profiles of the patients
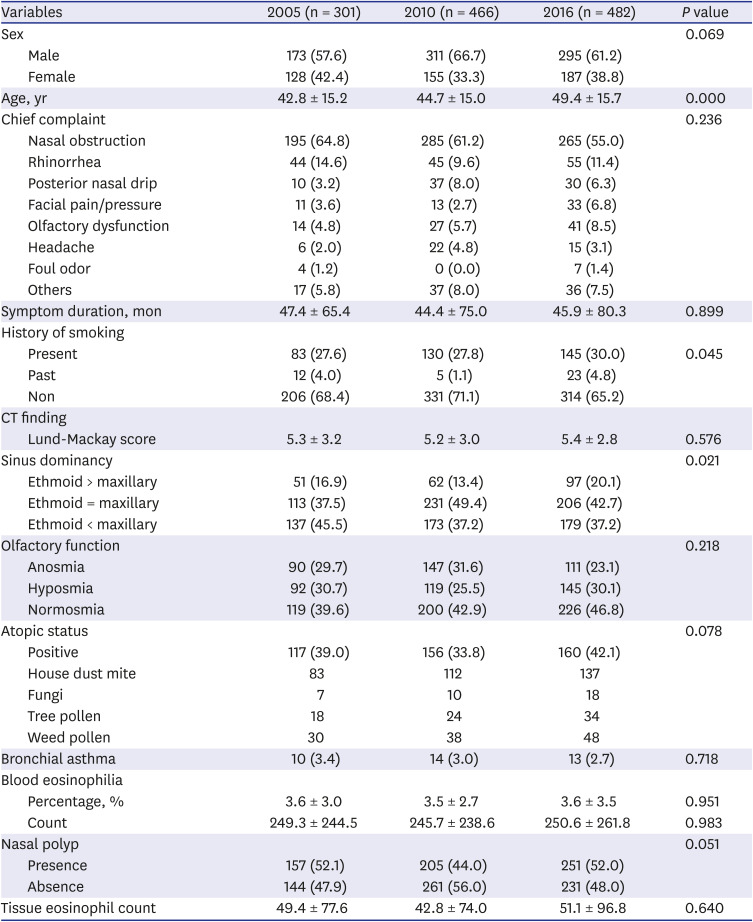
Among the demographic factors evaluated in this study, there was a significant difference in the mean age of patients among 2005, 2010, and 2016 (42.8 ± 15.2, 44.7 ± 15.0, and 49.4 ± 15.7, respectively; P < 0.01). Additionally, history of smoking among 3 different years (P = 0.045, Table 1).
Regarding disease severity determined by CT, there was no significant difference in Lund-Mackay score (LMS) among groups. Interestingly, we found a significantly different trend in sinus dominancy, showing more common ethmoid sinus dominancy in patients in 2016 compared to those in the other years (P = 0.021; Table 1). In addition, we couldn't find any significant difference in nose-specific symptoms, olfactory impairment, presence of asthma, and blood eosinophilia (Table 1).
Risk factors for postoperative subjective outcomes
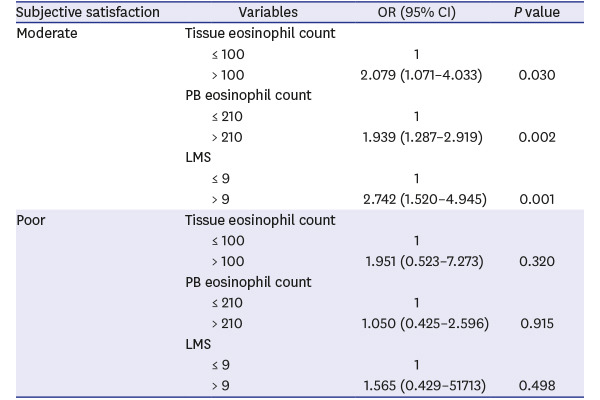
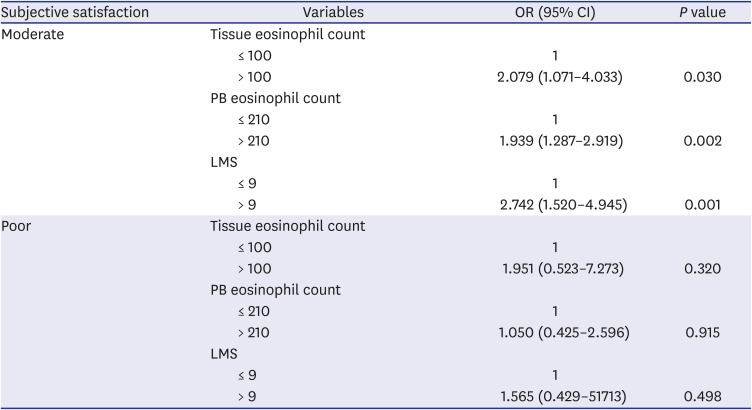
In total patients, 61.6% (n = 769) of patients were satisfied, 32.3% (n = 404) moderate, and 6.1% (n = 76) not satisfied, subjectively. To identify the risk factors related to postoperative subjective satisfaction, univariate analysis was performed. In univariate analysis (Table 2), we found that risk factors included LMS, the presence of nasal polyp, blood eosinophil count, and tissue eosinophil count. When we determined the cutoff point for these risk factors, the mean LMS was 9, blood eosinophil count was 210, tissue eosinophil count was 100. The risk factors identified by univariate analysis were further introduced into a stepwise regression model to identify the independent risk factors for moderate and poor postoperative subjective outcomes. In the multivariate analysis, it has been revealed that tissue and blood eosinophilia, and LMS were independent risk factors for moderate postoperative subjective outcomes (Table 3). When tissue eosinophil count was > 100, its adjusted OR was 2.079 (95% CI, 1.071–4.033; P = 0.030). When blood eosinophil count was > 210, its adjusted OR was 1.939 (95% CI, 1.287–2.919; P = 0.002). When the LMS was > 9, its adjusted OR was 2.742 (95% CI, 1.520–4.945; P = 0.001). However, due to too small number of patients in poor group (n = 76), we could not find any statistically significant risk factors for poor postoperative subjective outcomes (Table 3).
Table 2
Risk factors related to postoperative subjective satisfaction: univariate analysis
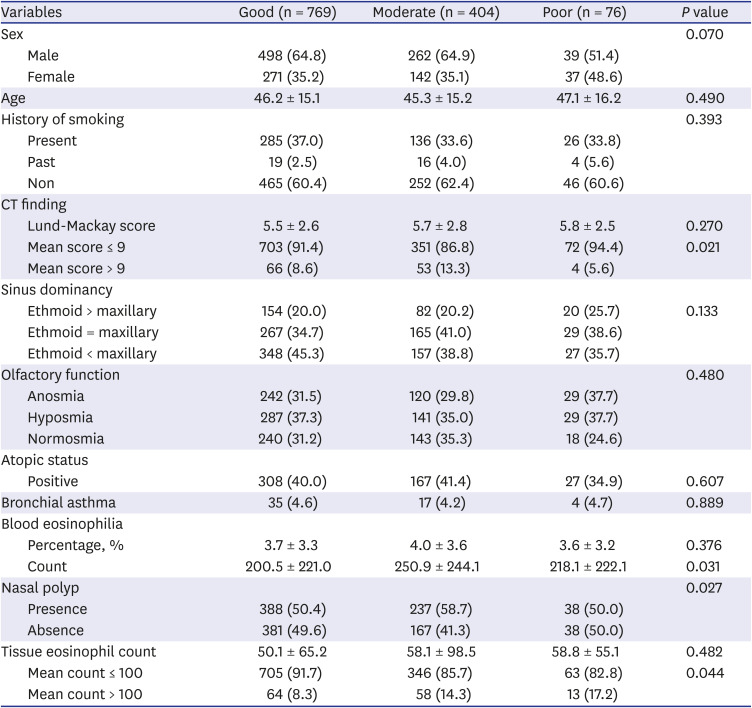
Table 3
Risk factors related to post-operative subjective satisfaction: multivariate logistic regression analysis
Risk factors for postoperative objective outcomes
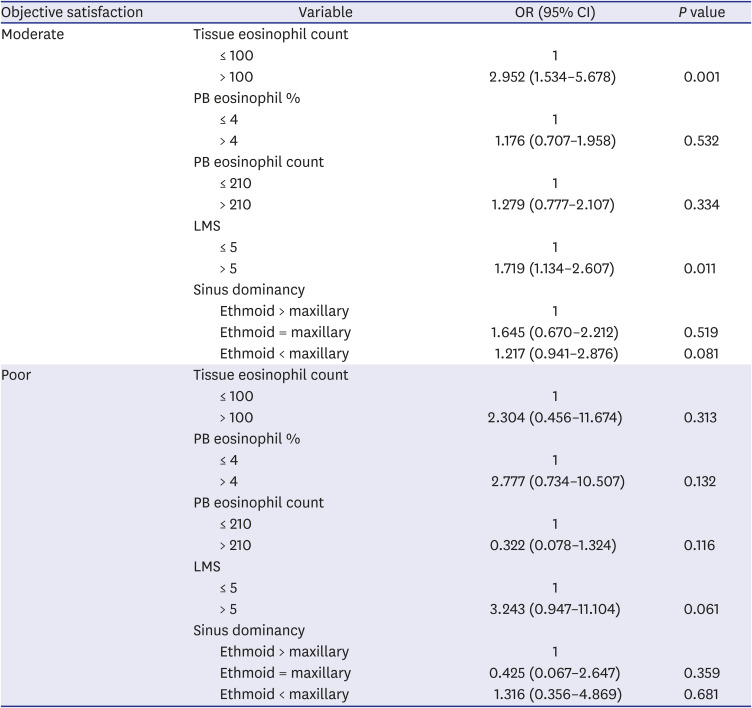
In terms of objective postoperative satisfaction, 73.0% (n = 912) of patients were satisfied, 23.8% (n = 297) moderate, and 3.2% (n = 40) not satisfied subjectively. In univariate analysis (Table 4), we found that risk factors included LMS (mean score > 5), sinus dominancy (ethmoid sinus > maxillary sinus), blood eosinophilia (mean % > 4 and mean count > 210), and tissue eosinophil count (mean count > 100). The risk factors that proved significant in the univariate analysis were included in the multivariate analysis. As a result, the maximum contribution for moderate postoperative objective outcome was tissue eosinophilia (OR, 2.952; 95% CI, 1.534–5.678; P = 0.001), followed by LMS (OR, 1.719; 95% CI, 1.134–2.607; P = 0.011). However, like subjective outcomes, we could not find any statistically significant risk factors for poor postoperative objective outcomes due to the small number of patients in the poor group (n = 40; Table 5).
Table 4
Risk factors related to endoscopic objective satisfaction: univariate analysis
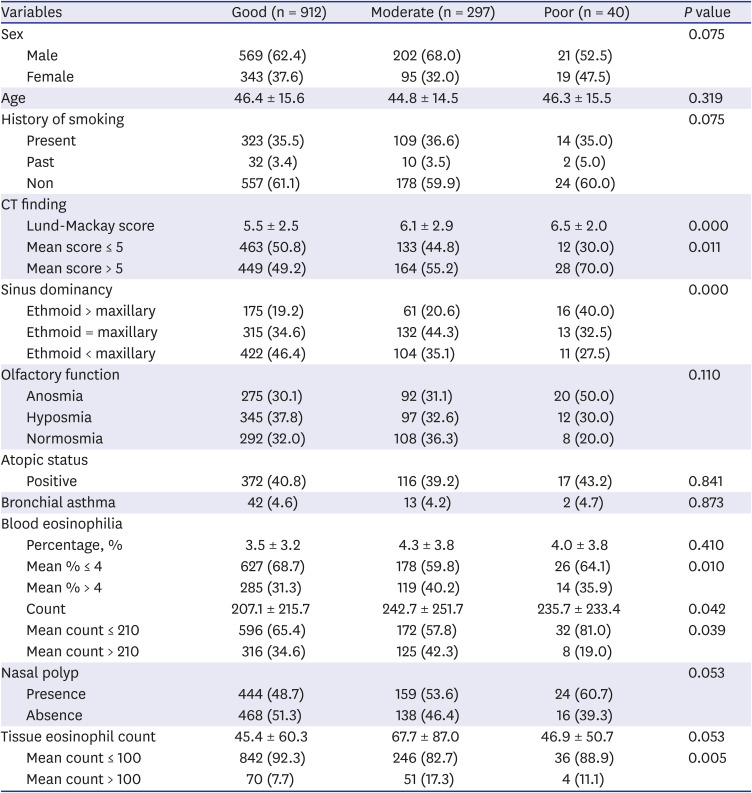
Table 5
Risk factors related to endoscopic objective satisfaction: multivariate logistic regression analysis
Prediction model for postoperative outcomes
To establish a risk model of postoperative objective outcome, we combined the moderate and poor group of patients and risk factors shown from the multivariate analysis were used. Based on logistic regression equation, multivariate logistic regression predictive model that calculated the risk of post-operative objective satisfaction after ESS for CRS was developed. The value of prediction probability (P) is P = 1 / (1 + A), where A = exp [−0.392 + 1.088 × tissue eosinophil count (> 100) + 0.123 × mean LMS (> 5) −0.366 × sinus dominancy (maxillary) + 0.064 × sinus dominancy (similar) + 0.200 × PB eosinophil % (4%) + 0.344 × PB eosinophil count (> 210)]. When the prediction probability value is greater than 0.5, the patient will be predicted as a good satisfaction group. And when the prediction probability value is less than 0.5, the patient will be predicted as a moderate/poor satisfaction group. To test the model if it had the ability to predict postoperative satisfaction, an alpha value of 5% was considered as the threshold for significance. Applying training samples showed that the accuracy, sensitivity, specificity, positive predictive value and negative predictive value was 70.30%, 76.19%, 42.13%, 86.29%, and 27.00%, respectively.
DISCUSSION
In this study, we demonstrated clinical features of CRS during the last 12 years, showing recent patients who underwent ESS in 2016 shows significant difference in age, ethmoid sinus dominancy, and smoking status, compared to those in the other years (all, P < 0.05; Table 1). Although we collected data from three different years (2005, 2010, and 2016) and four different seasons (spring: April, summer: July, autumn: October, and winter; January), the year and season of ESS performed did not influence the results of ESS (data not shown). Furthermore, we found that tissue eosinophilia, and LMS were significant independent risk factors for poor postoperative subjective and objective outcomes (Tables 3 and 5). Additionally, blood eosinophilia also contributed to poor subjective post ESS outcomes. Finally, with these risk factors, we established a prediction model for poor prognosis of ESS in patients with CRS. To our knowledge, this is the first study to comprehensively analyze the prognostic factors in multiple centers in Korea.
Consistent with our study, previous studies have found that preoperative disease extents determined by CT and the presence of nasal polyps could be related to poor prognosis of ESS.1017 Grgic et al.17 reported that patients with a worse preoperative CT score showed less improvement postoperatively while they did not find a correlation between preoperative endoscopic score and postoperative recurrence. In another recent study, high CT score was recognized as an independent risk factor for poorly controlled CRS after ESS in Chinese population.10 Furthermore, it has been demonstrated that preoperative CT score of the olfactory cleft is predictive for worse olfactory outcome.18 In contrast, there are several studies showing that CT scores are not significantly related to revision surgery after ESS as well as subjective outcomes.919 In addition to severity of CRS determined by total CT score, it has been demonstrated that ethmoid-dominant characteristics in CT scans are likely to be a risk factor for poor prognosis after surgery.710 In our study, we found the predominance of ethmoid sinusitis in CT scans in patients with poor postoperative objective outcome in univariate analysis, but not in multivariate analysis. Thus, future studies are warranted to confirm these discrepancies.
Another factor that significantly influenced postoperative outcome was eosinophilia especially in nasal tissue. We found that tissue eosinophil count (mean count > 100) was significantly related to poor postoperative outcomes both subjectively and objectively. Furthermore, in multivariate analysis, tissue eosinophilia was the most important contributor for poor objective outcome, showing adjusted OR 2.952. Clinical implication of tissue eosinophilia has been emphasized in numerous studies, especially in Western population.2021 The presence of eosinophilia in nasal tissue from CRSwNP patients is known to be related to disease severity, less improvement in both nose-specific and general quality of life, and higher recurrence rate of nasal polyp.2021 Even though definition of tissue eosinophilia is not defined yet, degree of eosinophilic infiltration may represent the distinct endotype of CRS, showing difference in not only histologic appearance but also in genetic and protein expression patterns of inflammatory mediators.22 It is widely accepted that CRSwNP is frequently associated with type 2 inflammation and tissue eosinophilia especially in Western countries.23 However, recent studies have revealed that the percentage of type 2 signature disease in patients with CRS is dramatically increasing in Asian countries including Korea, Japan, and China over the last 20 years.724 Supporting our results, Tokunaga et al.7 showed that tissue eosinophilia of 70 or higher eosinophils/HPF was significantly correlated with recurrence after ESS. Altogether, since the implication of tissue eosinophilia on disease course of CRS as well as prognosis of treatment outcome in Asia is rising, further studies identifying the role of tissue eosinophilia is warranted for Asian CRS patients.
In addition, we also found that blood eosinophilia is closely related to subjective postoperative satisfaction, showing adjusted OR as 1.939. Similar to the results of the present study, it has been shown that blood eosinophilia over 5% was associated with poor postoperative outcomes in Japanese population.7 Aslan et al.25 also reported that mucosal and peripheral eosinophilia can be used as a marker to predict disease severity in nasal polyps and Kountakis et al.21 found a correlation between peripheral eosinophil count and preoperative CT scores as well as endoscopic scores. Although we found statistical significance in univariate analysis for the risk factors for objective postoperative outcome, we couldn't find statistical significance in multivariate analysis. Further studies are warranted to confirm whether peripheral blood eosinophilia is one of the risk factors for poor prognosis of ESS.
Lastly, in this study, we established the prediction equation for poor prognosis of ESS by using potential risk factors identified from univariate and multivariate analysis including tissue eosinophil count (> 100), blood eosinophil count (> 210), blood eosinophil % (> 4%), LMS (> 5), and sinus dominancy. Since the prediction model is based on routine preoperative blood test, preoperative CT scan, and intraoperative pathology specimen, an otolaryngologist could easily predict the prognosis of ESS with tests that are required for CRS patients who underwent surgery and further tests are not necessary. Of note, our prediction model might provide useful clinical information for physicians to predict patients who needs strict postoperative management after ESS. Though prediction equation was not established as shown in our study, a recent study demonstrated prediction models for uncontrolled CRS after surgical treatment in Chinese population.10 Supporting our results, 2 separate models have been generated in their study, showing a pathologic model based on tissue eosinophil ratio > 0.206 and CT scores and a clinical model based on combination of blood eosinophil ratio > 0.025 and CT scores.
This study has several limitations. First, the number of patients who were classified as poor postoperative outcome subjectively and objectively was too small. Future studies including enough number of patients will provide definite risk factors to distinguish moderate and poor postoperative outcomes. Second, preoperative and postoperative information was retrospectively obtained from medical records of 9 different tertiary medical centers. Therefore, there was no standardized patient care protocol and information about tissue collecting site could not be gathered. Future prospective studies are required to improve accuracy. Another possible limitation is that since all of the patients were recruited from tertiary medical centers, more severe patients with CRS could be included in this study. Further research will be helpful to generalize our findings.
 XML Download