

 PDF
PDF Citation
 Print
Print


Highlights
INTRODUCTION
METHODS
Study population
Measurement of steatosis burden and albuminuria
Clinical parameters and biochemical analysis
Statistical analysis
RESULTS
Baseline characteristics of the study population
Table 1.
Values are presented as mean±standard deviation, number (%), or median (interquartile range).
T2DM, type 2 diabetes mellitus; SBP, systolic blood pressure; DBP, diastolic blood pressure; FPG, fasting plasma glucose; HbA1c, glycosylated hemoglobin; PPPG, postprandial plasma glucose; BUN, blood urea nitrogen; eGFR, estimated glomerular filtration rate; HDL-C, high density lipoprotein cholesterol; LDL-C, low density lipoprotein cholesterol; AST, aspartate transaminase; ALT, alanine transferase; γ-GT, gamma glutamyltransferase; HOMA-IR, homeostatic model assessment of insulin resistance; CAP, controlled attenuation parameter; ACR, albumin-to-creatinine ratio; ACE, angiotensin-converting enzyme; ARB, angiotensin II receptor blocker.
![]()
Correlation between CAP and urinary ACR
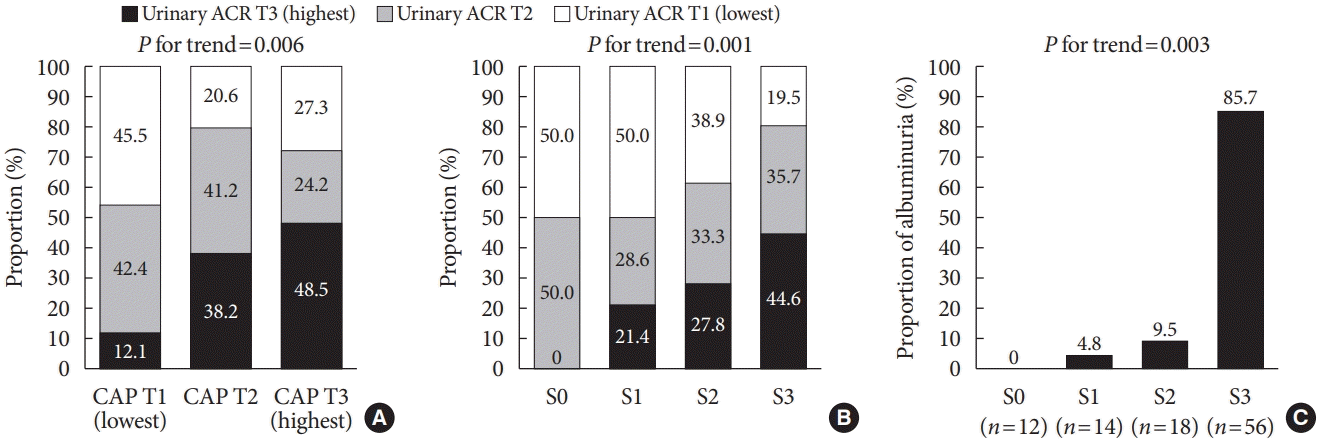 | Fig. 1.Association between albuminuria and steatosis burden. (A) Association of urinary albumin-to-creatinine ratio (ACR) with controlled attenuation parameter (CAP) by tertiles. T1 for the lowest tertile, T2 for middle tertile, and T3 for the highest tertile group. (B) Association of urinary ACR tertiles according to the steatosis grade. T1 for the lowest tertile, T2 for middle tertile, and T3 for the highest tertile group. (C) Proportion of albuminuria (urinary ACR ≥30 mg/g) according to the steatosis grade. The steatosis grade (S) was determined using the following CAP-cutoff values: 236 dB/m for S ≥1, 270 dB/m for S ≥2, and 302 dB/m for S ≥3.
|
Table 2.
| Parameter | r | P value |
|---|---|---|
| Age, yr | –0.321 | 0.001 |
| BMI, kg/m2 | 0.449 | <0.001 |
| Waist circumference, cm | 0.339 | 0.001 |
| Duration of T2DM, yr | –0.266 | 0.007 |
| Presence of diabetic retinopathy | –0.081 | 0.421 |
| ACE inhibitor/ARB use | 0.018 | 0.858 |
| FPG, mg/dL | –0.101 | 0.316 |
| HbA1c, % | –0.065 | 0.521 |
| PPPG, mg/dL | –0.035 | 0.730 |
| AST, IU/La | 0.192 | 0.056 |
| ALT, IU/La | 0.319 | 0.001 |
| γ-GT, IU/La | 0.281 | 0.005 |
| Triglyceride, mg/dLa | 0.281 | 0.005 |
| LDL-C, mg/dLa | 0.101 | 0.322 |
| HOMA-IRa | 0.113 | 0.301 |
| eGFR, mL/min/1.73 m2 | 0.166 | 0.099 |
| Urinary ACR, mg/g creatininea | 0.331 | 0.001 |
CAP, controlled attenuation parameter; BMI, body mass index; T2DM, type 2 diabetes mellitus; ACE, angiotensin-converting enzyme; ARB, angiotensin II receptor blocker; FPG, fasting plasma glucose; HbA1c, glycosylated hemoglobin; PPPG, postprandial plasma glucose; AST, aspartate transaminase; ALT, alanine transferase; γ-GT, gamma glutamyltransferase; LDL-C, low density lipoprotein cholesterol; HOMA-IR, homeostatic model assessment of insulin resistance; eGFR, estimated glomerular filtration rate; ACR, albumin-to-creatinine ratio.
![]()
Table 3.
| Variable |
Model 1 |
Model 2 |
Model 3 |
Model 4 |
||||
|---|---|---|---|---|---|---|---|---|
| STD β | P value | STD β | P value | STD β | P value | STD β | P value | |
| Duration of T2DM, yr | –0.160 | 0.135 | - | - | - | - | - | - |
| Diabetic retinopathy | –0.414 | 0.680 | - | - | - | - | - | - |
| ACE inhibitor/ARB use | 0.382 | 0.704 | - | - | - | - | - | - |
| HbA1c, % | –0.177 | 0.083 | –0.157 | 0.131 | - | - | - | - |
| ALT, IU/La | 0.153 | 0.119 | 0.195 | 0.081 | - | - | - | - |
| γ-GT, IU/La | 0.096 | 0.344 | 0.060 | 0.574 | - | - | - | - |
| Triglyceride, mg/dLa | 0.198 | 0.062 | 0.213 | 0.047 | - | - | - | - |
| BMI, kg/m2 | 0.391 | 0.001 | 0.380 | <0.001 | 0.364 | <0.001 | - | - |
| Waist circumference, cm | 0.287 | 0.003 | 0.284 | 0.006 | 0.300 | 0.003 | - | - |
| Urinary ACR, mg/g creatininea | 0.305 | 0.001 | 0.321 | 0.001 | 0.299 | 0.004 | 0.321 | 0.001 |
Model 1: adjusted for age and sex; Model 2: adjusted for Model 1+duration of T2DM, diabetic retinopathy and ACE inhibitor/ARB use; Model 3: adjusted for Model 2+glycated hemoglobin, alanine aminotransferasea, gamma glutamyl transferasea and triglyceridea; Model 4: adjusted for Model 3+body mass index and waist circumference.
CAP, controlled attenuation parameter; STD, standardized coefficient; T2DM, type 2 diabetes mellitus; ACE, angiotensin-converting enzyme; ARB, angiotensin II receptor blocker; HbA1c, glycosylated hemoglobin; ALT, alanine transferase; γ-GT, gamma glutamyltransferase; BMI, body mass index; ACR, albumin-to-creatinine ratio.
![]()
Association between significant steatosis and urinary ACR
Table 4.
| Parameter | Odds ratio (95% CI) | P value |
|---|---|---|
| Univariate logistic regression analysis | ||
| Age, yr | 0.97 (0.94–0.99) | 0.030 |
| Male sex | 1.05 (0.48–2.32) | 0.897 |
| BMI, kg/m2 | 1.29 (1.13–1.48) | <0.001 |
| Waist circumference, cm | 1.02 (1.02–1.11) | 0.008 |
| Duration of T2DM, yr | 0.94 (0.89–0.99) | 0.034 |
| ACE inhibitors or ARB use | 0.27 (0.28–1.44) | 0.273 |
| HbA1c, % | 1.00 (0.83–1.21) | 0.986 |
| HOMA-IRa | 1.32 (0.85–2.05) | 0.223 |
| AST, IU/La | 1.22 (0.52–2.86) | 0.643 |
| ALT, IU/La | 1.36 (0.74–2.51) | 0.328 |
| γ-GT, IU/La | 1.33 (0.76–2.32) | 0.317 |
| Triglyceride, mg/dLa | 2.43 (1.04–5.68) | 0.040 |
| LDL-C, mg/dLa | 3.79 (1.36–10.55) | 0.011 |
| Urinary ACR, mg/g creatininea | 1.54 (1.17–2.03) | 0.002 |
| Multivariable logistic regression analysis | ||
| Age, yr | 1.02 (0.98–1.06) | 0.443 |
| BMI, kg/m2 | 1.34 (1.15–1.57) | <0.001 |
| Duration of T2DM, yr | 0.97 (0.89–1.05) | 0.475 |
| ACE inhibitors or ARB use | 0.38 (0.12–1.14) | 0.085 |
| LDL-C, mg/dLa | 4.33 (1.20–15.63) | 0.025 |
| Urinary ACR, mg/g creatininea | 1.88 (1.31–2.71) | 0.001 |
CI, confidence interval; BMI, body mass index; T2DM, type 2 diabetes mellitus; ACE, angiotensin-converting enzyme; ARB, angiotensin II receptor blocker; HbA1c, glycosylated hemoglobin; HOMA-IR, homeostatic model assessment of insulin resistance; AST, aspartate transaminase; ALT, alanine transferase; γ-GT, gamma glutamyltransferase; LDL-C, low density lipoprotein cholesterol; ACR, albumin-to-creatinine ratio.
![]()
 XML Download