INTRODUCTION
METHODS
Study population
Outcomes
Statistical analyses
RESULTS
Table 1.
| Variable | Total (n=194) |
Time to reach target HbA1c (<7.0%) |
P value | |||
|---|---|---|---|---|---|---|
| <3 months (n=116) | 3–6 months (n=39) | ≥6 months (n=39) | ||||
| Age, yr | 54.7±11.7 | 54.0±11.5 | 58.1±12.2 | 53.3±11.5 | 0.120 | |
| Male sex | 119 (61.3) | 81 (69.8) | 17 (43.6) | 21 (53.8) | 0.021 | |
| Weight, kg | 69.6±13.7 | 71.3±14.1 | 67.1±10.5 | 66.8±14.4 | 0.095 | |
| Body mass index, kg/m2 | 25.6±4.0 | 25.9±4.3 | 25.4±2.8 | 24.9±3.8 | 0.352 | |
| Waist circumference, cm | 87.6±12.5 | 88.1±14.2 | 88.7±8.5 | 85.2±10.2 | 0.404 | |
| Smoking | 0.046 | |||||
| None/Former/Current | 84 (43.3)/37 (19.1)/73 (37.6) | 44 (37.9)/21 (18.1)/51 (44.0) | 20 (51.3)/8 (20.5)/11 (28.2) | 20 (51.3)/8 (20.5)/11 (28.2) | ||
| Alcohol | 0.217 | |||||
| No/Yes | 96 (49.5)/98 (50.5) | 53 (45.7)/63 (54.3) | 24 (61.5)/15 (38.5) | 19 (48.7)/20 (51.3) | ||
| Education | 0.029 | |||||
| Less than middle school | 39 (20.1) | 18 (17.0) | 11 (34.4) | 10 (26.3) | ||
| High school | 70 (36.1) | 41 (38.7) | 11 (34.4) | 18 (47.4) | ||
| More than college | 67 (34.5) | 47 (44.3) | 10 (31.3) | 10 (26.3) | ||
| Exercise | 0.962 | |||||
| None | 115 (59.3) | 68 (59.6) | 23 (59.0) | 24 (61.5) | ||
| ≤2 times weekly | 13 (6.7) | 9 (7.9) | 1 (2.6) | 3 (7.7) | ||
| ≥3 times weekly | 64 (33.0) | 37 (32.5) | 15 (38.5) | 12 (30.8) | ||
| Glucose, fasting, mg/dL | 166.9±64.6 | 161.39±63.6 | 165.6±65.8 | 185.3±64.6 | 0.147 | |
| HbA1c at diagnosis, % | 9.1±2.3 | 8.9±2.3 | 8.9±2.3 | 9.7±2.3 | 0.149 | |
| C-peptide, fasting, ng/mLa | 2.13±1.09 | 2.3±1.1 | 2.1±1.1 | 1.8±0.7 | 0.065 | |
| Serum creatinine, mg/dL | 0.85±0.18 | 0.8±0.2 | 0.8±0.2 | 0.9±0.2 | 0.884 | |
| Estimated GFR, mL/min/1.73 m2 | 88.3±20.6 | 90.2±19.5 | 86.0±18.2 | 85.0±25.3 | 0.291 | |
| SBP, mm Hg | 127.0±15.9 | 125.8±14.2 | 127.5±16.2 | 130.1±20.1 | 0.348 | |
| HDL-C, mg/dL | 46.0±10.9 | 45.7±9.7 | 47.7±13.1 | 45.3±12.2 | 0.553 | |
| LDL-C, mg/dL | 96.1±32.6 | 94.1±36.0 | 97.3±25.1 | 101.1±28.1 | 0.601 | |
| Triglyceride, mg/dL | 164.3±125.4 | 153.1±81.6 | 177.2±216.3 | 185.0±108.0 | 0.309 | |
| Treatment | ||||||
| Metformin | 157 (80.9) | 93 (80.2) | 33 (84.6) | 31 (79.5) | 0.523 | |
| Sulfonylurea | 74 (38.1) | 37 (31.9) | 15 (38.5) | 22 (56.4) | 0.010 | |
| Meglitinide | 11 (5.7) | 4 (3.4) | 2 (5.1) | 5 (12.8) | 0.050 | |
| DPP-4 inhibitor | 33 (17.0) | 17 (14.7) | 8 (20.5) | 8 (20.5) | 0.343 | |
| Thiazolidinedione | 19 (9.8) | 12 (10.3) | 3 (7.7) | 4 (10.3) | 0.516 | |
| α-Glucosidase inhibitor | 3 (1.5) | 2 (1.7) | 0 | 1 (2.6) | 0.853 | |
| Insulin | 48 (24.7) | 25 (21.6) | 8 (20.5) | 15 (38.5) | 0.063 | |
| Statin | 98 (50.5) | 72 (85.7) | 28 (93.3) | 29 (93.5) | 0.385 | |
| RAS inhibitor | 50 (25.8) | 23 (27.4) | 8 (26.7) | 10 (32.3) | 0.875 | |
| Anti-thrombotics | 45 (23.2) | 27 (32.1) | 11 (36.7) | 8 (25.8) | 0.688 | |
Values are presented as mean±standard deviation or number (%).
HbA1c, glycosylated hemoglobin; GFR, glomerular filtration rate; SBP, systolic blood pressure; HDL-C, high-density lipoprotein cholesterol; LDL-C, low-density lipoprotein cholesterol; DPP-4, dipeptidyl peptidase-4; RAS, renin-angiotensin-aldosterone system.
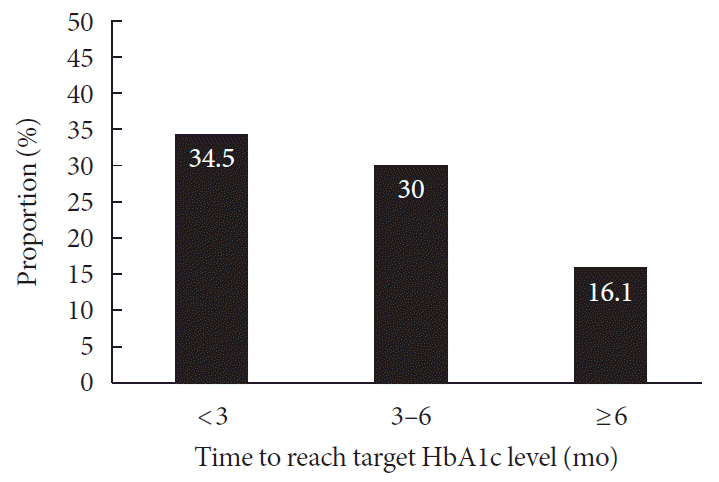
Time to target HbA1c achievement and long-term durable glycemic control
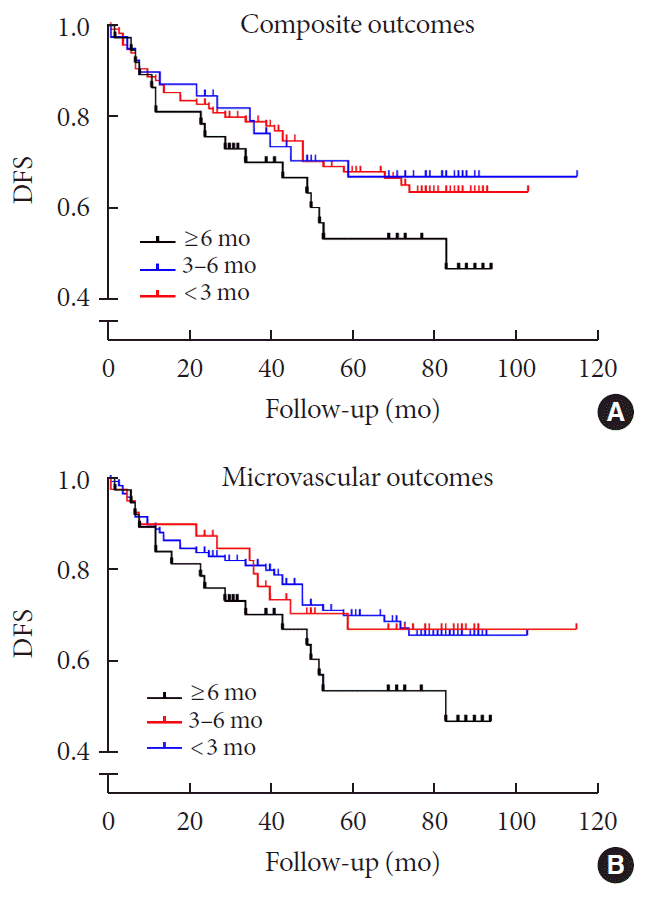
Time to target HbA1c achievement and microvascular and macrovascular events
Table 2.
| Time to reach target HbA1c |
No. of events (%) |
Adjusted Hra |
|||||
|---|---|---|---|---|---|---|---|
| <3 months (n=116) | 3–6 months (n=39) | ≥6 months (n=39) | <3 months (n=116) | 3–6 months (n=39) | ≥6 months (n=39) | ||
| Composite complications | 37 (31.9) | 12 (30.8) | 19 (48.7) | 0.47 (0.26–0.86) | 0.50 (0.23–1.10) | 1 (Reference) | |
| Microvascular complications | 35 (30.2) | 12 (30.8) | 19 (48.7) | 0.42 (0.23–0.77) | 0.48 (0.22–1.05) | 1 (Reference) | |
| Diabetic retinopathy | 23 (23.2) | 6 (16.2) | 10 (27.8) | 0.72 (0.27–1.90) | 0.56 (0.17–1.89) | 1 (Reference) | |
| Diabetic neuropathy | 14 (14.4) | 8 (21.6) | 8 (22.2) | 0.60 (0.21–1.74) | 1.26 (0.37–4.30) | 1 (Reference) | |
| Diabetic nephropathy | 16 (18.8) | 3 (10.0) | 8 (25.8) | 0.36 (0.12–1.10) | 0.23 (0.05–1.19) | 1 (Reference) | |
| Macrovascular complications | 7 (6.0) | 3 (7.7) | 4 (10.3) | 0.37 (0.07–2.13) | 0.72 (0.11–4.62) | 1 (Reference) | |
| Ischemic heart disease | 4 (4.8) | 2 (6.7) | 3 (9.4) | 0.35 (0.04–3.54) | 0.41 (0.03–5.24) | 1 (Reference) | |
| Ischemic stroke | 2 (2.4) | 1 (3.3) | - | - | - | - | |
| Peripheral artery disease | 1 (1.2) | 1 (3.3) | 1 (3.2) | 0.34 (0.01–9.79) | 1.31 (0.03–51.21) | 1 (Reference) | |
a Adjusted for age, sex, body mass index, smoking, alcohol, education, physical activity, mean low-density lipoprotein cholesterol, mean systolic blood pressure, baseline estimated glomerular filtration rate, glucose-lowering agents, antithrombotic agents, statins, antihypertensive drugs, and baseline HbA1c.
Fig. 2.


 PDF
PDF Citation
 Print
Print


 XML Download