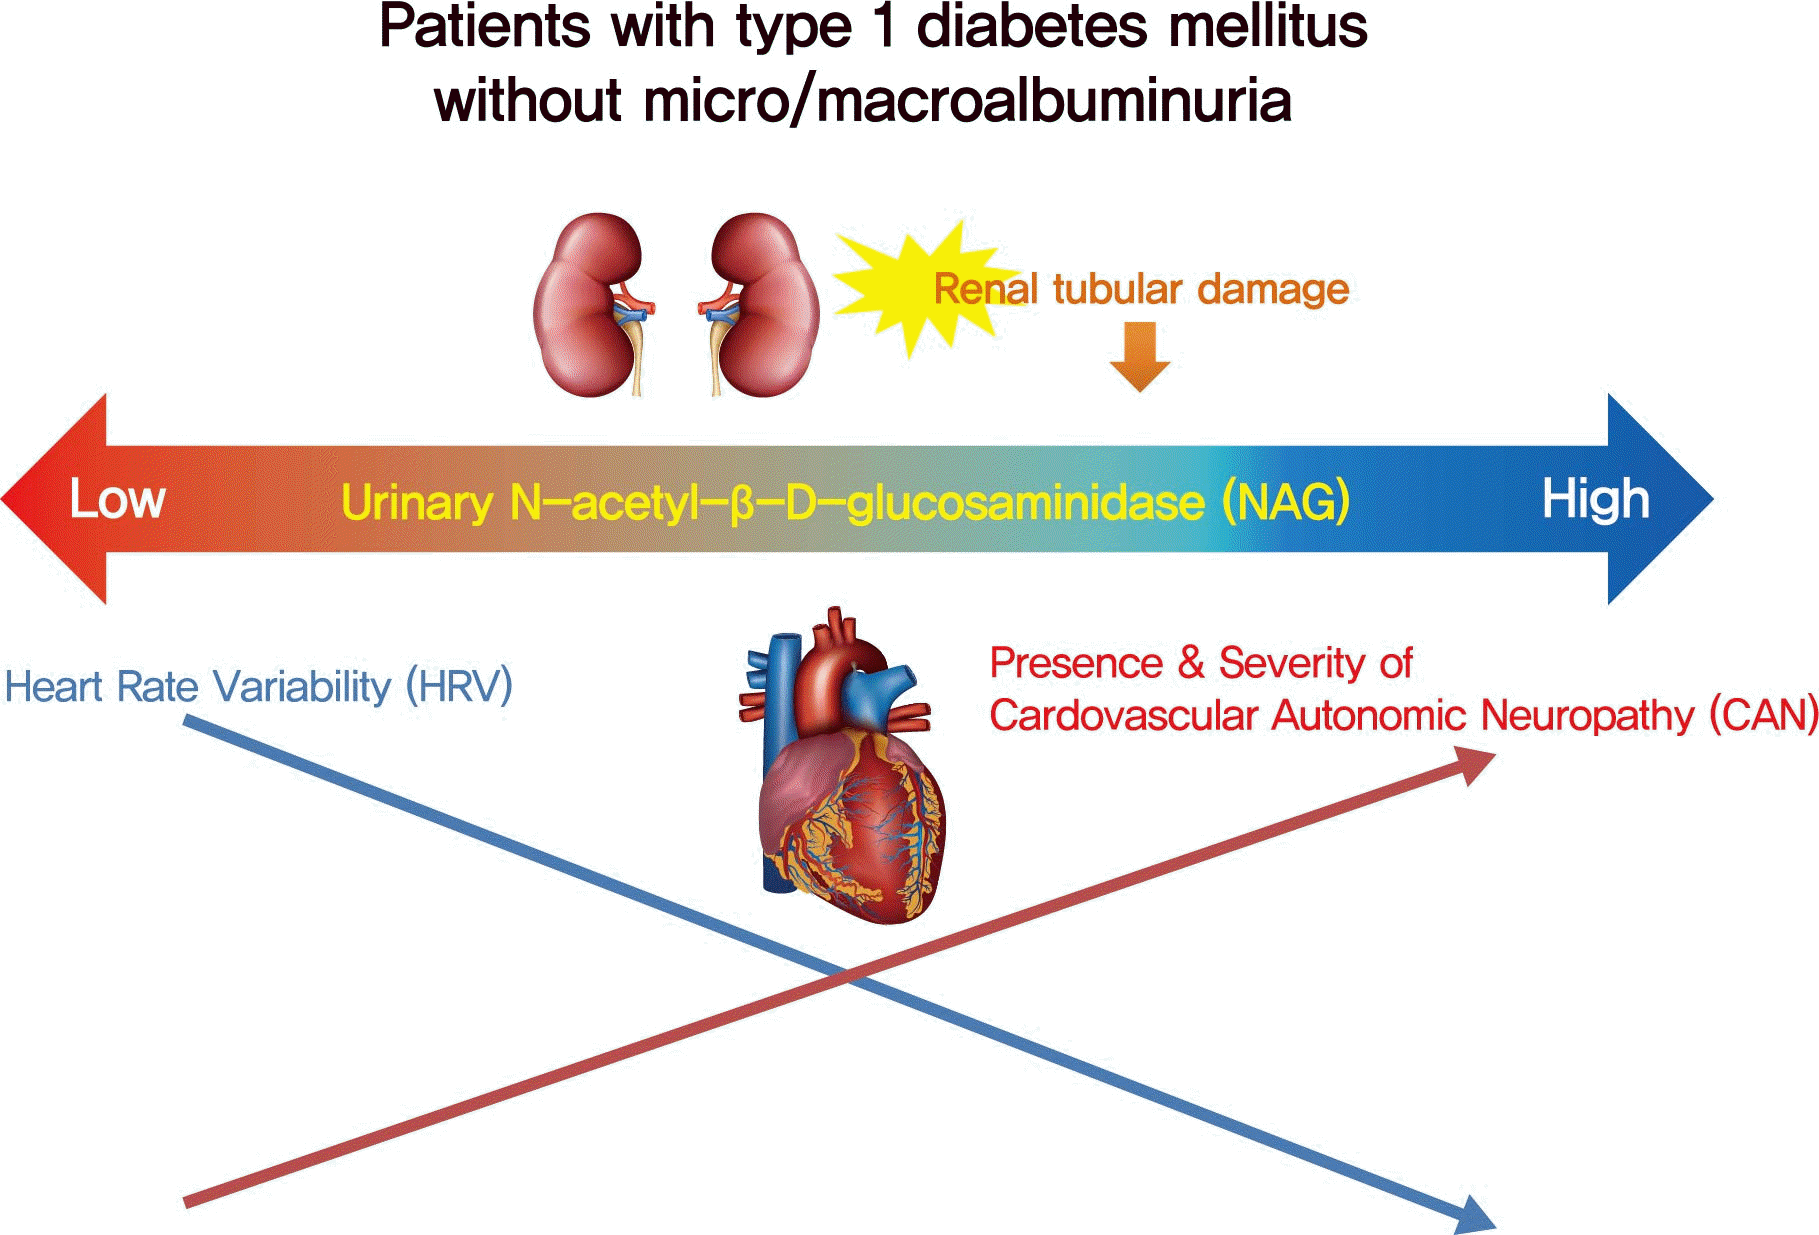
Highlights
INTRODUCTION
METHODS
Inclusion and exclusion criteria
Assessment of urinary markers
Assessment of cardiovascular autonomic neuropathy
Assessment of other clinical variables
Statistical analyses
RESULTS
Study subjects
Table 1.
| Characteristic | Total (n=247) | No CAN (n=207, 83.8%) | CAN (n=40, 16.2%) | P value |
|---|---|---|---|---|
| Age, yr | 38.2±12.1 | 39.3±12.5 | 32.6±7.8 | 0.001 |
| Male sex | 106 (42.9) | 90 (43.5) | 16 (40.0) | 0.684 |
| Duration of diabetes, yr | 10.8±7.5 | 10.6±7.3 | 11.8±8.2 | 0.367 |
| Body mass index, kg/m2 | 22.7±3.5 | 22.8±3.4 | 22.4±3.8 | 0.496 |
| Current smokera | 19 (9.3) | 16 (9.5) | 3 (8.6) | 0.868 |
| Hypertension | 62 (25.1) | 49 (23.7) | 13 (32.5) | 0.409 |
| Systolic BP, mm Hg | 119.4±16.0 | 119.8±16.3 | 117.4±14.6 | 0.389 |
| Diastolic BP, mm Hg | 74.8±10.6 | 74.7±10.4 | 75.4±11.8 | 0.739 |
| Fasting plasma glucose, mg/dL | 157.3±67.6 | 154.3±66.7 | 172.8±71.3 | 0.115 |
| HbA1c, % | 7.4 (6.7–8.3) | 7.3 (6.6–8.3) | 7.7 (7.1–8.7) | 0.076 |
| <7.0 | 79 (32.0) | 70 (33.8) | 9 (22.5) | 0.160 |
| ≥7.0 and <9.0 | 137 (55.5) | 115 (55.6) | 22 (55.0) | 0.948 |
| ≥9.0 | 31 (12.6) | 22 (10.6) | 9 (22.5) | 0.038 |
| Glycoalbumin, % | 22.5±5.9 | 22.2±5.7 | 24.4±7.0 | 0.067 |
| Glycoalbumin-to-A1c ratio | 2.9±0.4 | 2.9±0.4 | 3.0±0.4 | 0.296 |
| C-peptide, ng/mLb | 0.02 (0.02–0.23) | 0.02 (0.02–0.23) | 0.02 (0.02–0.39) | 0.521 |
| eGFR, mL/min/1.73 m2 | 106.0±15.2 | 105.2±14.4 | 114.1±14.4 | <0.001 |
| ≥60 and <90 | 36 (14.6) | 31 (15.0) | 5 (12.5) | 0.685 |
| ≥90 | 211 (85.4) | 176 (85.0) | 35 (87.5) | 0.685 |
| Urinary NAG, IU/gCr | 6.2 (4.1–8.6) | 6.10(3.9–8.2) | 6.4 (4.6–11.0) | 0.120 |
| Lipid profiles, mg/dL | ||||
| Total cholesterol | 171.3±31.8 | 170.0±30.5 | 178.0±37.5 | 0.150 |
| Triglycerides | 86.6±85.9 | 85.2±90.9 | 93.7±53.4 | 0.568 |
| HDL-C | 72.7±18.7 | 72.2±18.8 | 75.3±18.0 | 0.340 |
| LDL-C | 98.5±27.8 | 97.7±27.1 | 103.0±31.0 | 0.280 |
| Parameters of heart rate variability test | ||||
| LF, ms2 | 132.7 (50.2–319.4) | 145.4 (53.8–331.1) | 84.7 (15.2–195.1) | 0.007 |
| HF, ms2 | 116.0 (44.7–295.6) | 120.9 (50.5–329.5) | 50.8 (11.8–235.3) | 0.003 |
| SDNN, ms | 29.1 (18.5–43.8) | 29.8 (19.8–44.7) | 19.2 (11.2–37.7) | 0.001 |
| RMSSD, ms | 20.1 (13.0–33.8) | 20.9 (14.3–34.3) | 12.1 (6.1–30.8) | 0.001 |
| Type of insulin regimen | ||||
| Intensive treatmentc | 244 (98.8) | 204 (98.6) | 40 (100.0) | 0.999 |
| Othersd | 3 (1.2) | 3 (1.4) | 0 | 0.999 |
| Use of anti-hypertensive drugs | ||||
| ACEI or ARB | 21 (8.5) | 14 (6.8) | 7 (17.5) | 0.055 |
| Calcium channel blocker | 13 (5.3) | 10 (4.8) | 3 (7.5) | 0.448 |
| β-Blocker | 0 | 0 | 0 | - |
| Diuretics | 0 | 0 | 0 | - |
| Use of lipid lowering drug | 110 (44.5) | 96 (46.4) | 14 (35.0) | 0.185 |
| Use of anti-platelet drug | 16 (6.5) | 16 (7.7) | 0 | 0.082 |
Values are presented as mean±standard deviation, number (%), or median (interquartile range).
CAN, cardiovascular autonomic neuropathy; BP, blood pressure; HbA1c, glycosylated hemoglobin; eGFR, estimated glomerular filtration rate; NAG, N-acetyl-D-glucosaminidase; HDL-C, high density lipid cholesterol; LDL-C, low density lipid cholesterol; LF, low frequency; HF, high frequency; SDNN, standard deviation of all NN intervals; RMSSD, root mean square of successive RR interval differences; ACEI, angiotensin-converting enzyme inhibitor; ARB, angiotensin II receptor blocker.
Associations between uNAG and presence of CAN
Table 2.
| Variable | Univariate OR (95% CI) | P value | Adjusted OR (95% CI)a | P value | Adjusted OR (95% CI)b | P value |
|---|---|---|---|---|---|---|
| Age | 0.95 (0.91–0.98) | 0.002 | 0.96 (0.91–1.01) | 0.092 | 0.95 (0.91–1.00) | 0.051 |
| Male sex | 0.87 (0.44–1.73) | 0.684 | ||||
| Duration of diabetes | 1.02 (0.98–1.07) | 0.366 | ||||
| Body mass index | 0.96 (0.87–1.07) | 0.495 | ||||
| Current smoking status | 0.90 (0.25–3.26) | 0.868 | ||||
| Systolic BP | 0.99 (0.97–1.01) | 0.387 | ||||
| Diastolic BP | 1.01 (0.97–1.04) | 0.738 | ||||
| HbA1c, log unit | 7.18 (1.17–44.05) | 0.033 | 2.16 (0.28–16.62) | 0.460 | 1.69 (0.21–13.95) | 0.626 |
| eGFR | 1.05 (1.02–1.09) | 0.001 | 1.03 (0.99–1.07) | 0.202 | 1.03 (0.99–1.08) | 0.128 |
| Use of ACEI/ARB | 2.92 (1.10–7.79) | 0.032 | 5.88 (1.86–18.61) | 0.003 | ||
| uNAG, log unit | 1.72 (0.92–3.22) | 0.088 | 2.28 (1.06–4.92) | 0.035 | 2.39 (1.08–5.28) | 0.031 |
0uNAG, urinary N-acetyl-β-D-glucosaminidase; CAN, cardiovascular autonomic neuropathy; OR, odds ratio; CI, confidence interval; BP, blood pressure; HbA1c, glycosylated hemoglobin; eGFR, estimated glomerular filtration rate; ACEI, angiotensin converting enzyme inhibitor; ARB, angiotensin II receptor blocker.
Association between uNAG and total CAN score
Table 3.
| Variable | Univariate β±SE | P value | Adjusted β±SEa | P value | Adjusted β±SEb | P value |
|---|---|---|---|---|---|---|
| Age | –0.014±0.005 | 0.003 | –0.018±0.007 | 0.012 | –0.024±0.007 | 0.001 |
| Male sex | –0.073±0.119 | 0.539 | ||||
| Duration of diabetes | 0.019±0.008 | 0.018 | 0.021±0.008 | 0.011 | ||
| Body mass index | –0.011±0.017 | 0.501 | ||||
| Current smoker | –0.148±0.224 | 0.510 | ||||
| Systolic BP | –0.006±0.004 | 0.114 | ||||
| Diastolic BP | 0.000±0.006 | 0.961 | ||||
| HbA1c, log unit | 0.700±0.337 | 0.039 | 0.338±0.363 | 0.352 | 0.341±0.351 | 0.333 |
| eGFR | 0.010±0.004 | 0.015 | 0.000±0.006 | 0.968 | 0.001±0.005 | 0.823 |
| Use of ACEI/ ARB | 0.709±0.207 | 0.001 | 0.652±0.213 | 0.002 | ||
| uNAG, log unit | 0.195±0.106 | 0.068 | 0.278±0.121 | 0.023 | 0.261±0.116 | 0.026 |
Association between uNAG and HRV parameters
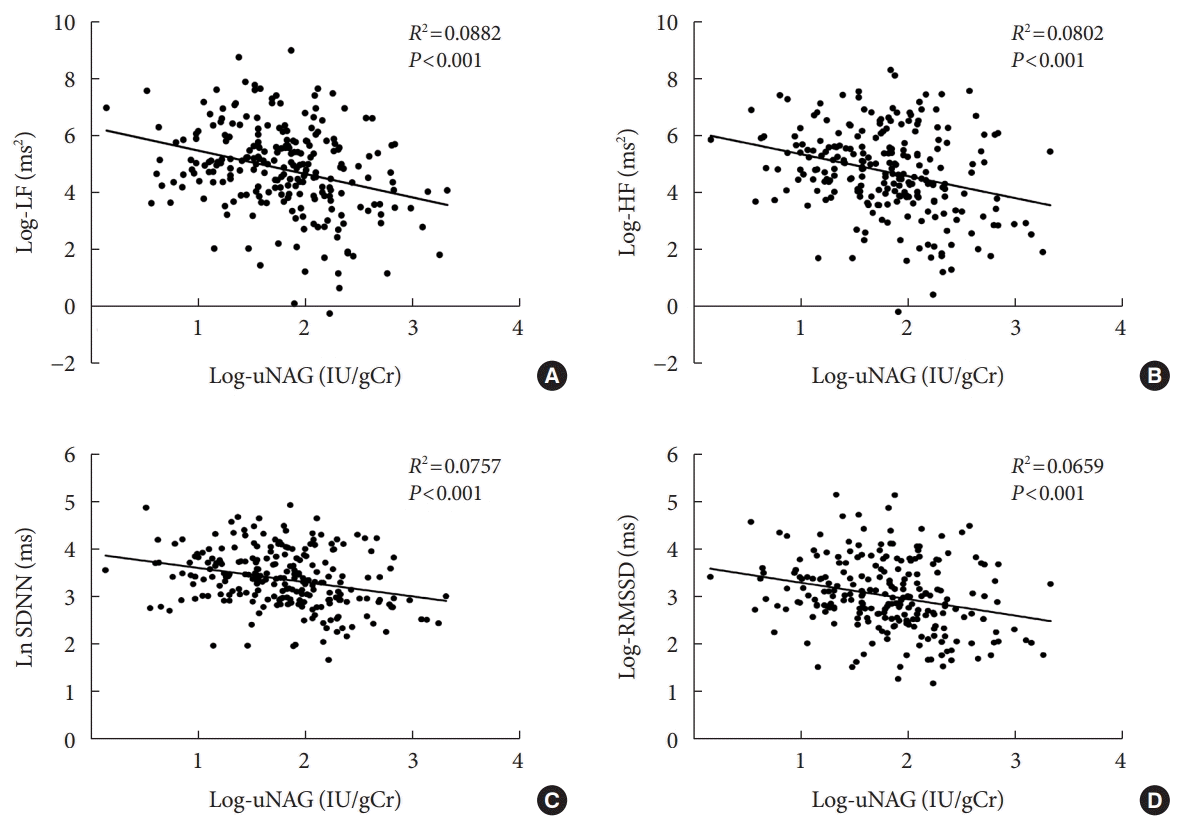
 | Fig. 2.Scatter plots of Pearson’s correlation coefficients between parameters of heart rate variability and urinary N-acetyl-β-Dglucosaminidase (uNAG) in subjects with type 1 diabetes mellitus without albuminuria. (A) Correlation between log-low frequency (LF) and log-uNAG (Pearson’s correlation R2=0.0882, P<0.001). (B) Correlation between log-high frequency (HF) and log-uNAG (Pearson’s correlation R2=0.0802, P<0.001). (C) Correlation between log-standard deviation of all NN intervals (SDNN) and log-uNAG (Pearson’s correlation R2=0.0757, P<0.001). (D) Correlation between log-root mean square of successive RR interval differences (RMSSD) and log-uNAG (Pearson’s correlation R2=0.0659, P<0.001). |


 PDF
PDF Citation
 Print
Print


 XML Download