Abstract
Objectives
Drug-induced QT prolongation can lead to life-threatening arrhythmia. In the intensive care unit (ICU), various drugs are administered concurrently, which can increase the risk of QT prolongation. However, no well-validated method to evaluate the risk of QT prolongation in real-world clinical practice has been established. We developed a risk scoring model to continuously evaluate the quantitative risk of QT prolongation in real-world clinical practice in the ICU.
Methods
Continuous electrocardiogram (ECG) signals measured by patient monitoring devices and Electronic Medical Records data were collected for ICU patients. QT and RR intervals were measured from raw ECG data, and a corrected QT interval (QTc) was calculated by Bazett’s formula. A case-crossover study design was adopted. A case was defined as an occurrence of QT prolongation ≥12 hours after any previous QT prolongation. The patients served as their own controls. Conditional logistic regression was conducted to analyze prescription, surgical history, and laboratory test data. Based on the regression analysis, a QTc prolongation risk scoring model was established.
Results
In total, 811 ICU patients who experienced QT prolongation were included in this study. Prescription information for 13 drugs was included in the risk scoring model. In the validation dataset, the high-risk group showed a higher rate of QT prolongation than the low-and low moderate-risk groups.
QT prolongation is a common adverse event that can lead to various other adverse events. Approximately 24% of acutely ill patients experience QT prolongation and torsade de pointes, which is a complication of QT prolongation that is reportedly responsible for 6% of in-hospital cardiac arrests [1]. QT prolongation can increase the length of hospital stay and approximately triple mortality rate [1].
Patients admitted to the intensive care unit (ICU) are more likely to experience QT prolongation because they have more severe conditions, such as hypokalemia, hypomagnesemia, recent conversion from atrial fibrillation to sinus rhythm, or acute cerebral illness [2,3]. Moreover, these patients tend to take multiple drugs, including ones capable of prolonging the QT interval [4,5] such as haloperidol, amiodarone, and furosemide. The risk of QT prolongation due to drug–drug interactions is also higher in these patients [2,5,6]. The prevalence of QT prolongation has been reported as 28% to 30% among ICU patients [4,5]. In one study, severe QT prolongation (>500 ms) was observed in 18.2% of ICU patients, approximately half of whom were exposed to QT-prolonging drugs despite severe QT prolongation [6]. In other studies, it was estimated that approximately half of all ICU patients may develop QT prolongation [7,8]. QT prolongation is particularly common postoperatively (67% to 80%) [9,10].
Although various scoring systems and risk evaluation models have been used for general in-hospital patients, there are no reliable models for evaluating QT prolongation risk in ICU patients. The RISQ-PATH score model was developed to identify patients who have a high risk of QT prolongation based on data from patients receiving haloperidol or an antimicrobial, and it has both high sensitivity and a high negative predictive value [11]. Other risk models to predict corrected QT interval (QTc) prolongation exhibit sensitivity, specificity, and area under the receiver operating characteristic curve (AUC) values of 0.77–0.84, 0.28–0.48, and 0.59–0.71, respectively [12,13]. However, all these models were based on general in-hospital patients. The risk score introduced by Tisdale et al. [6] was developed for a cardiac critical care unit, but it exhibited low specificity when applied to the general ICU [14].
To overcome the current limitations of applying QT prolongation risk evaluation models in an ICU setting, we developed the “ICU-QT scoring system” based on time-series electrocardiogram (ECG) data collected from patient monitors installed in several ICUs. This system provides information on QT prolongation risk by analyzing real-time time-series data, which could be useful for clinical monitoring and may inform drug administration decisions.
This study was approved by the Institutional Review Board of Ajou University Hospital (No. AJIRB-MED-MDB-19- 406). The requirement for informed consent was waived.
This study used data from the biosignal database and Electronic Medical Records of Ajou University Hospital, a tertiary teaching hospital in South Korea. The biosignal database contains ECG, arterial blood pressure, and photoplethysmogram data from patients admitted to the trauma ICU, medical ICU, emergency ICU, and neurological ICU [15]. The ECG waveforms used in this study were collected between September 2016 and May 2018. The ECG data obtained by Nihon Kohden and Philips patient monitors had sampling rates of 250 and 500 Hz, respectively. Clinical information (demographics, prescription and diagnostic records, laboratory test results, and surgical histories) were obtained from patients’ Electronic Medical Records during the same period.
Because the waveform data in the biosignal database only contain raw waveform signals, the onset of the QRS complex, R peak, and offset of the T-wave were detected using the QT detector developed by Chesnokov et al. [16] for the first 10-second segment of ECG data every hour. A QT interval was defined as the time between the onset of the QRS complex and the offset of the T-wave. An RR interval was defined as the time between successive R peaks. The median QT and RR intervals for 10-second segments were included in the analysis. QT intervals ≥800 ms were considered as outliers and excluded from the analysis. Based on the measured QT and RR intervals, QTc intervals were calculated (corrected for heart rate) using Bazett’s formula:
QT prolongation was defined as QTc (calculated using Bazett’s formula) >450 ms for men and >470 ms for women.
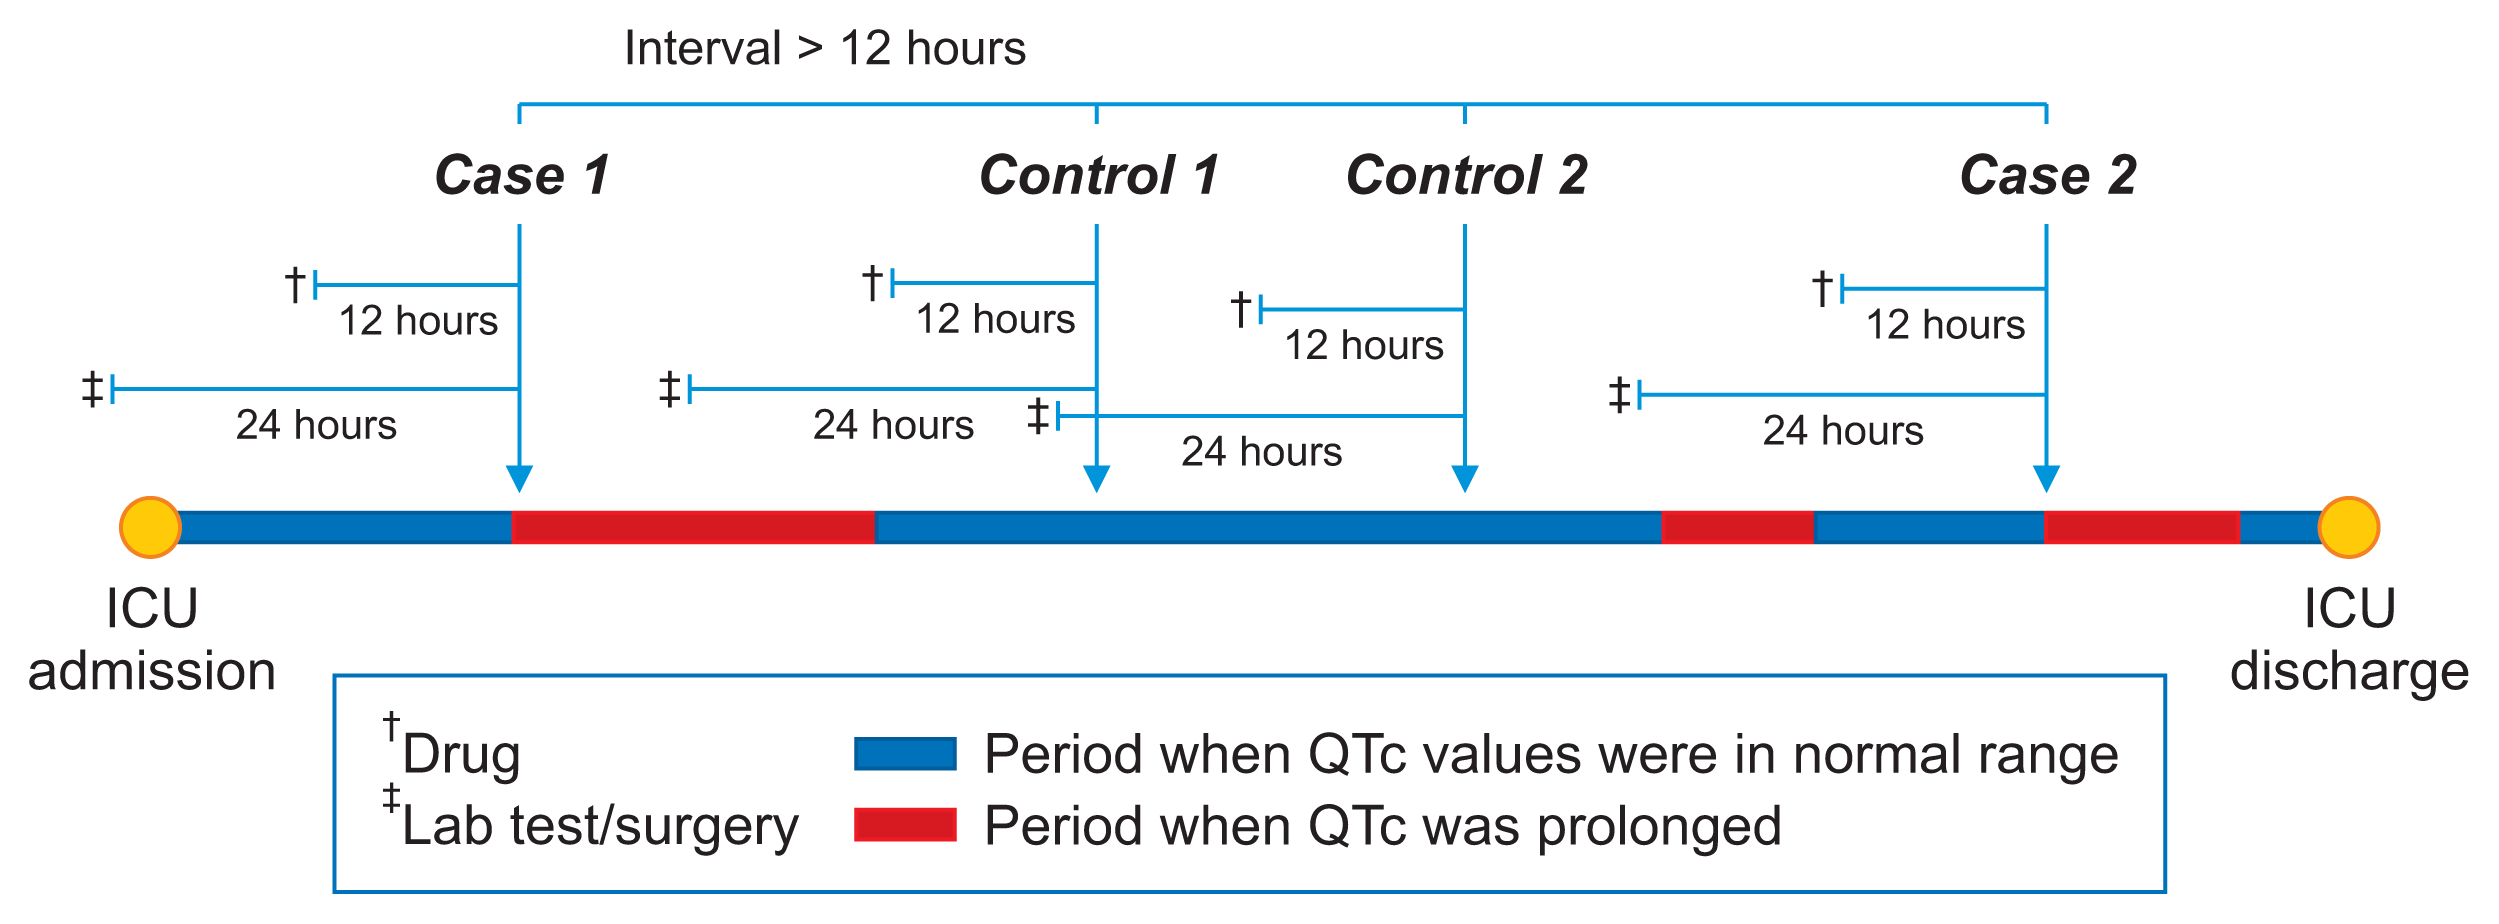
To develop the QT prolongation risk evaluation model, a case-crossover study design was used to minimize the effects of confounding variables, i.e., by using the patients as their own control group. Moreover, a longitudinal design was used so that the characteristics of the ECG data could be evaluated over time (Figure 1). A case was defined as an occurrence of QT prolongation ≥12 hours after any previous QT prolongation. Controls referred to an absence of QT prolongation for ≥12 hours. Cases and controls that overlapped within a 12-hour time window were excluded. Up to 16 cases and 16 controls were selected for each patient (derivation dataset). Levels of exposure to risk factors were compared between the periods before cases and controls (Figure 1).
Prescribed drugs, laboratory test results, and surgical histories were the potential risk factors for QT prolongation in the ICU patients in this study. The 300 drugs and 100 surgeries most frequently prescribed and performed, respectively, in these patients were analyzed. The observation windows for drugs and surgeries were set at 12 and 24 hours before each case and control, respectively. The serum potassium and calcium levels measured at the time closest to a drug case or control within ≤24 hours before cases and controls were included in the analysis. Conditional logistic regression was performed to determine the risk posed by each factor, and p-values <0.05 were considered statistically significant. The case-crossover study design removes the bias associated with inter-individual differences. However, this approach does not evaluate the impact of patient characteristics.
To derive the ICU-QT score, beta coefficient weights were used; these were multiplied by 10 and rounded to the nearest integer. The ICU-QT score was defined as
where w represents the weight value, and x represents the value of each variable. This approach yielded a superior net reclassification index compared with various other approaches [17].
Performance evaluation was conducted in three steps. First, we checked for consistency with previous studies in terms of the factors showing significant associations with QT prolongation. Second, the incidence of QT prolongation was analyzed by ICU-QT score in both the derivation and validation datasets. The validation dataset consisted of data for different time points from the same patients used for model development. Finally, low-, low moderate-, high moderate- and high-risk QT prolongation groups were distinguished based on the chi-squared test and pairwise Fisher exact test with Bonferroni correction.
In total, 811 ICU patients were included in this study (560 men); 507 patients were admitted to the trauma ICU (Table 1). The mean number of QT prolongations per patient during the ICU stay was 4.39.
Drugs significantly associated with QT prolongation in this study are shown in Table 2. Changes in laboratory test results (i.e., serum potassium and calcium levels) and surgical history were not significantly associated with QT prolongation, whereas 13 drugs did show a significant association. There was previous evidence of five of those drugs being associated with QT prolongation.
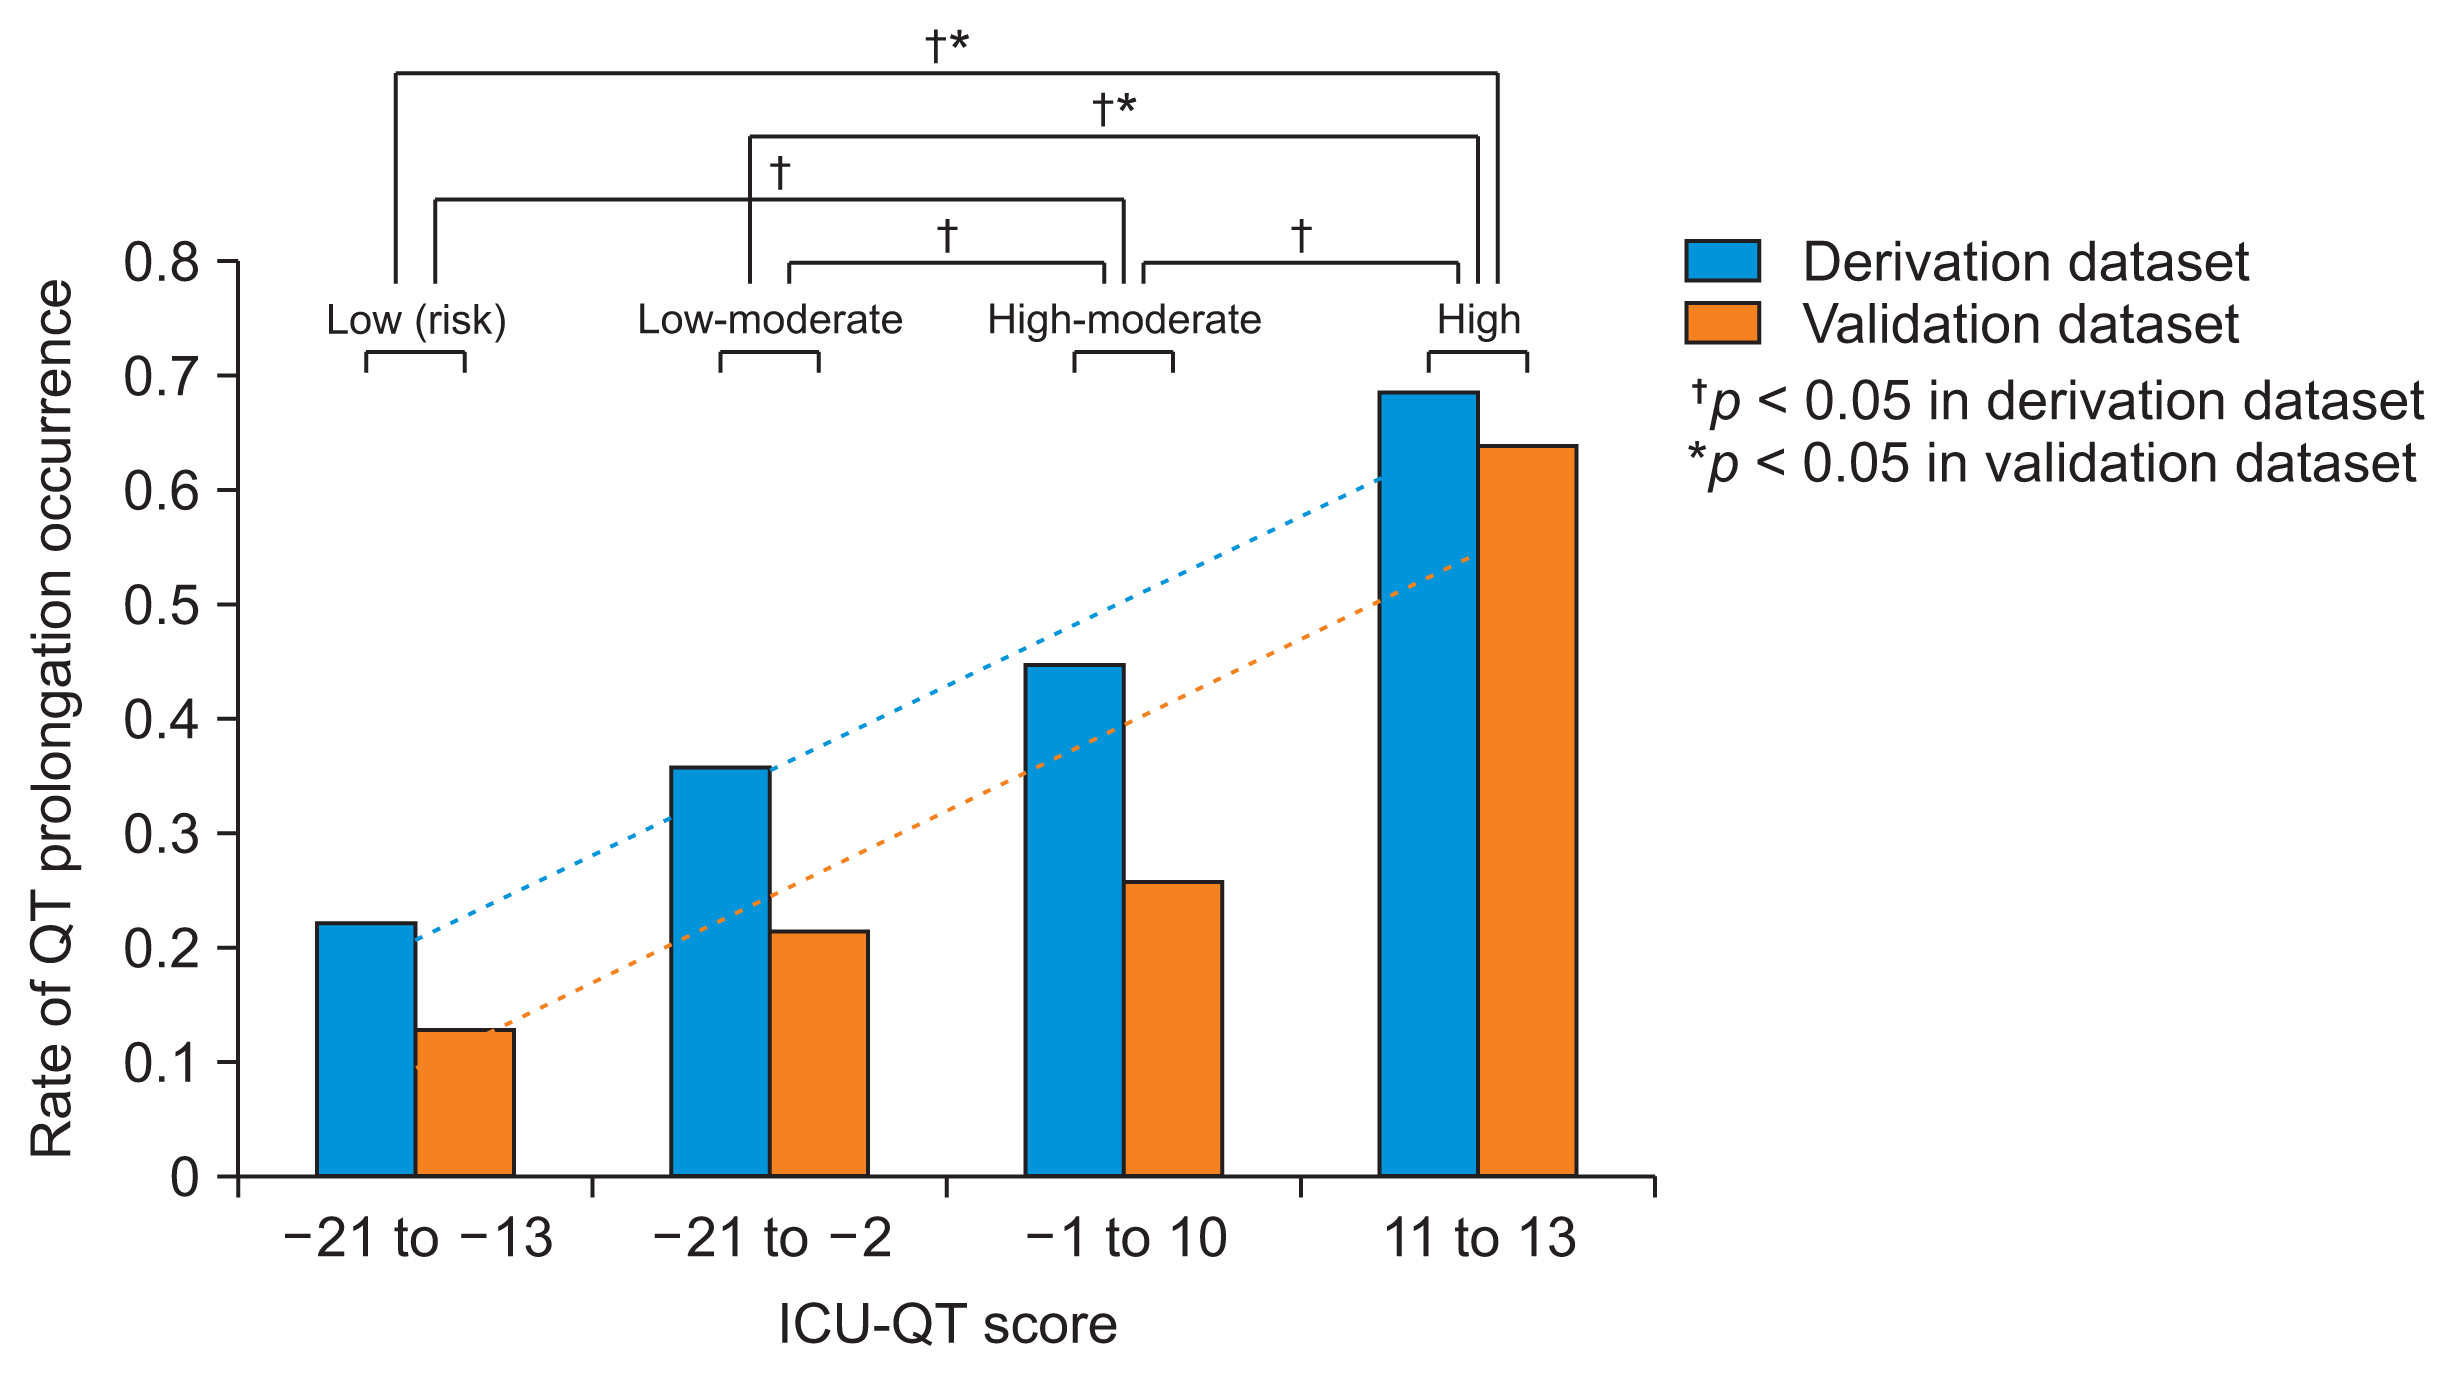
With increasing ICU-QT score, the rate of QT prolongation increased, as shown in Figure 2, in both the derivation and validation datasets. The rate of QT prolongation increased by approximately 7% for each 5-point increase in ICU-QT score (6.6% in the derivation dataset and 7.3% in the validation dataset).
Rates of QT prolongation differed significantly among the low-, low moderate-, high moderate- and high-risk groups in the derivation (p < 0.001) and validation datasets (p = 0.007). In the post hoc analysis, there were significant differences between the low- and high-risk groups in both the derivation (p < 0.001) and validation datasets (p = 0.02) and between the low moderate- and high-risk groups in both the derivation (p < 0.001) and validation datasets (p = 0.02). In addition, in the derivation dataset, there were significant differences between the low- and high moderate-risk groups (p = 0.003), between the low moderate- and high moderate-risk groups (p < 0.001), and between the high moderate- and high-risk groups (p = 0.015). In the validation dataset, the high moderate- and high-risk groups showed a marginally significant difference (p = 0.0501). The QT prolongation counts in the validation dataset for the three risk groups are shown in Table 3.
We developed the ICU-QT score to provide information regarding the risk of QT prolongation in ICU patients. In both the derivation and validation datasets, the ICU-QT score was strongly correlated with the risk of QT prolongation in real-world ICU settings.
Although the risk of QT prolongation is greater in ICU patients, most previous models evaluating the risk of QT prolongation were developed using data from non-ICU patients. ICU patients usually have more severe clinical conditions and a higher likelihood of exposure to multiple drugs or injections. Notably, disease severity differs between patients in the ICU and general wards, while taking multiple drugs can increase the risk of drug-drug interactions, potentially resulting in QT prolongation [2,5,6].
Using ECG data collected from ICU patients [18], we developed a QT prolongation risk evaluation model. A longitudinal case-crossover study design was used to remove the bias associated with inter-individual differences.
Five of the 13 drugs (nicardipine, dexmedetomidine, levetiracetam, rocuronium, and norepinephrine) showing significant associations with QT prolongation in this study were also significantly associated with QT prolongation in previous studies. The other five drugs (lorazepam, aspirin, lafutidine, vecuronium, and propacetamol) were newly identified to have significant adverse associations with QT prolongation in ICU patients. Because most studies have focused on drugs that can lead to QT prolongation, there are insufficient data regarding drugs that have no relationship or a negative relationship (i.e., a protective effect). In this study, isoconazole nitrate, imipenem/cilastatin, budesonide, and dexmedetomidine were found to have protective effects.
Our scoring model is intended to quantify the overall risk of QT prolongation rather than to obtain the odds ratios for individual risk factors. Therefore, caution is needed when interpreting the results. The variables included in this study were used as surrogate markers of clinical status, and were weighted according to the risk of QT prolongation in real-world clinical practice. For example, the drug vecuronium is typically used in patients receiving mechanical ventilator care, and it prevents resistance against the ventilator by relaxing the skeletal muscles. In this case, the weight of vecuronium can be interpreted as the QT prolongation risk posed by severe clinical conditions that require ventilator care or the risk associated with ventilator use itself.
This study had the following limitations. First, data were collected from a single institute and primarily from the trauma ICU (62.5% of cases and controls) because our “biosignal collecting system” was initially installed in the trauma ICU before later being implemented in other ICUs. In a future study, we will use a more balanced ICU dataset, by collecting additional data from other ICUs, and we will perform model validation using an external dataset. Second, as previously mentioned, our results do not allow causality to be inferred regarding the relationships between risk factors and QT prolongation. To develop a more precise model, detailed clinical information (e.g., on medical device usage, procedures conducted during ICU stays, and vital signs) would be helpful. However, such information might be stored in different data formats across hospitals, so the added complexity could hinder adoption of the model in clinical practice. Therefore, we only used prescription information, which is usually stored in a simple format and can well represent a variety of clinical situations. Third, the variety of half-lives of drugs was not considered. Some drugs, benzodiazepine like lorazepam could have an effect for more than 12 hours, which was set as the observation time window in this study. However, to increase the usability of the users and with the assumption that drugs administered near an event could have more significant effects, we simplified the observation time window as 12 hours.
Some studies have reported that a clinical decision support system has proven effective to reduce adverse events caused by QT prolongation [19,20]. Therefore, we expect that models like ours can help to reduce the clinical deterioration of patients in ICU caused by QT prolongation. To realize this aim, research to improve QT prolongation event detection must be continued.
In conclusion, we developed the ICU-QT scoring system that can support clinicians in assessing the risk of QT prolongation in real time. It can facilitate QT control and reduce the use of QT-prolonging drugs in patients at high risk of QT prolongation.
Acknowledgments
This research was supported by a grant (No. 19182MFDS406) from Ministry of Food and Drug Safety in 2020. This research was also supported by a Government-wide R&D Fund project for infectious disease research (GFID), Republic of Korea (No. HG18C0067).
References
1. Pickham D, Helfenbein E, Shinn JA, Chan G, Funk M, Weinacker A, et al. High prevalence of corrected QT interval prolongation in acutely ill patients is associated with mortality: results of the QT in Practice (QTIP) Study. Crit Care Med. 2012; 40:394–9.
2. Etchegoyen CV, Keller GA, Mrad S, Cheng S, Di Girolamo G. Drug-induced QT interval prolongation in the intensive care unit. Curr Clin Pharmacol. 2017; 12:210–22.
3. Beitland S, Platou ES, Sunde K. Drug-induced long QT syndrome and fatal arrhythmias in the intensive care unit. Acta Anaesthesiol Scand. 2014; 58:266–72.
4. George TK, Chase D, Peter JV, Satyendra S, Kavitha R, George LR, et al. Association between a prolonged corrected QT interval and outcomes in patients in a medical Intensive Care Unit. Indian J Crit Care Med. 2015; 19:326–32.
5. Fernandes FM, Silva EP, Martins RR, Oliveira AG. QTc interval prolongation in critically ill patients: prevalence, risk factors and associated medications. PLoS One. 2018; 13:e0199028.
6. Tisdale JE, Wroblewski HA, Overholser BR, Kingery JR, Trujillo TN, Kovacs RJ. Prevalence of QT interval prolongation in patients admitted to cardiac care units and frequency of subsequent administration of QT interval-prolonging drugs: a prospective, observational study in a large urban academic medical center in the US. Drug Saf. 2012; 35:459–70.
7. Kozik TM, Wung SF. Acquired long QT syndrome: frequency, onset, and risk factors in intensive care patients. Crit Care Nurse. 2012; 32:32–41.
8. Hoogstraaten E, Rijkenberg S, van der Voort PH. Corrected QT-interval prolongation and variability in intensive care patients. J Crit Care. 2014; 29:835–9.
9. Nagele P, Pal S, Brown F, Blood J, Miller JP, Johnston J. Postoperative QT interval prolongation in patients undergoing noncardiac surgery under general anesthesia. Anesthesiology. 2012; 117:321–8.
10. Pham JC, Banks MC, Narotsky DL, Dorman T, Winters BD. The prevalence of long QT interval in post-operative intensive care unit patients. J Clin Monit Comput. 2016; 30:437–43.
11. Vandael E, Vandenberk B, Vandenberghe J, Spriet I, Willems R, Foulon V. Development of a risk score for QTc-prolongation: the RISQ-PATH study. Int J Clin Pharm. 2017; 39:424–32.
12. Bindraban AN, Rolvink J, Berger FA, van den Bemt PM, Kuijper AF, van der Hoeven RT, et al. Development of a risk model for predicting QTc interval prolongation in patients using QTc-prolonging drugs. Int J Clin Pharm. 2018; 40:1372–9.
13. Berger FA, van der Sijs H, Becker ML, van Gelder T, van den Bemt PM. Development and validation of a tool to assess the risk of QT drug-drug interactions in clinical practice. BMC Med Inform Decis Mak. 2020; 20:171.
14. Su K, McGloin R, Gellatly RM. Predictive validity of a QTc interval prolongation risk score in the intensive care unit. Pharmacotherapy. 2020; 40:492–9.
15. Chung D, Choi J, Jang JH, Kim TY, Byun J, Park H, et al. Construction of an electrocardiogram database including 12 lead waveforms. Healthc Inform Res. 2018; 24:242–6.
16. Chesnokov YC, Nerukh D, Glen RC. Individually adaptable automatic QT detector. In : Proceedings of 2006 Computers in Cardiology; 2016 Sep 17–20; Valencia, Spain. p. 337–40.
17. Mehta HB, Mehta V, Girman CJ, Adhikari D, Johnson ML. Regression coefficient-based scoring system should be used to assign weights to the risk index. J Clin Epidemiol. 2016; 79:22–8.
18. Yoon D, Lee S, Kim TY, Ko J, Chung WY, Park RW. System for collecting biosignal data from multiple patient monitoring systems. Healthc Inform Res. 2017; 23:333–7.
19. Sharma S, Martijn Bos J, Tarrell RF, Simon GJ, Morlan BW, Ackerman MJ, et al. Providers’ response to clinical decision support for QT prolonging drugs. J Med Syst. 2017; 41:161.
20. Tisdale JE, Jaynes HA, Kingery JR, Overholser BR, Mourad NA, Trujillo TN, et al. Effectiveness of a clinical decision support system for reducing the risk of QT interval prolongation in hospitalized patients. Circ Cardiovasc Qual Outcomes. 2014; 7:381–90.
21. Woosley RL, Heise CW, Gallo T, Tate J, Woosley D, Romero KA. QTdrugs list [Internet]. Oro Valley (AZ): AZCERT Inc;c2013. [cited 2021 Mar 30]. Available from: https://www.crediblemeds.org/
.
22. Kim NY, Han DW, Koh JC, Rha KH, Hong JH, Park JM, et al. Effect of dexmedetomidine on heart rate-corrected QT and Tpeak-Tend intervals during robot-assisted laparoscopic prostatectomy with steep Trendelenburg position: a prospective, randomized, double-blinded, controlled study. Medicine (Baltimore). 2016; 95:e3645.
Table 1
Table 2
Drug | β | p-value | Known risk factor | Accordance with previous data | Weight |
---|---|---|---|---|---|
Isoconazole nitrate | −1.454 | 0.003 | No evidence | △ | −15 |
Lorazepam | 0.402 | 0.033 | No evidence | △ | 4 |
Aspirin | 0.474 | 0.040 | No evidence | △ | 5 |
Imipenem/cilastatin | −0.642 | 0.019 | No evidence | △ | −6 |
Budesonide | −0.674 | 0.012 | No evidence | △ | −7 |
Nicardipine | 0.593 | <0.001 | Increasea) | O | 6 |
Dexmedetomidine | −0.488 | <0.001 | Increasea)/decreaseb) | O | −5 |
Lafutidine | 0.573 | 0.020 | No evidence | △ | 6 |
Levetiracetam | 0.376 | 0.017 | Increasea) | O | 4 |
Rocuronium | 0.746 | 0.012 | Increasec) | O | 7 |
Norepinephrine | 0.382 | 0.014 | Increasea) | O | 4 |
Vecuronium | 0.415 | 0.030 | No evidence | △ | 4 |
Propacetamol | 0.290 | 0.012 | No evidence | △ | 3 |