Journal List > Korean Circ J > v.51(10) > 1147726

Bae, Cho, Lee, Bae, Park, Jung, Shin, Cho, Hwang, Han, Park, Jang, and Lee: Electrocardiographic Manifestations in Patients with COVID-19: Daegu in South Korea

Author's summary

As COVID-19 spreads worldwide, cardiac injury in patients infected with COVID-19 becomes a significant concern. Thus, this study investigates the impact of several electrocardiogram parameters and disease severity in COVID-19 patients. The deceased patients showed increased dispersion of QTc and Tpe-c compared with surviving patients (78.2±41.1 vs. 40.8±24.6 ms and 60.2±37.3 vs 40.8±24.5 ms, both p<0.05). The QTc dispersion of more than 56.1 ms could predict the mortality in multivariate analysis (Odd ratio 8.06, 95% Confidence Interval 2.843–25.750). A prolonged QTc dispersion could be an independent predictable factor of mortality.

Abstract

Background and Objectives

As the coronavirus disease 2019 (COVID-19) spreads worldwide, cardiac injury in patients infected with COVID-19 becomes a significant concern. Thus, this study investigates the impact of several electrocardiogram (ECG) parameters and disease severity in COVID-19 patients.

Methods

Seven medical centers in Daegu admitted 822 patients with COVID-19 between February and April 2020. This study examined 267 patients among them who underwent an ECG test and evaluated their biochemical parameters like C-reactive protein (CRP), log N-terminal pro-B-type Natriuretic Peptide (NT-proBNP), cardiac enzyme, and ECG parameters (heart rate, PR interval, QRS interval, T inversion, QT interval, and Tpe [the interval between peak to end in a T wave]).

Results

Those patients were divided into 3 groups of mild (100 patients), moderate (89 patients), and severe (78 patients) according to clinical severity score. The level of CRP, log NT-proBNP, and creatinine kinase-myocardial band were significantly increased in severe patients. Meanwhile, severe patients exhibited prolonged QT intervals (QTc) and Tpe (Tpe-c) compared to mild or moderate patients. Moreover, deceased patients (58; 21.7%) showed increased dispersion of QTc and Tpe-c compared with surviving patients (78.2±41.1 vs. 40.8±24.6 ms and 60.2±37.3 vs. 40.8±24.5 ms, both p<0.05, respectively). The QTc dispersion of more than 56.1 ms could predict the mortality in multivariate analysis (odd ratio, 11.55; 95% confidence interval, 3.746–42.306).

Conclusions

COVID-19 infections could involve cardiac injuries, especially cardiac repolarization abnormalities. A prolonged QTc dispersion could be an independent predictable factor of mortality.

INTRODUCTION

The coronavirus disease 2019 (COVID-19) is caused by the severe acute respiratory syndrome coronavirus 2 (SARS-CoV-2) and is characterized by a broad clinical spectrum ranging from asymptomatic to severe viral pneumonia with respiratory failure and even death.1) COVID-19 has become a global crisis as it spread worldwide, taking millions of lives and causing disastrous socio-economic impact. A COVID-19 infection causes right and left ventricular dilation, myocardial fibrosis, and myocarditis, necessitating immediate treatment.2) However, treatments for COVID-19 infection can produce adverse cardiovascular effects, including a prolonged QT interval and the development of arrhythmias.3)
COVID-19 mortality is often related to respiratory failure caused by severe acute pneumonia, systemic inflammatory response syndromes like cytokine storms, and myocardial injuries such as acute fulminant myocarditis with arrhythmias.4) In this regard, cardiac injuries associated with COVID-19 infection are emerging as a significant issue. Some authors reported that COVID-19 infection caused repolarization abnormalities and prolonged QT intervals.2)5)6)7) Furthermore, prolonged QT interval was associated with higher mortality.6)
To address these issues, this study aims to determine the characteristic electrocardiogram (ECG) findings according to clinical severity in patients with COVID-19 infection. Moreover, this study evaluated the ECG parameters associated with mortality.

METHODS

Ethical statement

The study was conducted according to the ethical guidelines of the Declaration of Helsinki revised in 2013. This study was approved by the Daegu Joint Institutional Review Board (DGIRB 2020-07-007-002). Written informed consent was waived because of the retrospective nature of this study.

Study design

Between February and April of 2020, 7 medical centers in Daegu, South Korea, admitted 822 patients confirmed to have COVID-19 via real-time reverse transcriptase-polymerase chain reaction assay testing of nasal or pharyngeal swabs. Among them, 267 patients who underwent an ECG test after admission were examined, and patients who were below 18 years old, used psychotropic agents, and exhibited a history of mental disorders were excluded (Supplementary Figure 1).
The study collected medical records based on a review of patients' charts retrospectively. Three cardiologists reviewed the clinical severity score of COVID infection through an electronic medical recorder and laboratory data like log N-terminal pro-B type natriuretic peptide (NT-proBNP), C-reactive protein (CRP), cardiac enzyme (creatinine kinase-myocardial band [CK-MB], cardiac troponin I or T), and ECG data such as heart rate, PR interval, QRS duration, QT interval, and Tpe (the interval between peak to end in a T wave).

Clinical severity score

This study used the following scoring system created by the Korean Disease Control and Prevention Agency to determine the severity of a patient's COVID-19 infection. A score of 1 denotes no limit to daily activity; 2 for interfering with daily life, although oxygen treatment was not required; 3 for needing oxygen treatment with nasal prong; 4 for needing oxygen treatment with a facial mask; 5 for needing oxygen treatment with non-invasive ventilation; 6 for needing oxygen treatment with invasive ventilation; 7 for needing oxygen treatment with extracorporeal membrane oxygenation or showing signs of multi-organ failure; and 8 for reported mortality. The patients were divided into three groups using this scoring system, or the clinical severity score: mild group (1–2), moderate group (3–5), and severe group (6–8).

ECG measurement

The ECG was performed in the emergency room or at the time of hospitalization. All ECG parameters (heart rate, PR interval, QRS duration, QT interval, QT dispersion, the interval between peak to end in a T wave [Tpe]) were measured at 10-times magnification using electronic calipers. However, measurements were not performed in cases of excessive artifact or T wave flatness. Measurements were taken at each center and then analyzed and calculated by averaging two different doctors' measurements, respectively, to reduce the inter-observer error. If the ECG rhythm was atrial fibrillation or atrial flutter, each ECG parameter was evaluated as the average of each lead's measured values.
Each QT interval was measured to determine the values of these two extreme indices. For QT measurement, a tangent method was used to indicate the end of the T wave, which is defined as the isoelectric line's intersection with the tangent to the T wave's downslope. Moreover, this study measured the Tpe in all 12 leads. Bazzett's formula was used to generate the corrected QT interval (QTc) and corrected Tpe interval (Tpe-c) because the QT and Tpe interval could change depending on the heart rate.8) Dispersions of QT and Tpe were calculated as the difference between the longest and shortest QT intervals and Tpe intervals within a 12-lead ECG.9)

Statistical analysis

Descriptive data were presented as percentages for categorical variables and the mean ± standard deviation for continuous variables of normal distribution. The chi-squared test or Student's t-test performed to compare the two groups was deemed appropriate, and analysis of variance was performed to compare the three groups. Moreover, the area below the receiver operating characteristic (ROC) curve was measured to determine the cut-off point of the highest sensitivity and specificity. Missing value was replaced by missForest package (version 1.04). The univariate analysis' significant variables were entered into the multivariate model, and the associated factors with mortality were identified. For all analyses, the level of significance was set to 0.05, and all reported p values were two-sided. All statistical analyses were performed with R version 3.5.2 software (The R Foundation, Vienna, Austria; www.R-project.org).

RESULTS

Baseline characteristics

Baseline characteristics are demonstrated in Table 1. This study examined 267 patients (mean age 67.9 years old, with similar female to male ratio) with confirmed COVID-19 infections. Half of the patients had a history of hypertension and 24.8% of patients took angiotensin-converting enzyme inhibitors (ACEI) or angiotensin II receptor blockers (ARB). In all patients, log NT-proBNP and CRP have increased beyond normal value. As clinical severity worsened, the study found that patients on this scale were significantly older, mostly male, with lower hemoglobin and calcium levels and higher CK-MB, log NT-proBNP, and CRP levels. The high clinical severity score of COVID-19 was significantly associated with cardiovascular comorbidities like diabetes and ischemic heart disease but was not associated with hypertension, stroke, and congestive heart failure. Moreover, the proportion of ACEI or ARB in each group was similar.
Table 1

Baseline demographics according to clinical severity score

kcj-51-851-i001
Clinical severity score Total (n=267) Mild (n=100) Moderate (n=89) Severe (n=78) p value
Age (years) 67.9±15.5 62.8±17.0 69.2±15.9 73.2±10.5 <0.001
Male, No. (%) 131 (49.1) 41 (41.0) 40 (44.9) 50 (64.1) 0.006
BMI (kg/m2) 25.5±2.1 28.5±3.3 23.9±3.6 23.3±3.4 0.137
Systolic BP (mmHg) 131.7±22.2 133.4±22.1 131.1±19.9 130.4±25.0 0.368
Diastolic BP (mmHg) 78.1±12.9 81.0±13.3 76.7±10.6 75.8±14.0 0.005
Respiration rate (breaths per minute) 21.3±3.6 19.9±0.9 20.9±2.8 23.6±5.1 <0.001
Alcoholics 1 (0.5) 0 (0.0) 0 (0.0) 1 (1.7) 0.420
Smoking 16 (8.5) 4 (6.5) 3 (4.5) 9 (15.0) 0.114
Diabetes mellitus 79 (29.6) 25 (25.0) 21 (23.6) 33 (42.3) 0.014
Hypertension 140 (52.4) 45 (45.0) 52 (58.4) 43 (55.1) 0.155
Ischemic heart disease 14 (5.2) 1 (1.0) 4 (4.5) 9 (11.5) 0.007
CHF 14 (5.2) 3 (3.0) 6 (6.7) 5 (6.4) 0.443
Stroke 28 (10.5) 5 (5.0) 14 (15.7) 9 (11.5) 0.052
Anti-platelet agents 48 (18.6) 12 (12.2) 20 (22.7) 16 (22.2) 0.121
Beta blocker 31 (12.0) 10 (10.2) 11 (12.6) 10 (13.7) 0.766
CCB 72 (27.9) 27 (27.6) 31 (35.6) 14 (19.2) 0.069
ACEI or ARB 64 (24.8) 21 (21.4) 25 (28.7) 18 (24.7) 0.517
Diuretics 44 (17.1) 10 (10.2) 15 (17.2) 19 (26.0) 0.025
Statin 61 (23.7) 24 (24.2) 20 (23.3) 17 (23.6) 0.987
Hemoglobin (g/dL) 12.4±2.3 12.8±2.1 12.4±2.4 11.9±2.5 0.011
GFR (mL/min/1.73 m2) 69.1±28.3 72.4±26.1 69.4±30.7 64.4±28.0 0.065
Serum potassium (mmol/L) 4.1±0.7 4.2±0.6 4.1±0.6 4.1±0.9 0.192
Serum calcium (mg/dL) 8.6±0.6 8.9±0.6 8.6±0.6 8.4±0.6 <0.001
CK-MB max (IU/L) 2.6±3.8 1.6±2.0 2.2±1.9 4.1±5.7 <0.001
Troponin max (ng/mL) 1.7±11.7 1.2±3.1 2.9±19.6 1.0±4.7 0.938
NT-proBNP (pg/mL)* 5.8±1.8 5.3±1.5 5.4±1.8 6.7±1.7 <0.001
C-reactive protein (mg/L) 86.9±85.6 29.4±35.2 80.9±59.4 167.4±93.7 <0.001
Data are presented as mean±standard deviation or number (%).
ACEI = angiotensin converting enzyme inhibitor, ARB = angiotensin II receptor blocker, BMI = body mass index; BP = blood pressure; CCB = calcium channel blocker; CHF = congestive heart failure; CK-MB = creatine kinase myocardial band; GFR = glomerular filtration rate; Pro-BNP = pro-B type natriuretic peptide.
*Log NT-proBNP, NT-proBNP levels that have been log transformed.

ECG parameters according to the clinical severity of COVID-19

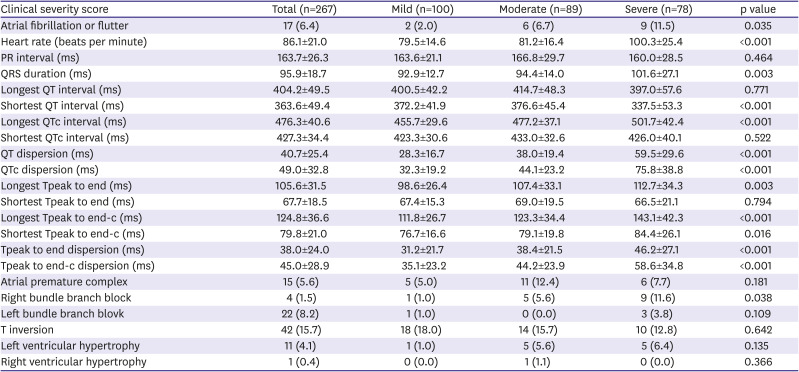
The results of ECG finding were shown in Table 2. 17 patients (6.4%) had atrial fibrillation or flutter. In overall patients, mean heart rate was relatively increased (86 bpm). Meanwhile, T inversion was reported in 42 patients (15.7%).
Table 2

Electrocardiogram findings according to clinical severity score

kcj-51-851-i002
Clinical severity score Total (n=267) Mild (n=100) Moderate (n=89) Severe (n=78) p value
Atrial fibrillation or flutter 17 (6.4) 2 (2.0) 6 (6.7) 9 (11.5) 0.035
Heart rate (beats per minute) 86.1±21.0 79.5±14.6 81.2±16.4 100.3±25.4 <0.001
PR interval (ms) 163.7±26.3 163.6±21.1 166.8±29.7 160.0±28.5 0.464
QRS duration (ms) 95.9±18.7 92.9±12.7 94.4±14.0 101.6±27.1 0.003
Longest QT interval (ms) 404.2±49.5 400.5±42.2 414.7±48.3 397.0±57.6 0.771
Shortest QT interval (ms) 363.6±49.4 372.2±41.9 376.6±45.4 337.5±53.3 <0.001
Longest QTc interval (ms) 476.3±40.6 455.7±29.6 477.2±37.1 501.7±42.4 <0.001
Shortest QTc interval (ms) 427.3±34.4 423.3±30.6 433.0±32.6 426.0±40.1 0.522
QT dispersion (ms) 40.7±25.4 28.3±16.7 38.0±19.4 59.5±29.6 <0.001
QTc dispersion (ms) 49.0±32.8 32.3±19.2 44.1±23.2 75.8±38.8 <0.001
Longest Tpeak to end (ms) 105.6±31.5 98.6±26.4 107.4±33.1 112.7±34.3 0.003
Shortest Tpeak to end (ms) 67.7±18.5 67.4±15.3 69.0±19.5 66.5±21.1 0.794
Longest Tpeak to end-c (ms) 124.8±36.6 111.8±26.7 123.3±34.4 143.1±42.3 <0.001
Shortest Tpeak to end-c (ms) 79.8±21.0 76.7±16.6 79.1±19.8 84.4±26.1 0.016
Tpeak to end dispersion (ms) 38.0±24.0 31.2±21.7 38.4±21.5 46.2±27.1 <0.001
Tpeak to end-c dispersion (ms) 45.0±28.9 35.1±23.2 44.2±23.9 58.6±34.8 <0.001
Atrial premature complex 15 (5.6) 5 (5.0) 11 (12.4) 6 (7.7) 0.181
Right bundle branch block 4 (1.5) 1 (1.0) 5 (5.6) 9 (11.6) 0.038
Left bundle branch blovk 22 (8.2) 1 (1.0) 0 (0.0) 3 (3.8) 0.109
T inversion 42 (15.7) 18 (18.0) 14 (15.7) 10 (12.8) 0.642
Left ventricular hypertrophy 11 (4.1) 1 (1.0) 5 (5.6) 5 (6.4) 0.135
Right ventricular hypertrophy 1 (0.4) 0 (0.0) 1 (1.1) 0 (0.0) 0.366
Data are presented as number (%) or mean±standard deviation.
QTc = corrected QT; Tpe = interval of the peak to end of T wave; Tpe-c = corrected interval of the peak to end of T wave.
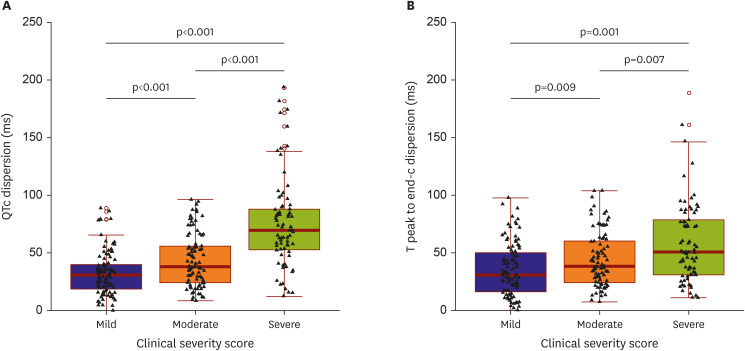
The results show that as the disease severity scale increases, the heart rate speeds up and prolongs the QRS duration and the longest QTc interval, but the shortest QTc interval did not change with the rise in scale. For this reason, the dispersion of the QT interval significantly increased as the disease worsened (Figure 1A). In addition, both the longest and shortest Tpe-c intervals significantly increased the severity of COVID-19 increased, while the dispersion of Tpe-c significantly increased along with it (Figure 1B).
Figure 1

Dispersion of corrected QT and peak to end of T wave (Tpe) according to clinical severity score. (A) Dispersion of corrected QT (B) Dispersion of corrected Tpe. Red line is mean, and box lesion is quartile.

QTc = corrected QT.
kcj-51-851-g001

Clinical characteristics of deceased patients in COVID-19

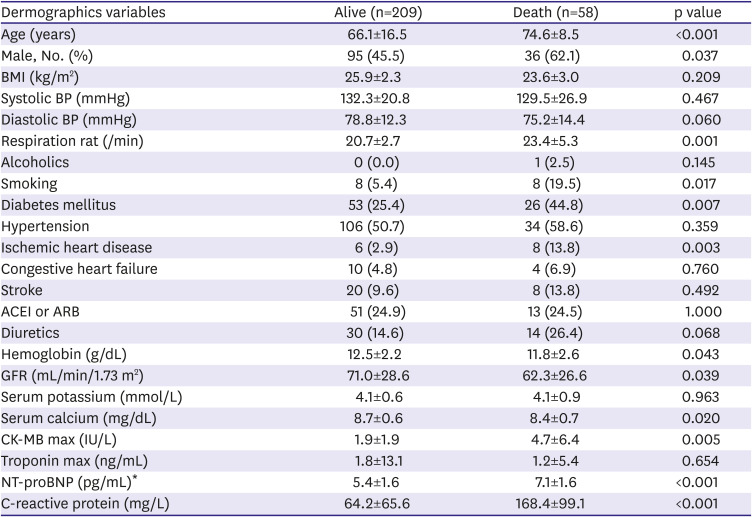
Among the 267 patients, 58 patients (21.7%) were deceased (Table 3). Compared to the surviving patients, the deceased patients were significantly older and mostly male, with faster respiration rates and a history of smoking. Moreover, according to the results of this study, the incidence of diabetes mellitus and ischemic heart disease was significantly associated with COVID-19 mortality. Their medication history, which included beta-blockers, ACEI or ARB, and statin, was similar between both groups. The hemoglobin and serum calcium levels of deceased patients were significantly lower than those of the surviving patients. Cardiac markers like CK-MB and log NT-proBNP levels were significantly increased in deceased patients.
Table 3

Baseline demographics according to mortality

kcj-51-851-i003
Dermographics variables Alive (n=209) Death (n=58) p value
Age (years) 66.1±16.5 74.6±8.5 <0.001
Male, No. (%) 95 (45.5) 36 (62.1) 0.037
BMI (kg/m2) 25.9±2.3 23.6±3.0 0.209
Systolic BP (mmHg) 132.3±20.8 129.5±26.9 0.467
Diastolic BP (mmHg) 78.8±12.3 75.2±14.4 0.060
Respiration rat (/min) 20.7±2.7 23.4±5.3 0.001
Alcoholics 0 (0.0) 1 (2.5) 0.145
Smoking 8 (5.4) 8 (19.5) 0.017
Diabetes mellitus 53 (25.4) 26 (44.8) 0.007
Hypertension 106 (50.7) 34 (58.6) 0.359
Ischemic heart disease 6 (2.9) 8 (13.8) 0.003
Congestive heart failure 10 (4.8) 4 (6.9) 0.760
Stroke 20 (9.6) 8 (13.8) 0.492
ACEI or ARB 51 (24.9) 13 (24.5) 1.000
Diuretics 30 (14.6) 14 (26.4) 0.068
Hemoglobin (g/dL) 12.5±2.2 11.8±2.6 0.043
GFR (mL/min/1.73 m2) 71.0±28.6 62.3±26.6 0.039
Serum potassium (mmol/L) 4.1±0.6 4.1±0.9 0.963
Serum calcium (mg/dL) 8.7±0.6 8.4±0.7 0.020
CK-MB max (IU/L) 1.9±1.9 4.7±6.4 0.005
Troponin max (ng/mL) 1.8±13.1 1.2±5.4 0.654
NT-proBNP (pg/mL)* 5.4±1.6 7.1±1.6 <0.001
C-reactive protein (mg/L) 64.2±65.6 168.4±99.1 <0.001
Data are presented as mean±standard deviation or number (%).
ACEI = angiotensin converting enzyme inhibitor, ARB = angiotensin II receptor blocker, BMI = body mass index; BP = blood pressure; CK-MB = creatine kinase myocardial band; GFR = glomerular filtration rate; NT-proBNP = N-terminal pro-B type natriuretic peptide.
*Log NT-proBNP, NT-proBNP levels that have been log transformed.
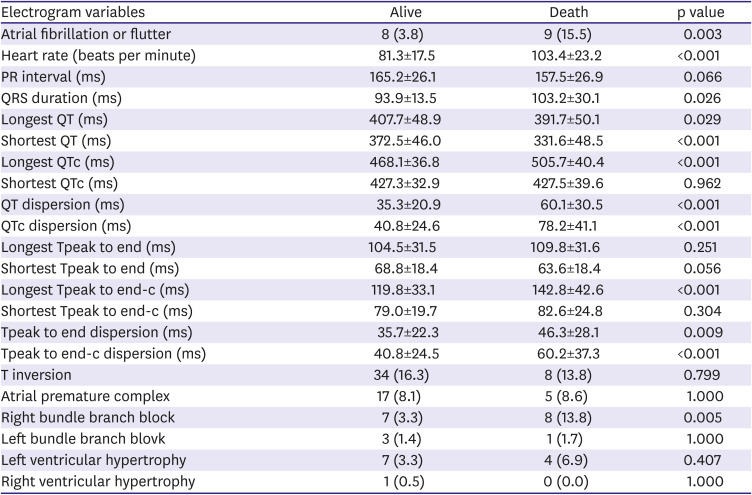
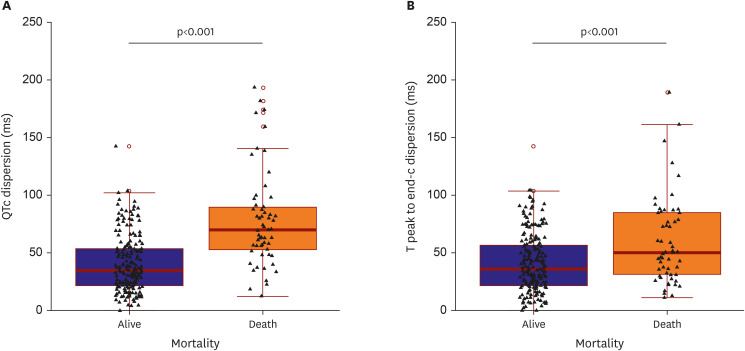
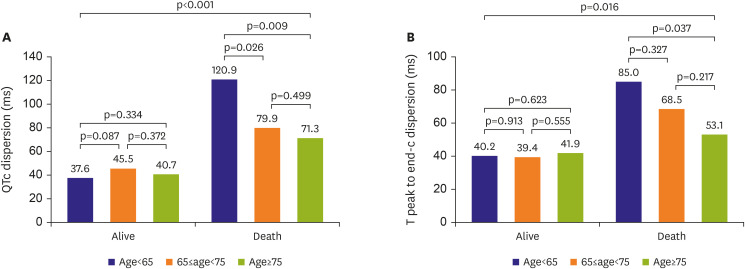
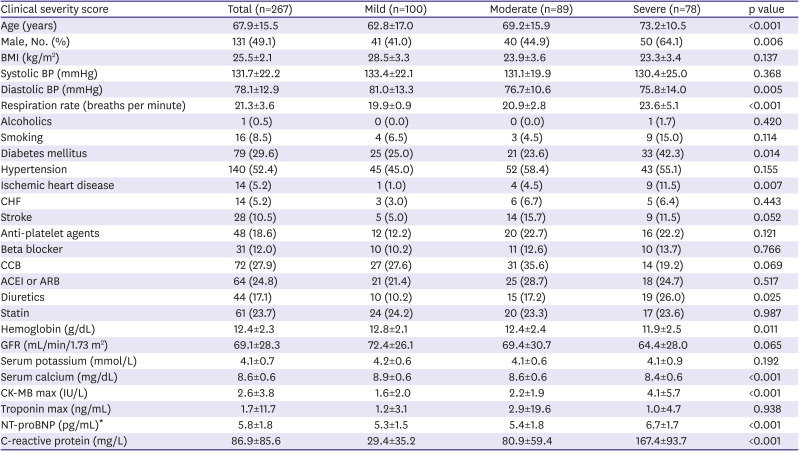
The deceased patients showed higher incidence of atrial fibrillation or flutter, faster heart rate, and wider QRS duration than surviving patients (Table 4). The longest QTc interval was significantly prolonged in deceased patients than surviving patients (468.1±36.8 vs. 505.7±40.4, p<0.001), but the shortest QT interval was similar between both groups. For this reason, the dispersion of the QTc interval in the deceased patients was significantly prolonged compared to those found in surviving patients (Figure 2A). Furthermore, the interval of Tpe-c in the deceased patients was significantly prolonged compared to it in the alive patients (40.8±24.5 vs. 60.2±37.3, p<0.001, Figure 2B). The difference in QTc and Tpe-c dispersion was noticeable in the comparison between the deceased patients and surviving patients under the age of 65, and the difference decreased with age (Figure 3A and B).
Table 4

Electrocardiogram findings according to mortality

kcj-51-851-i004
Electrogram variables Alive Death p value
Atrial fibrillation or flutter 8 (3.8) 9 (15.5) 0.003
Heart rate (beats per minute) 81.3±17.5 103.4±23.2 <0.001
PR interval (ms) 165.2±26.1 157.5±26.9 0.066
QRS duration (ms) 93.9±13.5 103.2±30.1 0.026
Longest QT (ms) 407.7±48.9 391.7±50.1 0.029
Shortest QT (ms) 372.5±46.0 331.6±48.5 <0.001
Longest QTc (ms) 468.1±36.8 505.7±40.4 <0.001
Shortest QTc (ms) 427.3±32.9 427.5±39.6 0.962
QT dispersion (ms) 35.3±20.9 60.1±30.5 <0.001
QTc dispersion (ms) 40.8±24.6 78.2±41.1 <0.001
Longest Tpeak to end (ms) 104.5±31.5 109.8±31.6 0.251
Shortest Tpeak to end (ms) 68.8±18.4 63.6±18.4 0.056
Longest Tpeak to end-c (ms) 119.8±33.1 142.8±42.6 <0.001
Shortest Tpeak to end-c (ms) 79.0±19.7 82.6±24.8 0.304
Tpeak to end dispersion (ms) 35.7±22.3 46.3±28.1 0.009
Tpeak to end-c dispersion (ms) 40.8±24.5 60.2±37.3 <0.001
T inversion 34 (16.3) 8 (13.8) 0.799
Atrial premature complex 17 (8.1) 5 (8.6) 1.000
Right bundle branch block 7 (3.3) 8 (13.8) 0.005
Left bundle branch blovk 3 (1.4) 1 (1.7) 1.000
Left ventricular hypertrophy 7 (3.3) 4 (6.9) 0.407
Right ventricular hypertrophy 1 (0.5) 0 (0.0) 1.000
Data are presented as number (%) or mean±standard deviation.
QTc = corrected QT; Tpe = interval of the peak to end of T wave; Tpe-c = corrected interval of the peak to end of T wave.
Figure 2

Dispersion of corrected QT and Tpe according to mortality. (A) Dispersion of corrected QT (B) Dispersion of corrected Tpe. Red line is mean, and box lesion is quartile.

QTc = corrected QT.
kcj-51-851-g002
Figure 3

QTc and T peak to end dispersion according to mortality by age group.

QTc = corrected QT.
kcj-51-851-g003
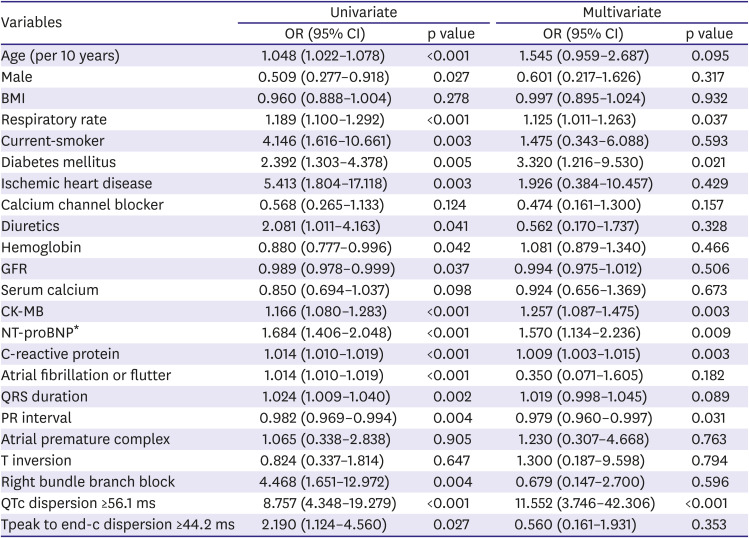
The ROC curve analysis confirmed that both the dispersion of QTc and the Tpe could discriminate mortality with an area under the curve of 0.799 and 0.657 (p<0.001), respectively (Figure 3, Supplementary Figure 2). The cut-off value of the dispersion of QTc and Tpe-c to differentiate between survival and death was 56.1 ms and 44.2 ms with a sensitivity of 74% and 62% and a specificity of 78% and 62%, respectively. The demographics and clinical data according to QTc dispersion were described at Supplementary Table 1. In the multivariate analysis, a QTc dispersion of more than 56.1ms was an independent risk factor of mortality after adjusting several risk factors (odd ratio, 11.552; 95% confidence interval, 3.746–42.306; p<0.001) (Table 5).
Table 5

Predictors of mortality in multivariate analysis

kcj-51-851-i005
Variables Univariate Multivariate
OR (95% CI) p value OR (95% CI) p value
Age (per 10 years) 1.048 (1.022–1.078) <0.001 1.545 (0.959–2.687) 0.095
Male 0.509 (0.277–0.918) 0.027 0.601 (0.217–1.626) 0.317
BMI 0.960 (0.888–1.004) 0.278 0.997 (0.895–1.024) 0.932
Respiratory rate 1.189 (1.100–1.292) <0.001 1.125 (1.011–1.263) 0.037
Current-smoker 4.146 (1.616–10.661) 0.003 1.475 (0.343–6.088) 0.593
Diabetes mellitus 2.392 (1.303–4.378) 0.005 3.320 (1.216–9.530) 0.021
Ischemic heart disease 5.413 (1.804–17.118) 0.003 1.926 (0.384–10.457) 0.429
Calcium channel blocker 0.568 (0.265–1.133) 0.124 0.474 (0.161–1.300) 0.157
Diuretics 2.081 (1.011–4.163) 0.041 0.562 (0.170–1.737) 0.328
Hemoglobin 0.880 (0.777–0.996) 0.042 1.081 (0.879–1.340) 0.466
GFR 0.989 (0.978–0.999) 0.037 0.994 (0.975–1.012) 0.506
Serum calcium 0.850 (0.694–1.037) 0.098 0.924 (0.656–1.369) 0.673
CK-MB 1.166 (1.080–1.283) <0.001 1.257 (1.087–1.475) 0.003
NT-proBNP* 1.684 (1.406–2.048) <0.001 1.570 (1.134–2.236) 0.009
C-reactive protein 1.014 (1.010–1.019) <0.001 1.009 (1.003–1.015) 0.003
Atrial fibrillation or flutter 1.014 (1.010–1.019) <0.001 0.350 (0.071–1.605) 0.182
QRS duration 1.024 (1.009–1.040) 0.002 1.019 (0.998–1.045) 0.089
PR interval 0.982 (0.969–0.994) 0.004 0.979 (0.960–0.997) 0.031
Atrial premature complex 1.065 (0.338–2.838) 0.905 1.230 (0.307–4.668) 0.763
T inversion 0.824 (0.337–1.814) 0.647 1.300 (0.187–9.598) 0.794
Right bundle branch block 4.468 (1.651–12.972) 0.004 0.679 (0.147–2.700) 0.596
QTc dispersion ≥56.1 ms 8.757 (4.348–19.279) <0.001 11.552 (3.746–42.306) <0.001
Tpeak to end-c dispersion ≥44.2 ms 2.190 (1.124–4.560) 0.027 0.560 (0.161–1.931) 0.353
BMI = body mass index; CI = confidence interval; CK-MB = creatine kinase myocardial band; GFR = glomerular filtration rate; NT-proBNP = N-terminal pro-B type natriuretic peptide; OR = odds ratio; QTc = corrected QT.
*Log NT-proBNP, NT-proBNP levels that have been log transformed.

DISCUSSION

The main findings of the current study are as follows. COVID-19 infection might significantly prolong the QT interval and peak to end of T wave, which stands for repolarization abnormality by cardiac injury. The degree of QT interval prolongation and the peak to the end of the T wave might be related to clinical disease severity in COVID-19 infection. A QTc dispersion of more than 56.1 ms could be an independent factor that can predict mortality.
Several reports have demonstrated that viral infections like adenovirus, coronavirus, and herpes are related to cardiac arrhythmia–like atrial fibrillation due to various inflammatory markers including CRP, tumor necrosis factor-α, and interleukin-2, 6, and 8.10)11)12) Moreover, some authors reported that COVID-19 could cause cardiac injuries like myocarditis.5)7)10)12)13) However, it has been acknowledged that data about the mechanism of cardiovascular damage from COVID-19 is limited. Studies have shown that COVID-19 patients with preexisting cardiovascular complications had a higher level of cardiac troponin elevation in their plasma than patients without cardiovascular complications.2)5) The cardiac troponin level was known to increase in acute myocardial injuries, atherosclerotic plaque disruptions, coronary thromboses, critically ill patients, and supply-demand imbalances leading to myocardial injury, metabolic stress by infection, hypoxia, acidosis, and hypotension.5)11)14) Moreover, previous studies mentioned that cardiac injury is based on cardiac biomarkers such as cardiac troponin and NT-proBNP.4)5)10) This study found that CK-MB and log NT-proBNP significantly increased in patients with severe COVID-19 conditions than patients with mild conditions, which are similar to previous reports.
Cardiac injuries in COVID-19 infections could be postulated through several mechanisms. The first is the angiotensin-converting enzyme 2 (ACE2)–mediated direct damage.7)12)15)16)17) ACE2 is an essential regulator of cardiac function and acts as a vasodilator, anti-fibrotic, anti-oxidative, and anti-hypertrophic.12) ACE2 is also a functional receptor for SARS-CoV, which down-regulates ACE2, contributing to myocardial dysfunction.12)18) The use of renin-angiotensin-aldosterone antagonists may be useful in COVID-19, but the ACE2 expression is increased in animal studies using mutant mice.15)16)17)19) However, human studies reported that ACEI or ARB was not significantly associated with mortality.15)16) In this study, the use of ACEI or ARB showed no significant relation to clinical severity. The second is myocardial damage due to hypoxia.5)10)11) The cardiac enzyme of severe patients requiring invasive oxygen therapy is significantly higher than that of mild patients in this study. The last mechanism is the systemic inflammatory response, such as the cytokine storm.5)11)13) In a cardiovascular pathology study, myocarditis was reported because of increased interstitial macrophages and multifocal lymphocytes,13) which agrees with what the present study found, where the CRP significantly increased in severe patients compared to mild patients.
A change in QT intervals in SARS-Cov-2 infections can be secondary to the viral infection itself, the inflammatory state of SARS-Cov-2 infection, and ischemia or hypoxia,7) as shown by how the human immunodeficiency virus and dengue fever have been associated with a prolonged QT interval. Moreover, an animal study using rabbits showed that an acute coronavirus infection was associated with QT interval prolongation. In contrast, systemic inflammation and elevated CRP have been associated with a prolonged QT interval.4)7)14)20) Farre et al.6) reported that COVID-19 infection could prolong the QT interval, affecting the heart and causing arrhythmias.21) The QT interval in an ECG reflects repolarization and can cause cardiac arrhythmia when prolonged. Furthermore, a good prognosis has been reported in patients without an increase in the QT interval.22) There have also been reports of prolonged QT in patients whose myocarditis was demonstrated by myocardial biopsy.23) Based on this study's results, the longest QT interval was more prolonged as disease severity worsened. In addition, this study evaluated the QT dispersion, which is a simple, approximate evaluation of the overall heterogeneity of ventricular repolarization,7) and is a surrogate marker for ventricular repolarization.8)
The QTc dispersion of severe patients significantly increased compared to those of mild patients based on the results of the present study. The patients' Tpe was also assessed, another marker of ventricular repolarization dispersion8)9) that corresponds to the epicardium and myocardium repolarization. However, some cells in the subendothelial tissue are sensitive to early depolarization, possibly leading to arrhythmia. Ozturk et al.21) demonstrated that the Tpe and QT were higher in COVID-19 patients than in the study’s control group. Similar to the QT interval, Tpe and Tpe dispersion significantly increased in severe patients compared to mild patients in the present study. Therefore, COVID-19 infection could be associated with ventricular repolarization because both QTc and Tpe-c dispersion in severe patients significantly increased compared with mild patients.
Increased QT and QT dispersion have been shown as risk factors for sudden cardiac death caused by cardiac arrhythmias.8)9) In terms of QT prolongation in COVID-19, a prolonged QTc interval was associated with higher mortality. Based on the present study's results, deceased patients had prolonged QT intervals compared to surviving patients. Moreover, QTc and Tpe-c dispersion in deceased patients significantly increased compared to those in surviving patients.
There are some limitations to our study. First, this study was a retrospective and observational study. Therefore, we could not determine whether the cause of death in the deceased patients was due to malignant ventricular arrhythmias or if the alive patients suffered from arrhythmias. Second, 267 patients were enrolled to our study although 822 patients admitted at large hospitals due to COVID-19, because the rest of patients could not be underwent ECG test after confirming the COVID-19 due to potential transmission of COVID-19. The most patients were not followed after discharge. Third, the time difference between the onset of COVID-19 and ECG measurement could not be accurately determined which may affect the QT prolongation. While ECG were taken at admission in the most case, laboratory parameters like cardiac enzymes and CRP were obtained at peak level and severity score of patients was at the worst condition. This potential wide spectrum of disease severity is hard to correct statistically them. Fourth, drugs that might affect QT intervals have not been investigated before admission. However, the drugs' effect appeared to be minimal because the ECG was taken at admission.
In conclusion, up to our knowledge, this is first study which shows the association between the COVID-19 infection and cardiac repolarization abnormality by ECG parameters in relatively large Korean patients. COVID-19 infections could significantly prolong QT intervals which stand for the repolarization abnormalities caused by cardiac injuries. Furthermore, the degree of QT interval prolongation might be related to clinical severity by COVID-19 and QTc dispersion of more than 56.1 ms could be an independent predictable factor of mortality.
Notes

Funding: This research was supported by a grant of the Medicity Daegu through, funded by the Medicity Daegu, Republic of Korea. The funders had no role in study design, data collection and analysis, decision to publish, or preparation of the manuscript.

Conflict of Interest: The authors have no financial conflicts of interest.

Data Sharing Statement: The data generated in this study is available from the corresponding author upon reasonable request.

Author Contributions:

  • Conceptualization: Jung BC, Shin DG, Cho Y, Han S, Lee YS.

  • Data curation: Bae HJ, Cho HJ, Lee CH, Bae MH, Park HS, Hwang J, Park KH, Jang SY.

  • Formal analysis: Bae HJ, Cho HJ, Park HS, Jang SY.

  • Funding acquisition: Lee YS.

  • Investigation: Bae HJ, Cho HJ, Bae MH, Park HS, Cho Y, Hwang J, Han S, Lee YS.

  • Methodology: Jung BC, Shin DG, Cho Y, Han S, Park KH, Lee YS.

  • Project administration: Lee YS.

  • Resources: Bae HJ, Cho HJ, Lee CH, Hwang J, Han S, Jang SY, Lee YS.

  • Software: Bae HJ.

  • Supervision: Shin DG, Lee YS.

  • Validation: Lee YS.

  • Visualization: Bae HJ, Lee YS.

  • Writing - original draft: Bae HJ, Cho HJ.

  • Writing - review & editing: Lee YS.

References

1. World Health Organization. Coronavirus disease (COVID-19) outbreak [Internet]. Geneva: World Health Organization;2020. cited 2020 September 27. Available from: https://www.who.int/emergencies/diseases/novel-coronavirus-2019.
2. Inciardi RM, Lupi L, Zaccone G, et al. Cardiac involvement in a patient with coronavirus disease 2019 (COVID-19). JAMA Cardiol. 2020; 5:819–824. PMID: 32219357.
crossref
3. Sinkeler FS, Berger FA, Muntinga HJ, Jansen MM. The risk of QTc-interval prolongation in COVID-19 patients treated with chloroquine. Neth Heart J. 2020; 28:418–423. PMID: 32648153.
crossref
4. Magadum A, Kishore R. Cardiovascular manifestations of COVID-19 infection. Cells. 2020; 9:2508.
crossref
5. Sandoval Y, Januzzi JL Jr, Jaffe AS. Cardiac troponin for assessment of myocardial injury in COVID-19: JACC review topic of the week. J Am Coll Cardiol. 2020; 76:1244–1258. PMID: 32652195.
6. Farré N, Mojón D, Llagostera M, et al. Prolonged QT interval in SARS-CoV-2 infection: prevalence and prognosis. J Clin Med. 2020; 9:2712.
crossref
7. Kochi AN, Tagliari AP, Forleo GB, Fassini GM, Tondo C. Cardiac and arrhythmic complications in patients with COVID-19. J Cardiovasc Electrophysiol. 2020; 31:1003–1008. PMID: 32270559.
crossref
8. Sahu P, Lim PO, Rana BS, Struthers AD. QT dispersion in medicine: electrophysiological holy grail or fool's gold? QJM. 2000; 93:425–431. PMID: 10874051.
crossref
9. Rosenthal TM, Masvidal D, Abi Samra FM, et al. Optimal method of measuring the T-peak to T-end interval for risk stratification in primary prevention. Europace. 2018; 20:698–705. PMID: 28339886.
crossref
10. Tschope C, Ammirati E, Bozkurt B, et al. Myocarditis and inflammatory cardiomyopathy: current evidence and future directions. Nat Rev Cardiol. 2021; 18:169–193. PMID: 33046850.
crossref
11. Jakhmola S, Indari O, Kashyap D, et al. Recent updates on COVID-19: a holistic review. Heliyon (Lond). 2020; 6:e05706.
crossref
12. Clerkin KJ, Fried JA, Raikhelkar J, et al. COVID-19 and cardiovascular disease. Circulation. 2020; 141:1648–1655. PMID: 32200663.
crossref
13. Frangogiannis NG. The significance of COVID-19-associated myocardial injury: how overinterpretation of scientific findings can fuel media sensationalism and spread misinformation. Eur Heart J. 2020; 41:3836–3838. PMID: 33006608.
crossref
14. Dou Q, Wei X, Zhou K, Yang S, Jia P. Cardiovascular manifestations and mechanisms in patients with COVID-19. Trends Endocrinol Metab. 2020; 31:893–904. PMID: 33172748.
crossref
15. Zhang P, Zhu L, Cai J, et al. Association of inpatient use of angiotensin-converting enzyme inhibitors and angiotensin II receptor blockers with mortality among patients with hypertension hospitalized with COVID-19. Circ Res. 2020; 126:1671–1681. PMID: 32302265.
crossref
16. Li J, Wang X, Chen J, Zhang H, Deng A. Association of renin-angiotensin system inhibitors with severity or risk of death in patients with hypertension hospitalized for coronavirus disease 2019 (COVID-19) infection in Wuhan, China. JAMA Cardiol. 2020; 5:825–830. PMID: 32324209.
crossref
17. Lutz C, Maher L, Lee C, Kang W. COVID-19 preclinical models: human angiotensin-converting enzyme 2 transgenic mice. Hum Genomics. 2020; 14:20. PMID: 32498696.
crossref
18. Oudit GY, Kassiri Z, Jiang C, et al. SARS-coronavirus modulation of myocardial ACE2 expression and inflammation in patients with SARS. Eur J Clin Invest. 2009; 39:618–625. PMID: 19453650.
crossref
19. Johansen MD, Irving A, Montagutelli X, et al. Animal and translational models of SARS-CoV-2 infection and COVID-19. Mucosal Immunol. 2020; 13:877–891. PMID: 32820248.
crossref
20. Viljoen C, Sliwa K, Chin A. Interpreting the need for implantable loop recorder monitoring in pregnant women at high risk of arrhythmias-reply. JAMA Cardiol. 2020; 5:1304–1305.
crossref
21. Öztürk F, Karaduman M, Çoldur R, İncecik Ş, Güneş Y, Tuncer M. Interpretation of arrhythmogenic effects of COVID-19 disease through ECG. Aging Male. 2020; 23:1362–1365. PMID: 32449420.
crossref
22. Jiménez-Jáimez J, Macías-Ruiz R, Bermúdez-Jiménez F, et al. Absence of relevant QT interval prolongation in not critically ill COVID-19 patients. Sci Rep. 2020; 10:21417. PMID: 33293554.
crossref
23. Gittleman IW, Thorner MC, Griffith GC. The Q-T interval of the electrocardiogram in acute myocarditis in adults, with autopsy correlation. Am Heart J. 1951; 41:78–90. PMID: 14799440.
crossref

SUPPLEMENTARY MATERIALS

Supplementary Table 1

The demographics and clinical data according to QTc dispersion
kcj-51-851-s001.xls

Supplementary Figure 1

Flow chart of enrolled patients.
kcj-51-851-s002.ppt

Supplementary Figure 2

Receiver operating characteristics curve of mortality.
kcj-51-851-s003.ppt
TOOLS
Similar articles