INTRODUCTION
METHODS
1. Data and subjects
2. Dietary variables
3. Anthropometric and biochemical variables
4. Cardiovascular risk factors
5. Other variables
6. Statistical analyses
RESULTS
1. Characteristics of the study subjects by sex
Table 1.
| Total (n=25,925) | Men (n=11,289) | Women (n=14,636) | Pb | |
|---|---|---|---|---|
| Age, y | ||||
| 20-29 | 24.2 | 23.6 | 24.8 | <0.001 |
| 30-49 | 52.6 | 49.7 | 55.9 | |
| 50-64 | 17.1 | 19.5 | 14.4 | |
| 65-74 | 4.2 | 5.0 | 3.3 | |
| ≥75 | 1.9 | 2.1 | 1.6 | |
| Education | ||||
| Elementary or less | 8.8 | 8.4 | 9.1 | 0.179 |
| Junior high school | 7.7 | 7.9 | 7.4 | |
| High school | 42.7 | 42.7 | 42.7 | |
| College or more | 40.9 | 41.0 | 40.8 | |
| Household income | ||||
| Q1 (lowest) | 10.6 | 10.9 | 10.2 | 0.060 |
| Q2 | 25.4 | 25.5 | 25.2 | |
| Q3 | 31.8 | 32.1 | 31.5 | |
| Q4 (highest) | 32.3 | 31.5 | 33.1 | |
| Residence | ||||
| Urban | 83.5 | 81.8 | 85.3 | <0.001 |
| Rural | 16.5 | 18.2 | 14.7 | |
| Currently smoking | ||||
| Yes | 26.6 | 44.6 | 6.3 | <0.001 |
| No | 73.4 | 55.4 | 93.7 | |
| Currently consuming alcohol | ||||
| Yes | 62.8 | 75.4 | 48.8 | <0.001 |
| No | 37.2 | 24.6 | 51.2 | |
| Physical activity | ||||
| Yes | 42.9 | 44.5 | 40.9 | <0.001 |
| No | 57.1 | 55.5 | 59.1 | |
| Cardiovascular risk factors | ||||
| BMI, kg/m2 | 23.3±0.0 | 23.9±0.0 | 22.6±0.0 | <0.001 |
| Waist circumference, cm | 79.8±0.1 | 83.4±0.1 | 75.8±0.1 | <0.001 |
| Total cholesterol, mg/dL | 184.7±0.3 | 186.8±0.4 | 182.5±0.4 | <0.001 |
| Triglycerides, mg/dL | 116.1±0.6 | 134.3±0.9 | 95.7±0.6 | <0.001 |
| HDL cholesterol, mg/dL | 50.5±0.1 | 47.5±0.1 | 53.8±0.1 | <0.001 |
| LDL cholesterol, mg/dL | 111.0±0.3 | 112.4±0.4 | 109.5±0.3 | <0.001 |
| Systolic blood pressure, mmHg | 113.5±0.1 | 117.5±0.2 | 109.1±0.2 | <0.001 |
| Diastolic blood pressure, mmHg | 75.2±0.1 | 78.3±0.1 | 71.8±0.1 | <0.001 |
| Fasting blood glucose, mg/dL | 93.2±0.1 | 94.7±0.2 | 91.5±0.2 | <0.001 |
| Prevalence of cardiovascular risk factors | ||||
| Obesity | 27.6 | 33.6 | 20.8 | <0.001 |
| Metabolic syndrome | 14.6 | 18.3 | 10.3 | <0.001 |
| Increased waist circumference | 18.8 | 21.8 | 15.4 | <0.001 |
| Elevated triglycerides | 23.4 | 32.6 | 13.1 | <0.001 |
| Reduced HDL cholesterol | 31.8 | 24.6 | 40.0 | <0.001 |
| Elevated blood pressure | 21.4 | 29.4 | 12.3 | <0.001 |
| Elevated fasting blood glucose | 19.3 | 23.9 | 14.1 | <0.001 |
| Type 2 diabetes | 2.1 | 2.6 | 1.6 | <0.001 |
| Hypercholesterolemia (≥200 mg/dL) | 30.6 | 33.4 | 27.5 | <0.001 |
| Hypercholesterolemia (≥240 mg/dL) | 5.9 | 6.3 | 5.4 | 0.008 |
| Hypertriglyceridemia | 11.8 | 17.3 | 5.7 | <0.001 |
| Atherogenic dyslipidemia | 11.5 | 13.3 | 9.6 | <0.001 |
Values are presented as mean±standard error or percentage.
Abbreviations: BMI, body mass index; HDL, high-density lipoprotein; LDL, low-density lipoprotein.
2. Macronutrient intake by LDL cholesterol level
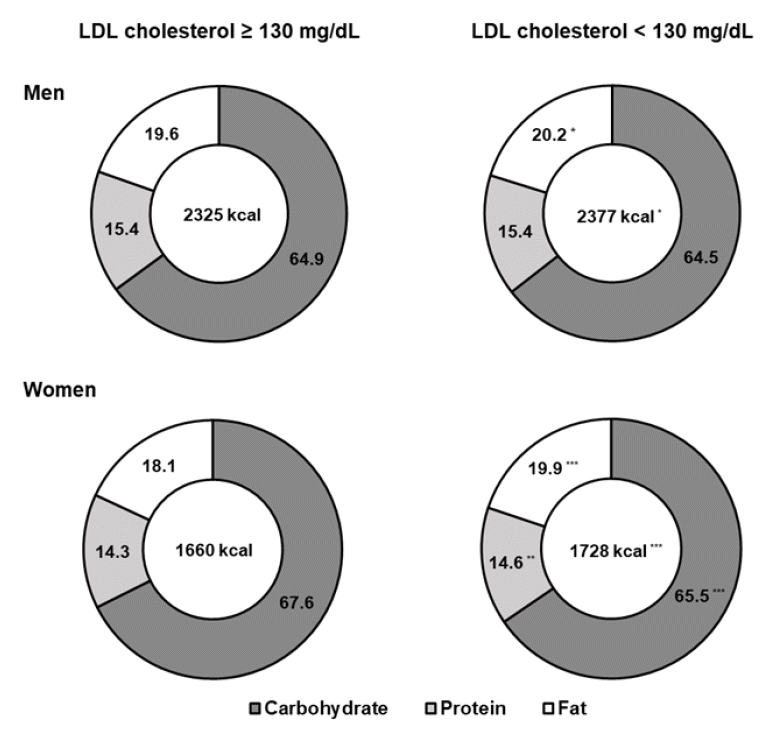
 | Fig. 2.Energy and macronutrient intake by sex and LDL cholesterol levelsa,b. LDL, low-density lipoprotein. *<0.05, **<0.01, ***<0.001 between LDL cholesterol groups. aAll analyses accounted for the complex sampling design effect and appropriate sampling weights of the national survey using the PROC SURVEY in the SAS program (SAS Institute, Cary, NC, USA). bMacronutrient intake was presented as a percentage of total energy intake. Mean and P-values were obtained from the regression analysis after adjustment for age, residence, education, household income, smoking, alcohol drinking, physical activity, body mass index, and total energy intake. |
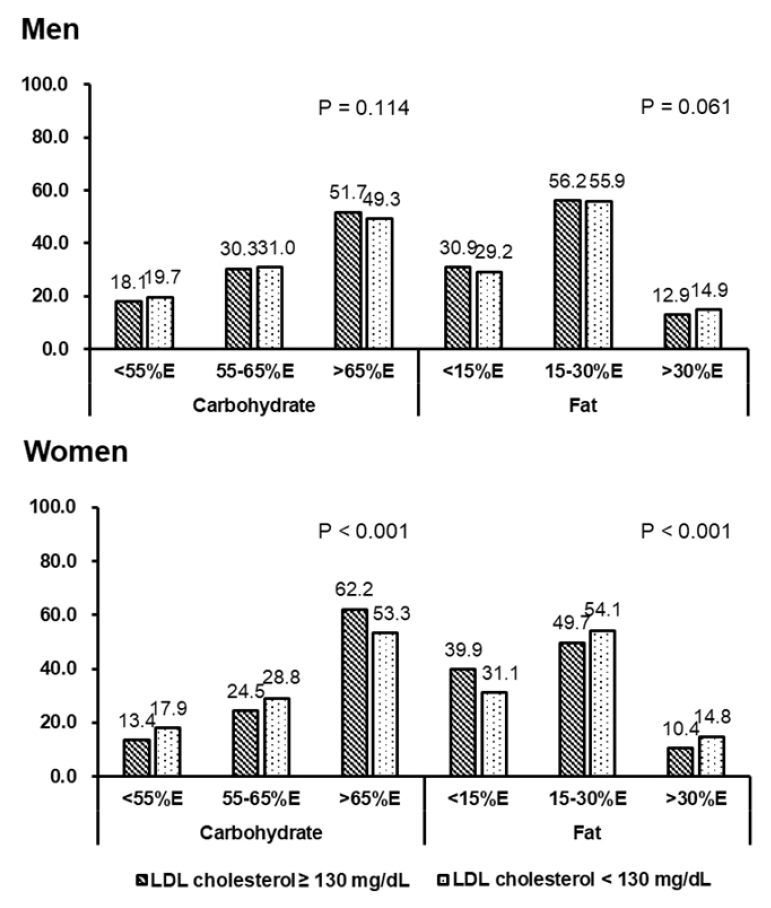
 | Fig. 3.Distribution of study subjects across dietary carbohydrate and fat intake by sex and LDL cholesterol levels.a,b LDL, low-density lipoprotein. aAll analyses accounted for the complex sampling design effect and appropriate sampling weights of the national survey using the PROC SURVEY in the SAS program (SAS Institute, Cary, NC, USA). bPercentages of subjects according to the acceptable macronutrient distribution range from the 2015 dietary reference intakes for Koreans were presented. P-values were obtained from the Rao-Scott chi-square test. |
3. Cardiovascular risk factors by LDL cholesterol level
Table 2.
|
LDL cholesterol, mg/dL |
Pb | ||
|---|---|---|---|
| ≥130 | <130 | ||
| Men | 3,106 | 8,183 | |
| BMI, kg/m2 | 24.7±0.1 | 23.5±0.1 | <0.001 |
| Waist circumference, cm | 85.9±0.2 | 81.9±0.1 | <0.001 |
| Total cholesterol, mg/dL | 225.2±0.6 | 172.2±0.4 | <0.001 |
| Triglycerides, mg/dL | 135.9±1.5 | 131.1±1.2 | 0.008 |
| HDL cholesterol, mg/dL | 46.9±0.3 | 47.5±0.2 | 0.027 |
| LDL cholesterol, mg/dL | 151.0±0.5 | 98.4±0.3 | <0.001 |
| Systolic blood pressure, mmHg | 119.0±0.3 | 117.0±0.2 | <0.001 |
| Diastolic blood pressure, mmHg | 80.0±0.3 | 78.1±0.2 | <0.001 |
| Fasting blood glucose, mg/dL | 96.0±0.4 | 93.4±0.2 | <0.001 |
| Women | 3,507 | 11,129 | |
| BMI, kg/m2 | 24.0±0.1 | 22.2±0.0 | <0.001 |
| Waist circumference, cm | 79.3±0.3 | 74.3±0.1 | <0.001 |
| Total cholesterol, mg/dL | 225.5±0.6 | 168.8±0.3 | <0.001 |
| Triglycerides, mg/dL | 111.4±1.3 | 89.2±0.7 | <0.001 |
| HDL cholesterol, mg/dL | 52.7±0.3 | 53.4±0.1 | 0.011 |
| LDL cholesterol, mg/dL | 150.5±0.5 | 97.6±0.2 | <0.001 |
| Systolic blood pressure, mmHg | 113.2±0.4 | 107.3±0.2 | <0.001 |
| Diastolic blood pressure, mmHg | 74.7±0.2 | 71.0±0.1 | <0.001 |
| Fasting blood glucose, mg/dL | 95.2±0.5 | 89.6±0.1 | <0.001 |
Values are presented as mean±standard error or number.
Abbreviations: BMI, body mass index; HDL, high-density lipoprotein; LDL, low-density lipoprotein.
4. Association between dietary carbohydrate intake and cardiovascular risk factors by LDL cholesterol level in men
Table 3.
|
Quintiles of dietary carbohydrate intake, g/day |
||||||||
|---|---|---|---|---|---|---|---|---|
| Q1 | Q2 | Q3 | Q4 | Q5 | P for trend | |||
| LDL cholesterol ≥130 mg/dL | ||||||||
| Carbohydrate intake | 206.6±2.0 | 284.2±0.7 | 339.5±0.8 | 402.9±1.0 | 533.9±3.8 | |||
| Obesity | 1.00 (Ref.) | 0.92 (0.67-1.27) | 0.98 (0.70-1.37) | 0.76 (0.54-1.07) | 0.73 (0.49-1.11) | 0.082 | ||
| Metabolic syndrome | 1.00 (Ref.) | 1.40 (0.93-2.12) | 1.45 (0.93-2.27) | 1.29 (0.81-2.07) | 1.79 (1.01-3.20) | 0.130 | ||
| Increased waist circumference | 1.00 (Ref.) | 0.92 (0.65-1.29) | 0.87 (0.60-1.26) | 0.64 (0.45-0.93) | 0.66 (0.42-1.03) | 0.018 | ||
| Elevated triglycerides | 1.00 (Ref.) | 1.36 (0.97-1.90) | 1.16 (0.83-1.62) | 1.46 (1.04-2.05) | 1.29 (0.84-1.97) | 0.179 | ||
| Reduced HDL cholesterol | 1.00 (Ref.) | 1.39 (0.97-1.97) | 1.18 (0.81-1.72) | 1.76 (1.18-2.62) | 2.33 (1.44-3.78) | <0.001 | ||
| Elevated blood pressure | 1.00 (Ref.) | 0.97 (0.70-1.35) | 1.00 (0.71-1.41) | 0.84 (0.58-1.20) | 0.81 (0.52-1.27) | 0.272 | ||
| Elevated fasting blood glucose | 1.00 (Ref.) | 0.83 (0.58-1.18) | 0.86 (0.59-1.25) | 0.78 (0.53-1.16) | 0.71 (0.44-1.15) | 0.181 | ||
| Type 2 diabetes | 1.00 (Ref.) | 0.75 (0.29-1.96) | 1.04 (0.42-2.58) | 1.20 (0.48-3.00) | 0.61 (0.18-2.12) | 0.875 | ||
| Hypercholesterolemiac | 1.00 (Ref.) | 0.65 (0.45-0.94) | 0.81 (0.56-1.18) | 0.72 (0.49-1.07) | 0.62 (0.39-0.99) | 0.112 | ||
| Hypertriglyceridemia | 1.00 (Ref.) | 1.19 (0.77-1.82) | 0.95 (0.60-1.48) | 1.10 (0.71-1.73) | 1.02 (0.60-1.75) | 0.990 | ||
| Atherogenic dyslipidemia | 1.00 (Ref.) | 1.49 (0.92-2.40) | 1.44 (0.88-2.36) | 1.95 (1.17-3.25) | 3.08 (1.67-5.70) | <0.001 | ||
| LDL cholesterol <130 mg/dL | ||||||||
| Carbohydrate intake | 202.5±1.2 | 285.1±0.6 | 341.9±0.5 | 404.6±0.6 | 540.1±2.7 | |||
| Obesity | 1.00 (Ref.) | 0.94 (0.75-1.16) | 1.00 (0.81-1.23) | 0.88 (0.70-1.11) | 0.86 (0.65-1.13) | 0.264 | ||
| Metabolic syndrome | 1.00 (Ref.) | 0.92 (0.69-1.23) | 1.02 (0.75-1.37) | 1.22 (0.90-1.65) | 1.19 (0.81-1.73) | 0.134 | ||
| Increased waist circumference | 1.00 (Ref.) | 0.87 (0.67-1.12) | 0.88 (0.68-1.13) | 0.89 (0.68-1.18) | 0.71 (0.50-1.00) | 0.130 | ||
| Elevated triglycerides | 1.00 (Ref.) | 0.95 (0.76-1.18) | 0.93 (0.74-1.17) | 0.93 (0.73-1.18) | 1.03 (0.78-1.37) | 0.990 | ||
| Reduced HDL cholesterol | 1.00 (Ref.) | 1.27 (0.99-1.61) | 1.51 (1.19-1.91) | 1.77 (1.37-2.30) | 2.27 (1.65-3.13) | <0.001 | ||
| Elevated blood pressure | 1.00 (Ref.) | 0.91 (0.72-1.15) | 1.15 (0.90-1.47) | 0.92 (0.72-1.19) | 0.75 (0.55-1.02) | 0.175 | ||
| Elevated fasting blood glucose | 1.00 (Ref.) | 0.84 (0.66-1.08) | 0.98 (0.76-1.28) | 0.82 (0.62-1.07) | 0.73 (0.53-0.99) | 0.085 | ||
| Type 2 diabetes | 1.00 (Ref.) | 0.44 (0.21-0.94) | 1.19 (0.66-2.15) | 0.51 (0.22-1.15) | 0.64 (0.30-1.39) | 0.452 | ||
| Hypercholesterolemiac | 1.00 (Ref.) | 0.99 (0.75-1.29) | 0.87 (0.65-1.16) | 0.80 (0.58-1.11) | 0.84 (0.58-1.22) | 0.182 | ||
| Hypertriglyceridemia | 1.00 (Ref.) | 1.33 (1.02-1.72) | 1.26 (0.97-1.65) | 1.23 (0.92-1.66) | 1.29 (0.91-1.82) | 0.318 | ||
| Atherogenic dyslipidemia | 1.00 (Ref.) | 1.29 (0.97-1.73) | 1.24 (0.92-1.66) | 1.56 (1.13-2.15) | 2.25 (1.50-3.37) | <0.001 | ||
Values are presented as mean±standard error or OR (95% CI).
Abbreviations: CI, confidence interval; HDL, high-density lipoprotein; LDL, low-density lipoprotein; OR, odds ratio; Ref., reference.
a All analyses accounted for the complex sampling design effect and appropriate sampling weights of the national survey using the PROC SURVEY in the SAS program (SAS Institute, Cary, NC, USA).
5. Association between dietary carbohydrate intake and cardiovascular risk factors by LDL cholesterol level in women
Table 4.
|
Quintiles of dietary carbohdyrate intake, g/day |
||||||||
|---|---|---|---|---|---|---|---|---|
| Q1 | Q2 | Q3 | Q4 | Q5 | P for trend | |||
| LDL cholesterol ≥130 mg/dL | ||||||||
| Carbohydrate intake | 153.7±1.4 | 219.9±0.7 | 270.3±0.6 | 324.1±0.9 | 448.0±4.0 | |||
| Obesity | 1.00 (Ref.) | 0.82 (0.58-1.15) | 0.91 (0.63-1.33) | 0.98 (0.66-1.46) | 0.83 (0.47-1.46) | 0.879 | ||
| Metabolic syndrome | 1.00 (Ref.) | 1.20 (0.74-1.94) | 1.20 (0.73-1.98) | 1.33 (0.75-2.37) | 1.04 (0.49-2.21) | 0.596 | ||
| Increased waist circumference | 1.00 (Ref.) | 0.88 (0.60-1.30) | 1.17 (0.79-1.74) | 1.12 (0.72-1.74) | 0.88 (0.48-1.60) | 0.751 | ||
| Elevated triglycerides | 1.00 (Ref.) | 1.11 (0.74-1.68) | 1.16 (0.76-1.76) | 1.33 (0.84-2.11) | 0.96 (0.51-1.82) | 0.548 | ||
| Reduced HDL cholesterol | 1.00 (Ref.) | 1.39 (0.99-1.94) | 1.36 (0.95-1.95) | 1.59 (1.06-2.37) | 1.62 (0.94-2.80) | 0.060 | ||
| Elevated blood pressure | 1.00 (Ref.) | 1.32 (0.87-2.01) | 0.69 (0.43-1.11) | 1.15 (0.70-1.90) | 0.69 (0.35-1.38) | 0.436 | ||
| Elevated fasting blood glucose | 1.00 (Ref.) | 0.84 (0.56-1.27) | 0.95 (0.61-1.48) | 1.04 (0.62-1.74) | 1.09 (0.55-2.18) | 0.687 | ||
| Type 2 diabetes | 1.00 (Ref.) | 0.44 (0.16-1.22) | 0.30 (0.11-0.83) | 0.47 (0.16-1.44) | 0.17 (0.03-0.93) | 0.096 | ||
| Hypercholesterolemiac | 1.00 (Ref.) | 1.18 (0.82-1.69) | 1.20 (0.82-1.77) | 1.09 (0.72-1.66) | 0.99 (0.56-1.77) | 0.977 | ||
| Hypertriglyceridemia | 1.00 (Ref.) | 1.19 (0.68-2.09) | 0.96 (0.53-1.75) | 1.38 (0.66-2.88) | 0.97 (0.30-3.15) | 0.738 | ||
| Atherogenic dyslipidemia | 1.00 (Ref.) | 1.14 (0.72-1.83) | 1.19 (0.73-1.94) | 1.40 (0.80-2.42) | 1.29 (0.62-2.67) | 0.312 | ||
| LDL cholesterol <130 mg/dL | ||||||||
| Carbohydrate intake | 153.4±0.8 | 219.9±0.4 | 268.9±0.4 | 324.6±0.4 | 445.3±2.4 | |||
| Obesity | 1.00 (Ref.) | 0.81 (0.65-1.02) | 0.82 (0.64-1.06) | 0.84 (0.64-1.12) | 0.81 (0.57-1.17) | 0.344 | ||
| Metabolic syndrome | 1.00 (Ref.) | 1.27 (0.89-1.82) | 0.90 (0.59-1.37) | 1.02 (0.65-1.60) | 0.86 (0.48-1.54) | 0.476 | ||
| Increased waist circumference | 1.00 (Ref.) | 0.84 (0.64-1.10) | 0.83 (0.62-1.11) | 0.95 (0.69-1.29) | 0.82 (0.55-1.22) | 0.618 | ||
| Elevated triglycerides | 1.00 (Ref.) | 1.12 (0.85-1.47) | 1.05 (0.77-1.43) | 1.00 (0.71-1.42) | 1.14 (0.74-1.75) | 0.878 | ||
| Reduced HDL cholesterol | 1.00 (Ref.) | 1.08 (0.89-1.30) | 1.18 (0.97-1.44) | 1.26 (1.01-1.57) | 1.33 (0.99-1.78) | 0.025 | ||
| Elevated blood pressure | 1.00 (Ref.) | 0.94 (0.71-1.23) | 0.88 (0.65-1.20) | 0.80 (0.56-1.14) | 0.83 (0.52-1.32) | 0.282 | ||
| Elevated fasting blood glucose | 1.00 (Ref.) | 1.06 (0.80-1.41) | 1.13 (0.83-1.55) | 0.96 (0.69-1.33) | 0.74 (0.48-1.12) | 0.294 | ||
| Type 2 diabetes | 1.00 (Ref.) | 1.95 (0.63-6.10) | 2.26 (0.66-7.72) | 1.15 (0.32-4.08) | 2.06 (0.29-14.58) | 0.723 | ||
| Hypercholesterolemiac | 1.00 (Ref.) | 0.84 (0.63-1.12) | 0.89 (0.66-1.20) | 0.51 (0.36-0.72) | 0.62 (0.41-0.94) | 0.002 | ||
| Hypertriglyceridemia | 1.00 (Ref.) | 0.89 (0.62-1.29) | 0.94 (0.61-1.43) | 0.67 (0.43-1.04) | 0.73 (0.41-1.29) | 0.146 | ||
| Atherogenic dyslipidemia | 1.00 (Ref.) | 1.30 (0.95-1.78) | 1.25 (0.87-1.78) | 1.20 (0.80-1.80) | 1.46 (0.88-2.41) | 0.328 | ||
Values are presented as mean±standard error or OR (95% CI).
Abbreviations: CI, confidence interval; HDL, high-density lipoprotein; LDL, low-density lipoprotein; OR, odds ratio; Ref., reference.
a All analyses accounted for the complex sampling design effect and appropriate sampling weights of the national survey using the PROC SURVEY in the SAS program (SAS Institute, Cary, NC, USA).


 PDF
PDF Citation
 Print
Print


 XML Download