서론
방법
1. 대상
2. 방법
1) 비알코올 지방간질환의 진단 및 복부 골반 CT 검사
2) 혈액검사
3) 임상 진찰 및 생활습관 평가
4) 통계 분석
결과
1. 비알코올 지방간질환 유무에 따른 대상군의 특성
Table 1.
| Total subjects (n=785) | Non-NAFLD group (n=490) | NAFLD group (n=295) | Pa | AUROC (95% CI) |
|---|---|---|---|---|
| Sex | <0.001 | |||
| Male | 249 (50.8) | 210 (71.2) | ||
| Female | 241 (49.1) | 85 (28.8) | ||
| Alcohol | 149 (30.4) | 102 (34.6) | 0.225 | |
| Smoking | 101 (20.6) | 85 (28.8) | 0.009 | |
| Exercise | 136 (27.8) | 77 (26.1) | 0.614 | |
| FLI | <0.001 | |||
| <30 | 349 (90.4) | 118 (55.7) | ||
| ≥60 | 37 (9.6) | 94 (44.3) | ||
| Age, y | 52.87±10.40 | 52.74±9.65 | 0.866 | |
| BMI | 23.73±2.71 | 25.92±3.53 | <0.001 | 0.673 (0.626-0.720) |
| SBP, mmHg | 121.59±12.47 | 125.40±11.75 | <0.001 | |
| DBP, mmHg | 74.83±9.35 | 78.39±10.20 | <0.001 | |
| FBS, mg/dL | 92.98±23.46 | 97.53±25.89 | 0.012 | |
| AST, U/L | 29.35±13.29 | 36.97±37.59 | 0.001 | |
| ALT, U/L | 25.95±19.98 | 38.89±29.50 | <0.001 | 0.694 (0.650-0.739) |
| GGT, U/L | 32.36±38.98 | 68.07±219.50 | 0.006 | |
| Insulin, μIU/mL | 4.94±6.20 | 6.99±5.68 | <0.001 | 0.645 (0.597-0.693) |
| TC, mg/dL | 199.63±35.24 | 206.06±43.74 | 0.024 | |
| HDL-C, mg/dL | 56.79±12.76 | 53.87±14.43 | 0.004 | |
| TG, mg/dL | 98.27±63.53 | 138.65±140.91 | <0.001 | |
| LDL-C, mg/dL | 119.35±32.39 | 125.54±38.06 | 0.020 | |
| hs-CRP, mg/L | 1.56±3.41 | 1.87±3.58 | 0.280 | |
| Vitamin D, ng/mL | 19.16±8.97 | 19.11±7.82 | 0.935 | |
| Visceral fat, cm² | 88.81±170.47 | 130.98±69.37 | <0.001 | 0.69 (0.644-0.736) |
| Subcutaneous fat, cm² | 139.27±66.34 | 161.64±111.87 | <0.001 | |
| Waist circumference, cm | 81.46±9.26 | 87.87±9.86 | <0.001 | 0.654 (0.606-0.702) |
| Serum UA, mg/dL | 4.88±1.42 | 5.63±1.41 | <0.001 | |
| Serum Cr, mg/dL | 0.81±0.21 | 0.87±0.17 | <0.001 | |
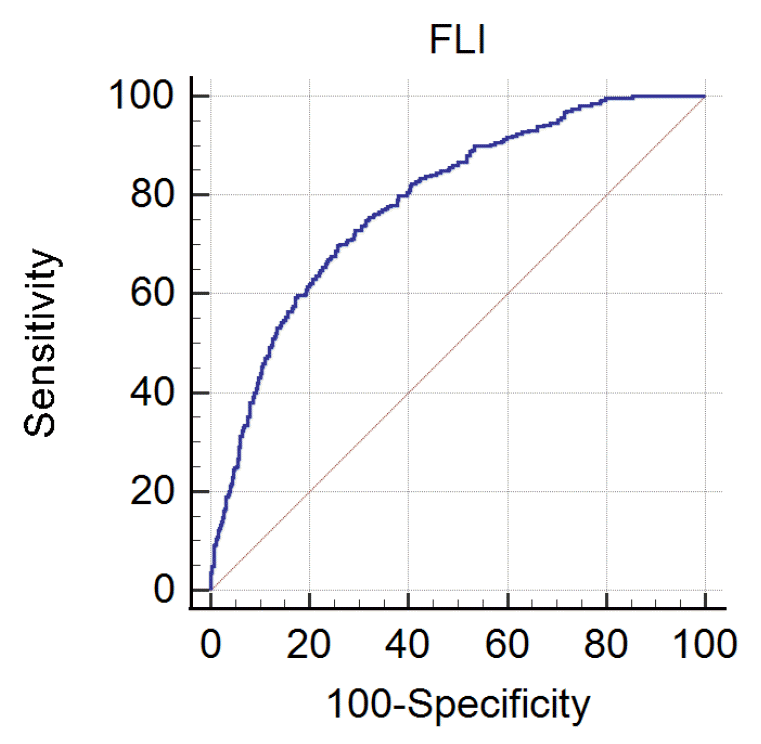
| FLI | 22.59±20.05 | 42.48±27.63 | <0.001 | 0.696 (0.649-0.742) |
Values are presented as mean±standard deviation or number (%).
Smoking: the number of individuals who are currently smoking or who smoked within the last 2 years; Alcohol: the number of individuals who drank at least once a month in the last year; Exercise: the number of individuals performing physical activity at least three times in a week, and for at least 20 minutes per trial.
Abbreviations: ALT, alanine transaminase; AST, aspartate transaminase; AUROC, area under the receiver operator characteristic; BMI, body mass index; CI, confidence interval; Cr, creatinine; DBP, diastolic blood pressure; FBS, fasting blood sugar; FLI, fatty liver index; GGT, γ-glutamyl-transferase; HDL-C, high-density lipoprotein-cholesterol; hs-CRP, hyper sensitivity C-reactive protein; LDL-C, low-density lipoprotein cholesterol; NAFLD, non-alcoholic fatty liver disease; SBP, systolic blood pressure; TC, total cholesterol; TG, triglyceride; UA, uric acid.
2. 비알코올 지방간질환 예측에 대한 각 변수 간 비교
3. FLI와 CT를 이용한 지방간 진단의 일치성
Table 2.
| Total subjects (n=785) | Non-NAFLD group (n=490) | NAFLD group (n=295) | Pa | AUROC (95% CI) |
|---|---|---|---|---|
| BMI | 23.73±2.71 | 25.92±3.53 | <0.001 | 0.673 (0.626-0.720) |
| ALT, U/L | 25.95±19.98 | 38.89±29.50 | <0.001 | 0.694 (0.650-0.739) |
| Insulin, μIU/mL | 4.94±6.20 | 6.99±5.68 | <0.001 | 0.645 (0.597-0.693) |
| Visceral fat, cm² | 88.81±170.47 | 130.98±69.37 | <0.001 | 0.690 (0.644-0.736) |
| Waist circumference, cm | 81.46±9.26 | 87.87±9.86 | <0.001 | 0.654 (0.606-0.702) |
| FLI | 22.59±20.05 | 42.48±27.63 | <0.001 | 0.696 (0.649-0.742) |
Table 3.
| FLI cut off value | Non-NAFLD group | NAFLD group | Pa |
|---|---|---|---|
| <25.4933 | 318 (65.6) | 100 (34.0) | <0.0001 |
| ≥25.4933 | 167 (34.4) | 194 (66.0) | <0.0001 |


 PDF
PDF Citation
 Print
Print


 XML Download