INTRODUCTION
Fixed-dose combinations (FDC) contribute to a better clinical outcome with increased compliance over monotherapy [
1-
3]. In this context, many pharmaceutical companies are interested in the development of FDC. Drug-drug interaction (DDI) studies between active ingredients are required in FDC development, which generally encompasses multiple-dose studies. However, such clinical trials may encounter difficulties due to some pharmacokinetic (PK) properties, e.g., long half-life and delayed distribution. Drugs with such properties may cause carry-over between dosing, resulting in long sampling periods and wash-out periods, or steady-state achievement may be questioned in studies designed to avoid prolonged clinical trials, e.g., one-sequence cross-over design.
A typical example is amlodipine. Amlodipine is a frequently prescribed drug for managing hypertension and coronary artery disease in people suffering from angina [
4]. Various medications such as statins for hyperlipidemia and cardiovascular disease treatment, or angiotensin receptor blockers and thiazide-like diuretics for hypertension treatment are used concomitantly as combination therapy with amlodipine to enhance the efficacy in patients. Conventional non-compartmental analysis (NCA) for DDI evaluation for this kind of drug may not be suitable due to the possibility of incomplete attainment of full-PK concentration-time profiles where
AUCinf and terminal half-life (
t1/2) are misestimated, producing inaccurate interpretations as a consequence. Therefore, several suggestions have been proposed to overcome NCA limitations regarding drugs with a long half-life [
5-
8].
Among these, model-based analysis has been recommended as an alternative method to NCA. Model-based analysis can comprehend the full concentration-time profiles even with sparse or incomplete data, allowing various scenarios to be simulated and can integrate prior information from the literature [
6]. Also, Svensson
et al. [
7] reported that the NCA approach underpredicted DDI impact and showed bias in the bedaquiline (half-life more than five months) simulation study. Conversely, model-based analysis was unbiased and showed an increased precision in DDI predictions. The terminal half-life was estimated ten times lower in NCA than the actual value, caused by invalid extrapolation from insufficient sampling. The discrepancy between the two methods highlighted the accuracy of the model-based analysis compared to NCA [
7]. Yet, the knowledge toward a comparison between strategies is incomplete and challenges should be clarified [
9]. Further evaluation and research are needed for the utilization of the method.
The study’s objective was to compare NCA and model-based analysis for DDI evaluation using amlodipine data from a human pharmacology study. The clinical trial was adequately designed according to the applicable regulations with sufficient sampling periods for steady-state achievement. We expect to contribute and accumulate our experiences by establishing a standard PK comparison method for drugs with a long half-life.
Go to :

METHODS
Subjects and dataset
The PK data were obtained from a DDI study for FDC development, designed as an open-label, multiple-dose, single-sequence cross-over, comparative PK study. This study was conducted at Seoul St. Mary’s Hospital under all applicable regulations and ethical principles (Institutional Review Board control number: KC20MDSF0055).
The included subjects were Korean male volunteers whose mean values for age, weight, and height were 30 years (range: 23–46 years), 72.0 kg (range: 56.2–83.9 kg), and 175.3 cm (range: 164–191 cm), respectively. No subjects had any evidence of underlying disease or history that could affect the study, including abnormal aspartate transaminase, alanine transaminase, total bilirubin and total cholesterol, allergic history reaction to the investigational drugs (amlodipine and potential interacting medications), excessive caffeine, alcohol consumption, and smoking, or any criteria that were considered ineligible by the investigator. The demographics and laboratory test results are summarized in
Table 1.
Table 1
|
Variables |
Mean (range) |
|
Age (yr) |
30 (23–46) |
|
Weight (kg) |
72.0 (56.2–83.9) |
|
Height (cm) |
175.3 (164–191) |
|
Albumin (g/dl) |
4.6 (4.2–5.0) |
|
Body mass index (kg/m2) |
23.4 (19.2–26.5) |
|
Alanine transaminase (IU/L) |
29.7 (9.0–54.0) |
|
Aspartate transaminase (IU/L) |
23.5 (15.0–36.0) |
|
Serum creatinine (mg/dl) |
0.9 (0.7–1.1) |
|
Creatinine clearance (mL/min) |
122.2 (90.5–175.6) |
Glomerular filtration rate (GFR)*
(ml/min/1.73m2) |
99.5 (77.3–131.1) |

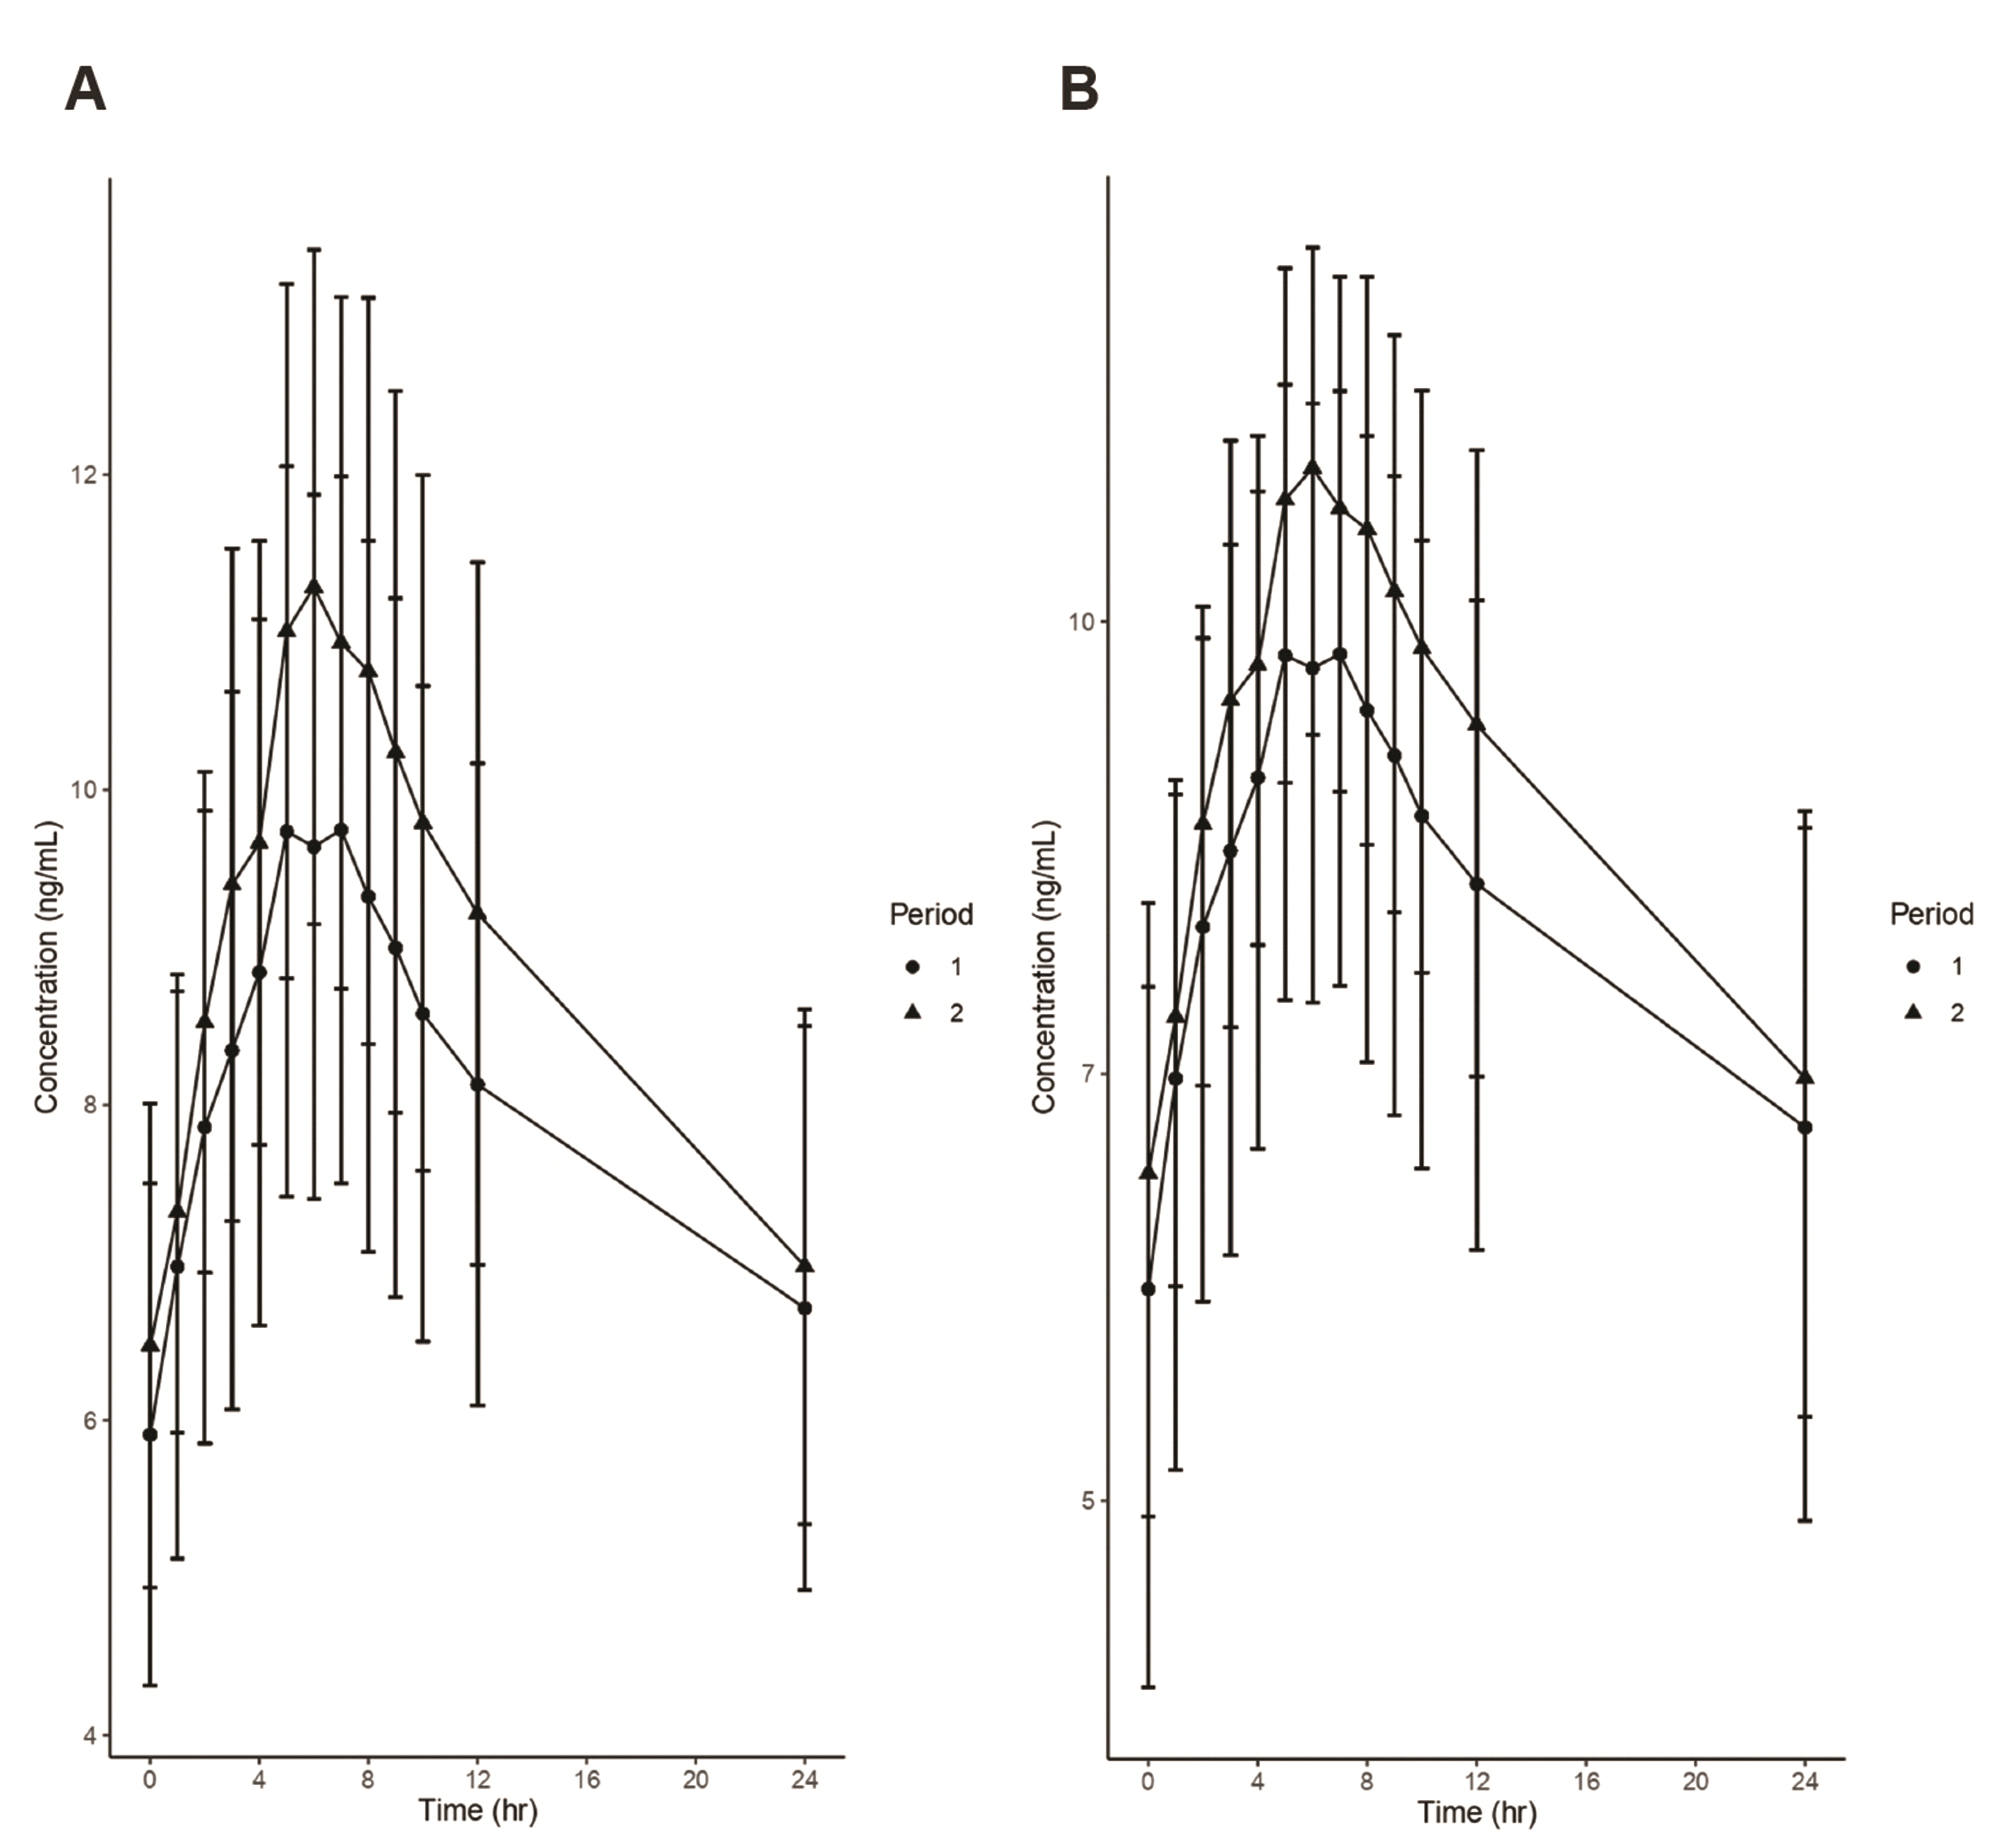
Since it was a single-sequence cross-over study, amlodipine PK data without DDI were obtained during Period 1 (day 0–day 8), and that with possible DDI were obtained during Period 2 (day 9–day 13). A daily 5 mg dose of amlodipine was administered to each subject over the whole study period. Period 1 PK data was generated by a single sample on day 7 (pre-dose) and serial samples on day 8 (at pre-dose, 1, 2, 3, 4, 5, 6, 7, 8, 9, 10, 12, and 24 h after dosing). For Period 2, the same samplings were performed on days 12 and 13. Although the population PK modeling can handle sparse or incomplete full-PK data, only data from subjects who completed the PK sampling schedule (n = 14, 392 observations) were used to minimize the magnitude of possible selection bias.
Overall scheme for DDI evaluation
DDI evaluation was performed in three methods.
1. Conventional approach: NCA and bioequivalence (BE) approach
The maximum plasma concentration observed (
Cmax), the time to reach
Cmax from the last dosing (
tmax), the area under the plasma concentration-time curve during a dosing interval (
AUCτ), and the half-life (
t1/2) were assessed for each period.
NonCompart package (version 0.4.7, by Kyun-Seop Bae, 2020) in R (version 3.6.3; R Foundation for Statistical Computing, Vienna, Austria) was utilized in this procedure. The
AUCτ was calculated according to the linear trapezoidal rule [
10]. The
t1/2 was estimated as the value of 0.693/λ
z, where λ
z is the terminal elimination slope with the best determination coefficient from the linear regression of the last ≥ three observations. An average BE assessment between two periods was performed using the
nlme package (version 3.1-152, by José Pinheiro
et al., 2021) in R. The log-transformed geometric mean ratios of
Cmax and
AUCτ with 90% confidence intervals (CI) were estimated. The DDI presence was assessed by whether the geometric mean ratios of the parameters and their 90% CI fell within the conventional BE range (0.8–1.25) [
11].
2. Partial Model-based approach (MB1)
A simulated PK profile (for the planned time of Period 2) using the PK model built from Period 1 data was compared to the observed PK profiles of Period 2 under the same schema as the NCA and BE approach. For the simulations, the individual PK parameter values were fixed to reflect each subject’s PK characteristics. This procedure was repeated 1,000 times, and the proportion of negative results for DDI was obtained.
3. Full Model-based approach (MB2)
Population PK model was developed using both Period 1 and 2 data, and possible DDI was investigated as the change of each PK parameter as follows:
where Pi,1 is the value of ith PK parameter in Period 1, Pi,2 is the value of ith PK parameter in Period 2, DPi is the quantitative difference between ith PK parameter according to the Period, and PRD is the indicator for Period (0 for Period 1 and 1 for Period 2). No period effect other than DDI was assumed since the actual period effect cannot be assessed in a single-sequence cross-over study.
For comparison, a similar NCA and BE approach was also utilized, and simulated steady-state PK profiles (on day 13) without DDI and with DDI (if it exists) were compared. The simulation was repeated 1,000 times, and the average BE results were summarized.
General procedures for model development
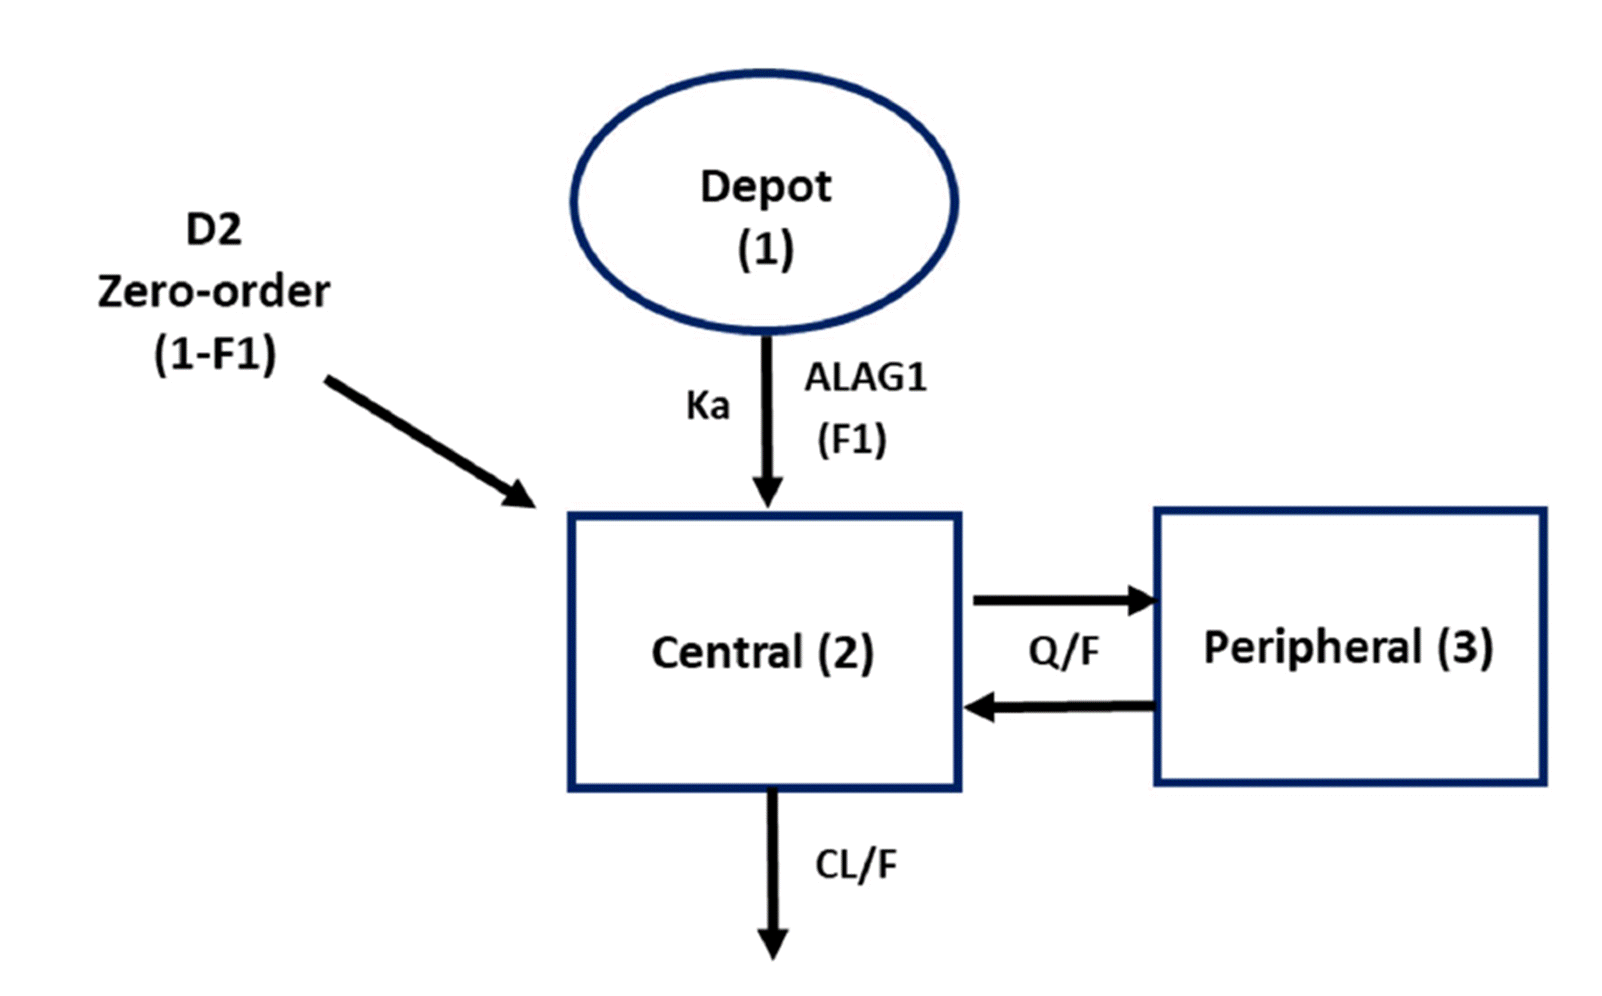
Nonlinear mixed-effects modeling was conducted using NONMEM version 7.4 (Icon Development Solutions, Ellicott City, MD, USA). The model was developed by evaluating different absorption models, adopting a two-compartment model with first-order absorption and first-order elimination initially [
12]. The first-order conditional estimation with interaction (FOCE-I) was employed throughout the process. The most appropriate model selection was based on objective function values (OFV) evaluation, diagnostic plots (goodness-of-fit and individual plot) visual inspection, percent relative standard errors (%RSE), and parameter estimates of population fixed- and random- effects. The model was considered more appropriate if a decrease in the OFV was more than 3.84 (p-value < 0.05,
df = 1) using the likelihood-ratio test. R was used for graphical analysis and model diagnostics.
Inter-individual variability of each parameter was described exponentially as:
Where Pij is the estimated parameter value for the jth individual, θi is the typical value of the ith PK parameter, and ŋ is the between-subject variability (BSV), following a normal distribution ŋ~N(0, ω2). Covariance between inter-individual variability was evaluated for possible correlations. Intra-individual variability (residual error) was tested with either additive, proportional, and combined structures.
General procedures for model evaluation
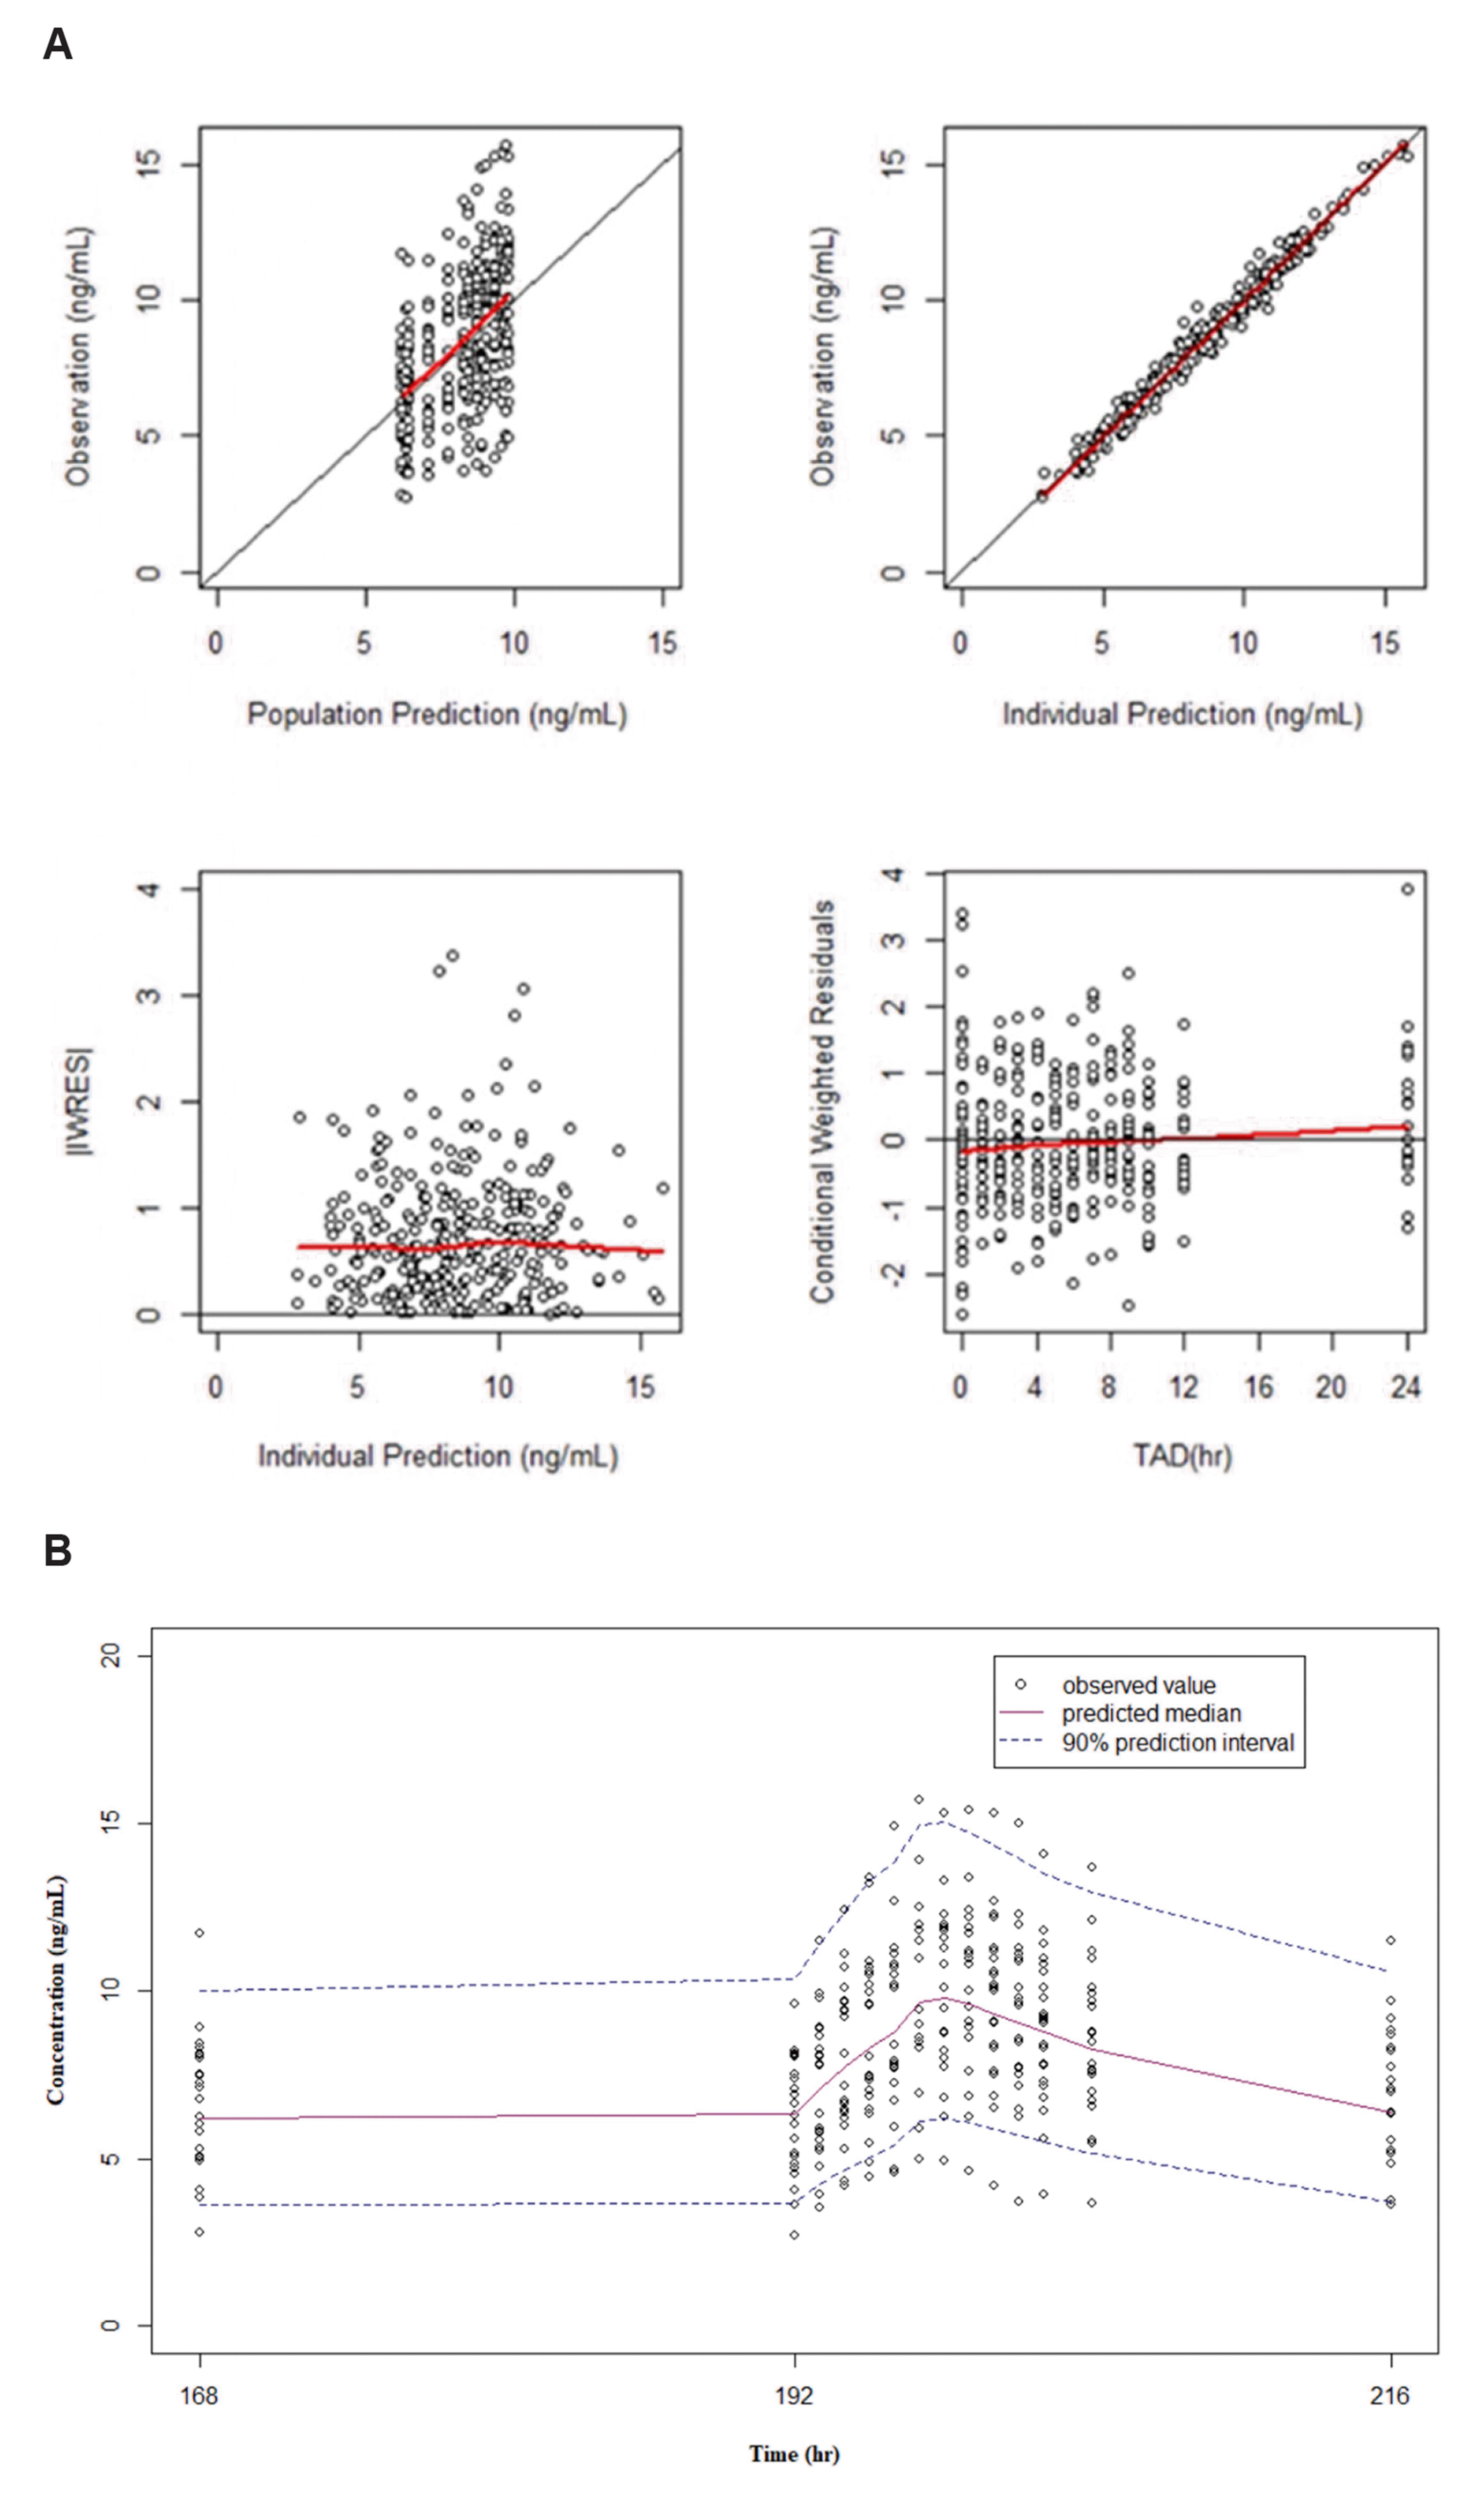
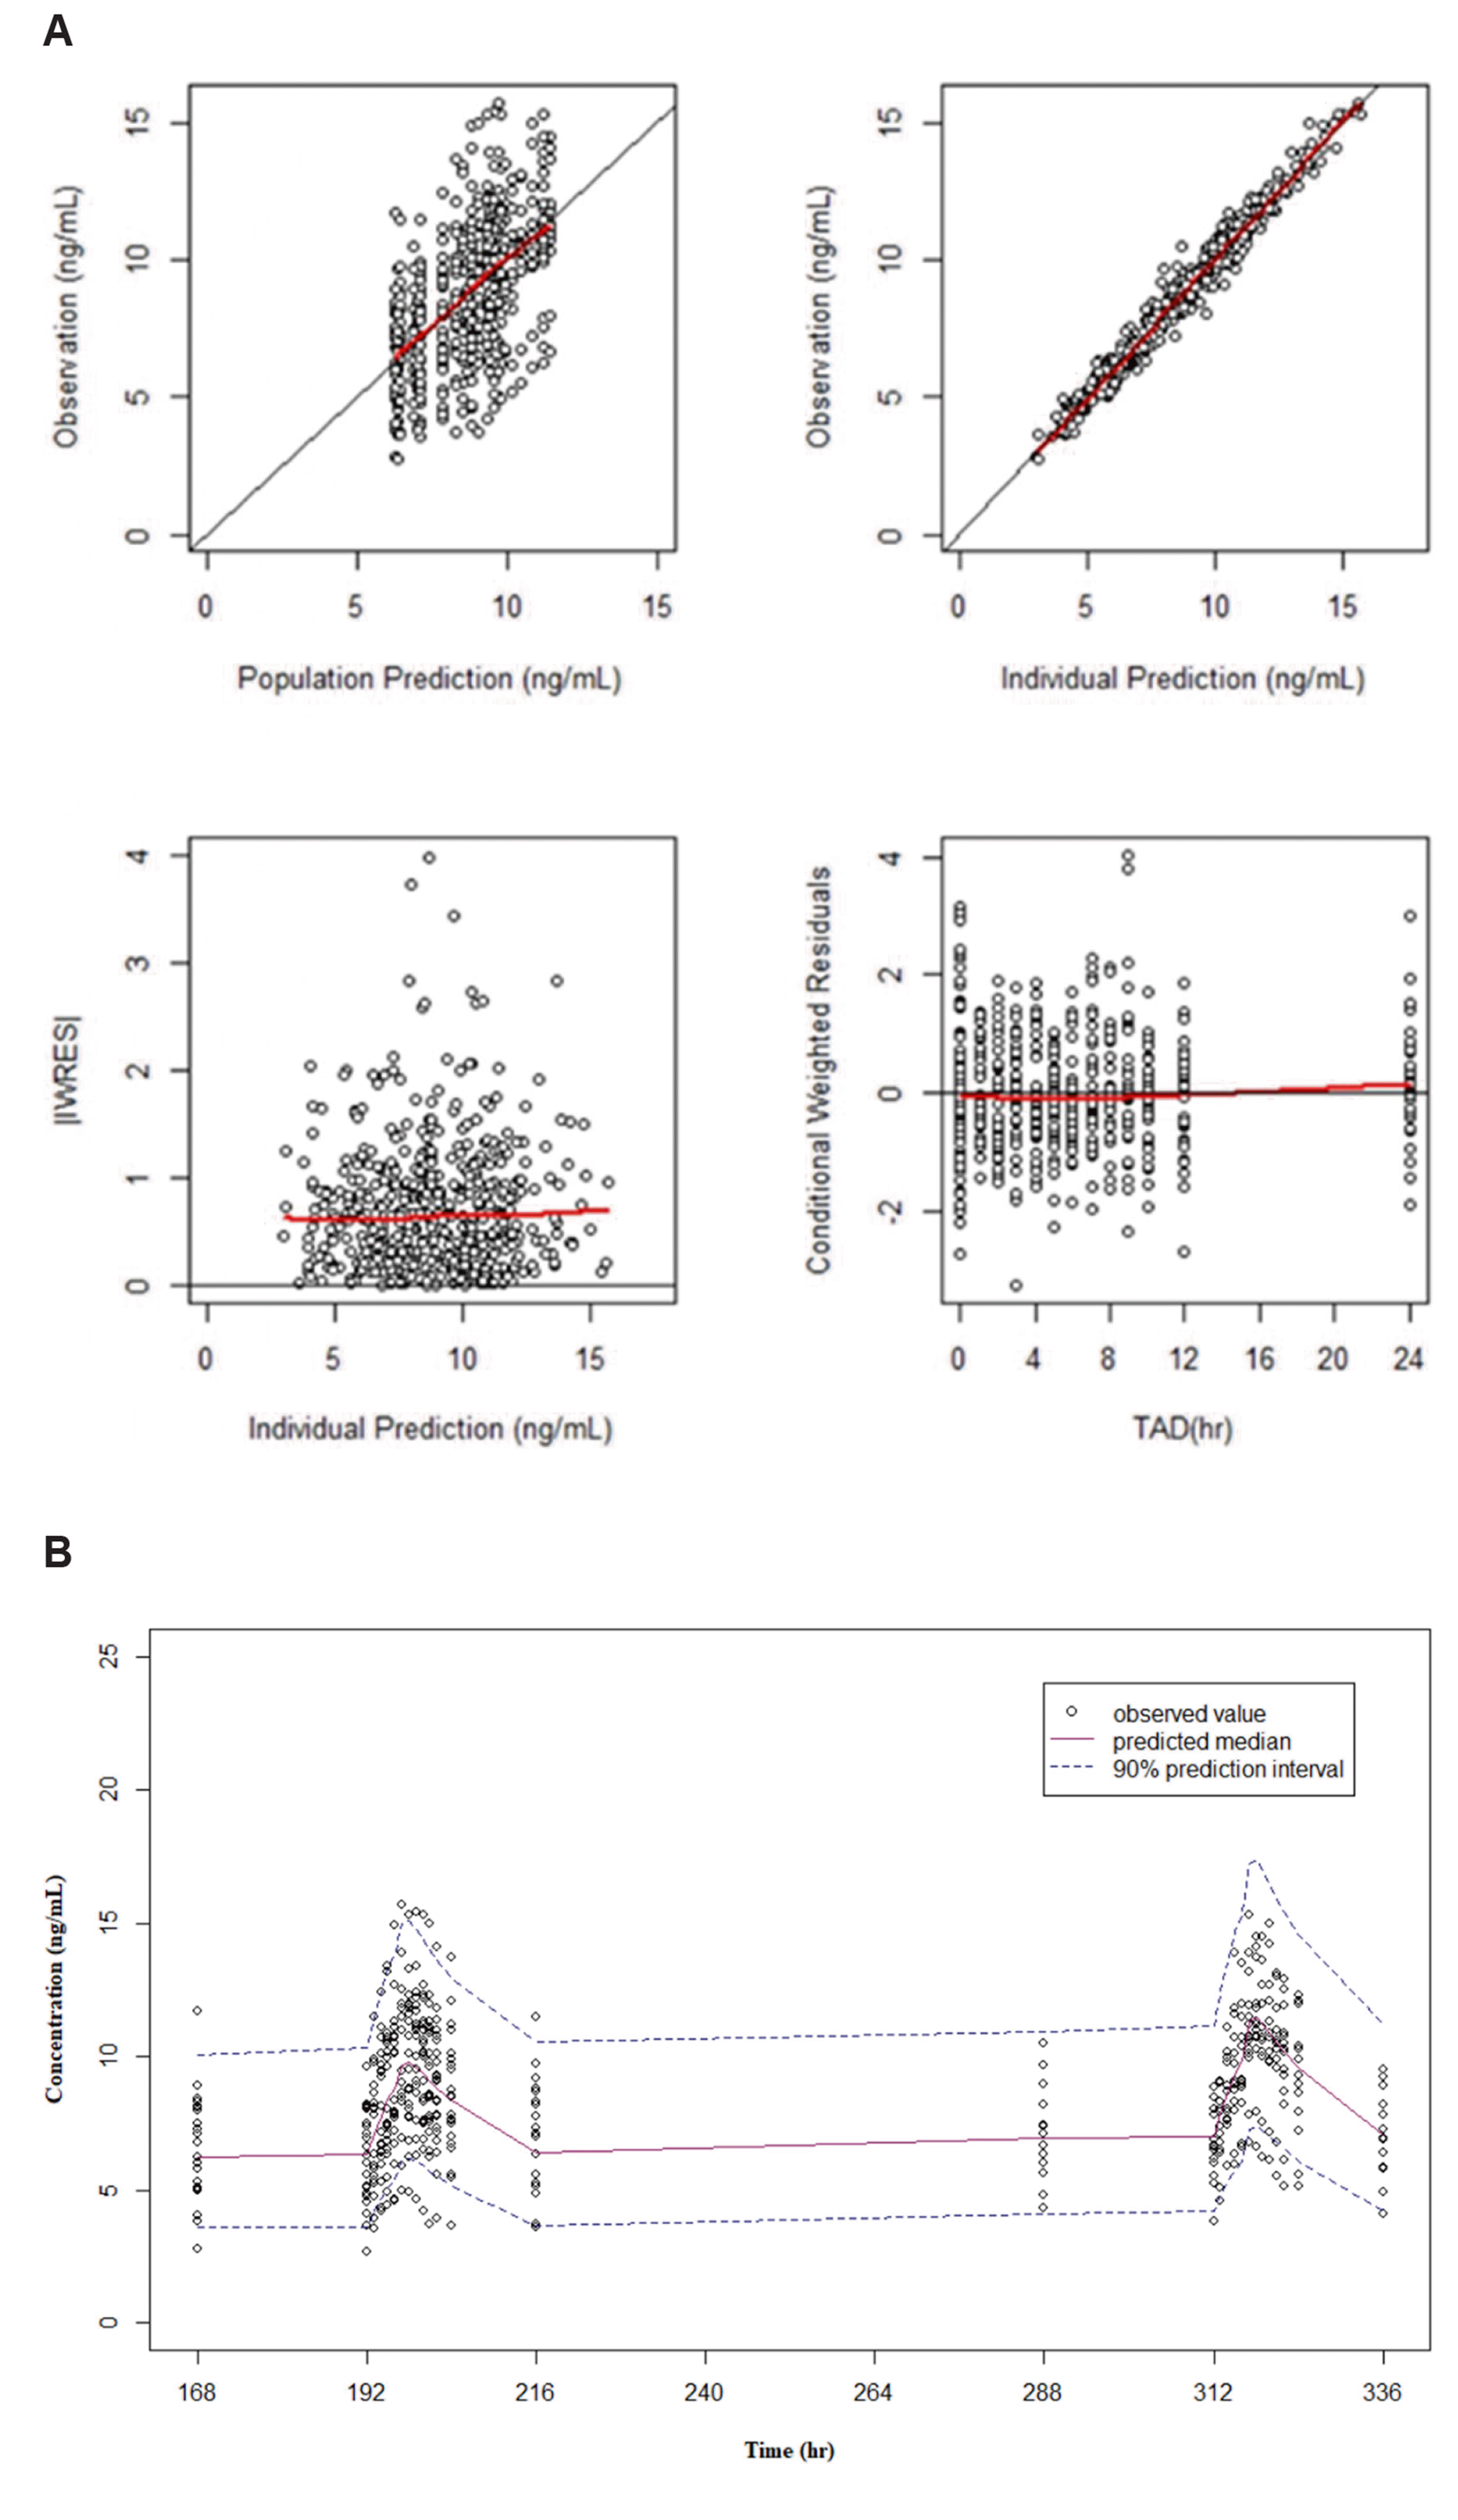
Visual predictive checks (VPCs) were conducted to support model adequacy. The 5th, 50th, and 95th percentiles of the simulated data (n = 1,000 replicates) were plotted, and the observed data were superimposed for visual comparison using R.
Wings for NONMEM (version 741, by Nick Holford, 2017) was used for bootstrap analysis to examine model robustness. One thousand replicates of the original dataset were generated by resampling with replacement, and median values with 95% CIs of parameters were determined to compare with their respective final parameter values.
Go to :
DISCUSSION
In this study, two types of model-based approach methods were assessed for DDI evaluation. Overall, both approaches with simulated data showed similar results using raw data. In all cases, including the conventional approach (NCA & BE),
Cmax increased by about 13.9%–17.7%, and
AUCτ increased by 10.5%–11.9% between periods. However, due to the small intra-subject variability of amlodipine [
13], the PK parameter ratio’s CI was very narrow, satisfying the classical BE limit. There may be some differences in the actual numbers depending on the method used, but such differences do not significantly change the likelihood of clinical DDI occurrence. Therefore, confidently all approaches properly evaluated the degree of DDI occurrence.
A model-based approach can have several advantages over the conventional method, which uses raw data only. For drugs with a long half-life, the possibility of DDI overestimation due to changes in concentration associated with reaching steady-state may be reduced; this was confirmed by comparing the results of the conventional approach and MB1. The conventional approach showed a larger ratio of PK parameters (
Cmax and
AUCτ) than MB1 because the simulated data corresponding to Period 2 in MB1 reflected the steady-state concentration. At the time of study design, repeated administration is performed for a predicted period of steady-state achievement based on a known half-life. However, there is an uncertainty that the half-life may be longer than known in the subject population, and a long-term administration may be difficult to overcome this uncertainty for drugs with a long half-life [
14]. Therefore, when evaluating clinical DDI with these drugs, using MB1 in addition to the conventional method may be sufficient to determine whether or not the DDI is overestimated in situations where steady-state is not achieved.
In the case of MB2, information on the change of each parameter was obtained from estimating model parameters that optimally described each period by using data from both periods. Although the role of the conventional approach and MB2 may be similar in that the overall
Cmax and
AUCτ show an increased pattern, the conventional approach has a limitation where it cannot be ascertained what mechanism is responsible for the change in the PK parameter [
5,
9]. According to the modeling results, it is highly likely that the increase in
Cmax was based on the increase in bioavailability (
BIO), indicating that the absorption of the drug in Period 2 increased by 30.0% compared to Period 1. However, the actual increase in
Cmax and
AUCτ was not more significant than this because the increase in bioavailability was offset to some extent by 15.3% increased clearance (
CL change); this is illustrated in
Fig. 1, where Period 2’s terminal slope of elimination is larger than that of Period 1.
The model-based approach is valuable because it provides additional information while helping to overcome limitations in clinical trial design. First, it is possible to predict Cmax and AUCτ without simulation through model parameter changes in two periods. Using AUCτ as an example, the following calculation can be performed. Using the parameter estimates of BIO and CL from the model, AUC was calculated by the equations below:
Assuming the same dose (DOSE) was given, the relative exposure was described by:
The point estimate was 1.124, and the 90% confidence interval was 1.089–1.154, similar to the results above. Second, precise changes in parameters provide an opportunity to assess whether such trends in DDI can be explained by the known effects of concomitant drugs on drug transporters or metabolic enzymes [
15]. Finally, this approach provides a confidence limit in addition to the point estimate; this can be used as an indicator of the likelihood that the same results can be derived during repeated simulations [
9]. The result confirmed that the 90% CI remained within 0.8–1.25, and accordingly, all met the classical BE limit.
Model-based comparative PK evaluations are not yet widely used, and results have not been published in many cases. In this study, several advantages of the model-based approach were demonstrated, and possible application methods were proposed.
With similar experiences accumulated from comparative PK studies on drugs of various characteristics, it is expected that the advantages of the model-based approach compared to the classical method can be appropriately utilized according to the situation and purpose.
Go to :


 PDF
PDF Citation
 Print
Print


 XML Download