Abstract
The present study aims to investigate the impact of hydrogen-rich water on the lactic acid level in metformin-treated diabetic rats under hypoxia. Thirty Sprague-Dawley rats were randomly divided into five groups, including normal diet group, and diabetes model (DM) group, DM + metformin treatment (DMM) group, DMM + hypoxia treatment (DMMH) group and DMMH + hydrogen-rich water (DMMHR) group. We found that the levels of lactic acid, pyruvate and lactate dehydrogenase were significantly lower in the blood of DMMHR group than DMMH group. Superoxide dismutase and glutathione levels in liver and heart were significantly higher in DMMH group after hydrogen-rich water treatment, while malondialdehyde and oxidized glutathione levels were decreased in DMMHR group when compared with DMMH group, which indicates that hydrogen-rich water could reduce oxidative stress. qPCR analysis demonstrated that that pro-apoptotic genes Bax/Caspase-3 were upregulated in DM group and metformin treatment suppressed their upregulation (DMM group). However, hypoxic condition reversed the effect of metformin on apoptotic gene expression, and hydrogen-rich water showed little effect on these genes under hypoxia. HE staining showed that hydrogen-rich water prevented myocardial fiber damages under hypoxia. In summary, we conclude that hydrogen-rich water could prevent lactate accumulation and reduce oxidant stress in diabetic rat model to prevent hypoxia-induced damages. It could be served as a potential agent for diabetes patients with metformin treatment to prevent lactic acidosis and reduce myocardial damages under hypoxic conditions.
Type II diabetes is a chronic metabolic disease associated with high cardiovascular risk [1]. It can lead to increased oxidative stress, inflammatory response, abnormal energy metabolism and apoptosis in myocardial cells [2]. Metformin is an oral hypoglycemic drug for type II diabetes. Statistics show that more than 150 million diabetic patients worldwide take metformin every year [3] and accumulating clinical evidence shows beneficial effect of metformin on type II diabetes drug [4]. The main hypoglycemic mechanism of metformin is to reduce the fasting blood glucose by directly inhibiting hepatic gluconeogenesis, and increasing the uptake and catabolism of glucose in peripheral tissues to maintain blood glucose [5]. The most common side effect of metformin is digestive tract reaction. However, long-term usage of metformin leads to the development of tolerance against the gastrointestinal tract reaction [6]. Lactic acidosis is another serious adverse side effect related to the use of metformin [7]. Studies have shown that careful administration of metformin can minimize the incidence of lactic acidosis [8]. However, in patients under certain conditions, such as cardiac insufficiency, renal insufficiency, hypoxia state, advanced age and application of contrast agent, the usage of metformin frequently exacerbates lactic acidosis by increasing blood lactic acid (LA) level [9]. It is also reported that lactic acidosis incidence for diabetes patients taking metformin in high altitude area is higher than those in flat area (17.65% vs. 2.50%), indicting an impact of hypoxia on the adverse effect of metformin usage. The treatment effect of metformin seems also impaired in high altitude area [9]. Therefore, new strategy is needed to ameliorate the lactic acidosis symptom and enhance the treatment outcome for diabetes patients under hypoxia.
Hydrogen gas has long been considered as a physiological inert gas. Reccent studies have revealed multiple beneficial functions in physiology of hydrogen gas, especially in coping with oxidative stress [8,10-12]. Hydrogen gas has wide potentials in clinical application due to its low toxicity, effective antioxidant effect and simplicity of administration. Clinical research shows that diabetes is associated with oxidative stress, and the supplement of the hydrogen-rich water is conducive to glucose homeostasis, protecting cells against oxidative damage and delaying the progression of type II diabetes [13]. In addition, Aoki et al. [14] also reported that hydrogen-rich water intake before exercise could reduce adverse reactions such as elevated blood LA level caused by oxidative stress during exercise. However, weather hydrogen-rich water could reduce LA accumulation in diabetes subjects taking metformin under hypoxia remains to be investigated.
In this study, we established a diabetic rat model and explored the potential protective effect of hydrogen-rich water on LA accumulation, oxidative stress and cardiac damage when metformin was administrated under hypoxia. Diabetic rat model was established by feeding high-fat/high-sucrose diet (HFSD) together with streptozotocin (STZ). The hypoxic condition was induced by isopropyl epinephrine. The serum metabolites and oxidative stress parameter were measured, including LA pyruvate (PA), lactate dehydrogenase (LDH), superoxide dismutase (SOD), malondialdehyde (MDA), reduced glutathione (GSH) and oxidized glutathione (GSSG). Our data demonstrated that hydrogen-rich water inhibited lactate accumulation and reduced oxidant stress in diabetic rat model to prevent hypoxia-induced damages. Therefore, hydrogen-rich water has the potential to prevent the side effect of metformin treatment in diabetic condition under hypoxia.
Metformin was purchased from Sino-American Shanghai Squibb Pharmacertical Co., Ltd. (Shanghai, China). STZ was purchased from Guangzhou saiguo biotech Co., Ltd. (Guangzhou, China). Citric acid and sodium citrate were obtained from Sinopharm Chemical Reagent Co., Ltd. (Shanghai, China). Isoproterenol (ISO) was purchased from Hefei BASF Biotechnology Co., Ltd. (Hefei, China). HFSD and normal diet (ND) were obtained from Jiangsu Xietong Biological Engineering Co., Ltd. (Nanjing, China). The hydrogen-rich water was prepared using a Nanobubble machine (Shanghai nanobubble nanotechnology Co., Ltd., Shanghai, China). LA, PA, LDH, SOD, MDA, GSH, and GSSG measurement kit were purchased from Nanjing Jiancheng Bioengineering Institute (Nanjing, China).
SPF-grade male Sprague-Dawley (SD) rats weighting 160 ± 10 g were fed in the animal room with temperature of 23 ± 2°C and humidity of (60 ± 5) %. The room was equipped with good ventilation with a light and dark cycle of 12 h. All the animal experiments were carried out according the National Institutes of Health guide for the care and use of Laboratory animals, and were approved by the Animal Use ethic Committee of The Sixth Medical Center of Chinese PLA General Hospital.
SD rats were randomly divided into two groups including a normal group and diabetes-inducing groups. Normal group was fed with normal diet (ND group) and the diabetes model group was fed with HFSD (DM group). The ingredient of HFSD comprised of saccharose (10%), lard oil (10%), cholesterol (5%) and basal diet (75%). After 6 weeks, rats in the disease model group were treated with 1% STZ (dissolving in citric acid-sodium citrate buffer, pH 4.21) by intraperitoneal injection at a dose of 30 mg/kg to induce diabetes. All the rats were fed for another 7 days. The fasting blood-glucose was monitored using a glucometer (Beijing Yicheng Bio-electronic Technology Co., Ltd., Beijing, China).
Rats in diabetes model (DM) group were randomly divided into 4 subgroups, and the treatment conditions were were summarized in Table 1. Briefly, the ND group and DM group were administrated with saline for 4 weeks. DM + metformin (DMM) group was administered intragastrically with metformin solution at a dosage of 100 mg/kg for 4 weeks. DMM + hypoxia (DMMH) group was subcutaneously infected with ISO (isopropyl epinephrine) for another two days at a dosage of 10 mg/kg after administrated with metformin for 4 weeks. DMMH + hydrogen-rich water (DMMHR) group was processed by administrated with metformin and hydrogen-rich water for 4 weeks and followed by ISO (isopropyl epinephrine) administration. The hydrogen-rich water was administrated at a dosage of 5 mg/kg. Six rats were included in each group and the blood sample was collected after treatment. Rats were sacrificed and the heart and liver were isolated for Hematoxylin-eosin (H&E) staining.
Blood samples were taken from the aorta abdominalis after the rats were anesthetized using 10% chloral hydrate solution. The serum samples were collected after centrifugation at 1,500 ×g for 10 min. The levels of LA, PA and LDH were measured using the commercially available test kits mentioned above in the materials. Heart and liver tissues were rinsed with cold saline. Then, the samples were snap-frozen in liquid nitrogen and ground into powder using a pestle. The levels of SOD, MDA, GSH and GSSG were determined using the corresponding test kits.
Total RNA was extracted from the heart and liver tissues using a RNeasy Mini kit (QIAGEN, Dusseldorf, Germany). cDNA synthesis was performed using a RevertAid First Strand cDNA synthesis kit (Thermo K1622; Thermo Fisher Scientific, Shanghai, China). Fast SYBR Green Master Mix (Applied Biosystems, Foster City, CA, USA) was used for real-time qPCR analysis on an ABI-7500 real-time PCR machine (Applied Biosystems, Waltham, USA). Gene expression levels were normalized to glyceraldehyde 3-phosphate dehydrogenase using a relative quantification method (2−ΔΔCt). The primers sequences for qPCR analysis are shown in Table 2.
The histopathological study of heart tissues in different experimental groups was evaluated using H&E staining method. First, the harvested heart tissues were fixed in 4% paraformaldelyde for 2 h. Then, the samples were dehydrated and embedded in paraffin for 24 h. After sectioning, the heart slices were stained with H&E staining kit (ab245880; Abcam, Cambridge, MA, USA). Pathological changes in the tissues were observed under an OLYMPUS IX71 microscope (Olympus Corporation, Tokyo, Japan).
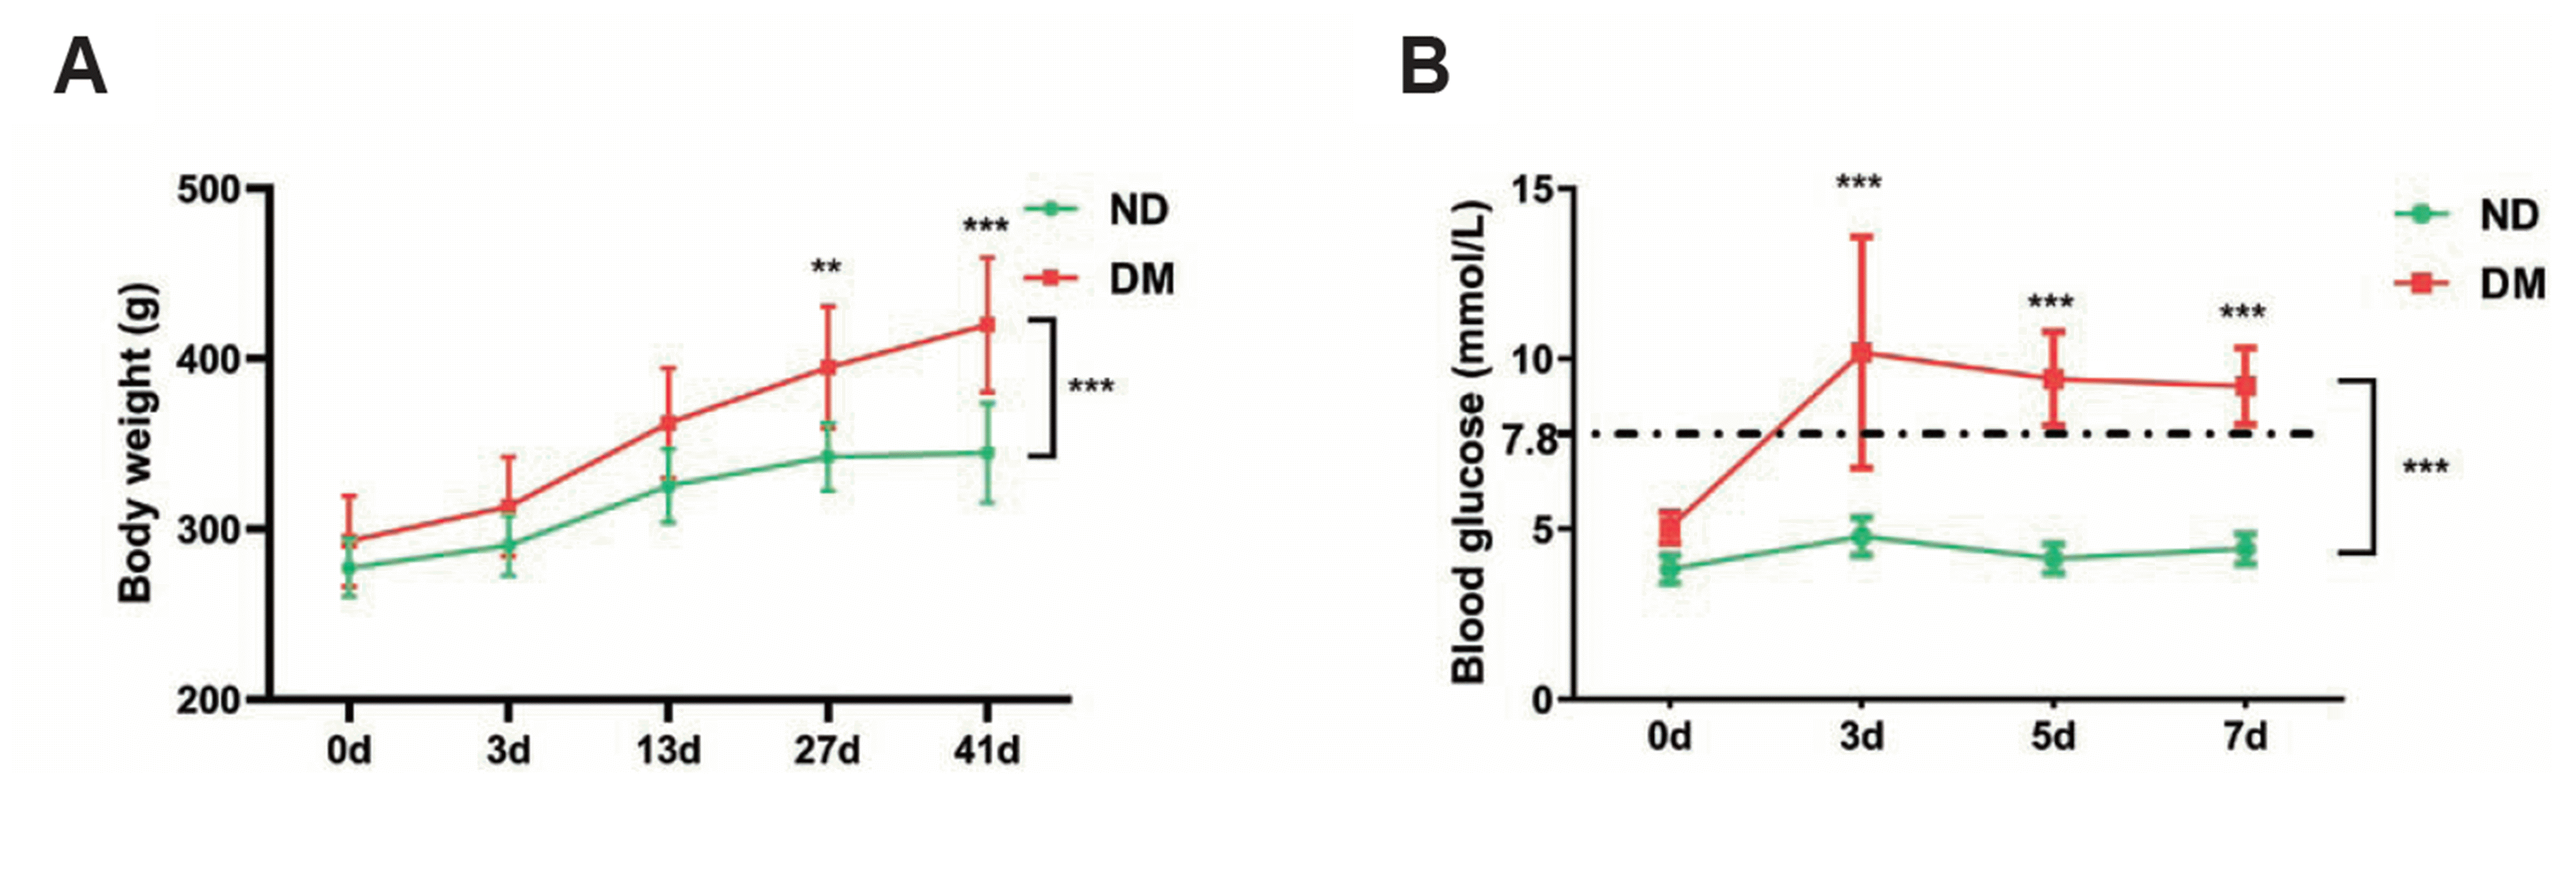
In this study, the rats were fed with normal diet (ND group) and HFSD (DM group) respectively. The body weight was monitored during 41 days. As shown in Fig. 1A, the body weight of rats in DM group increased to a higher level than the ND group, especially at later stage on day 27 and day 41. In addition, blood-glucose results showed that a sharp increase of blood glucose level in the DM group on day 3, and the glucose level remained higher than the ND group for the following days (Fig. 1B).
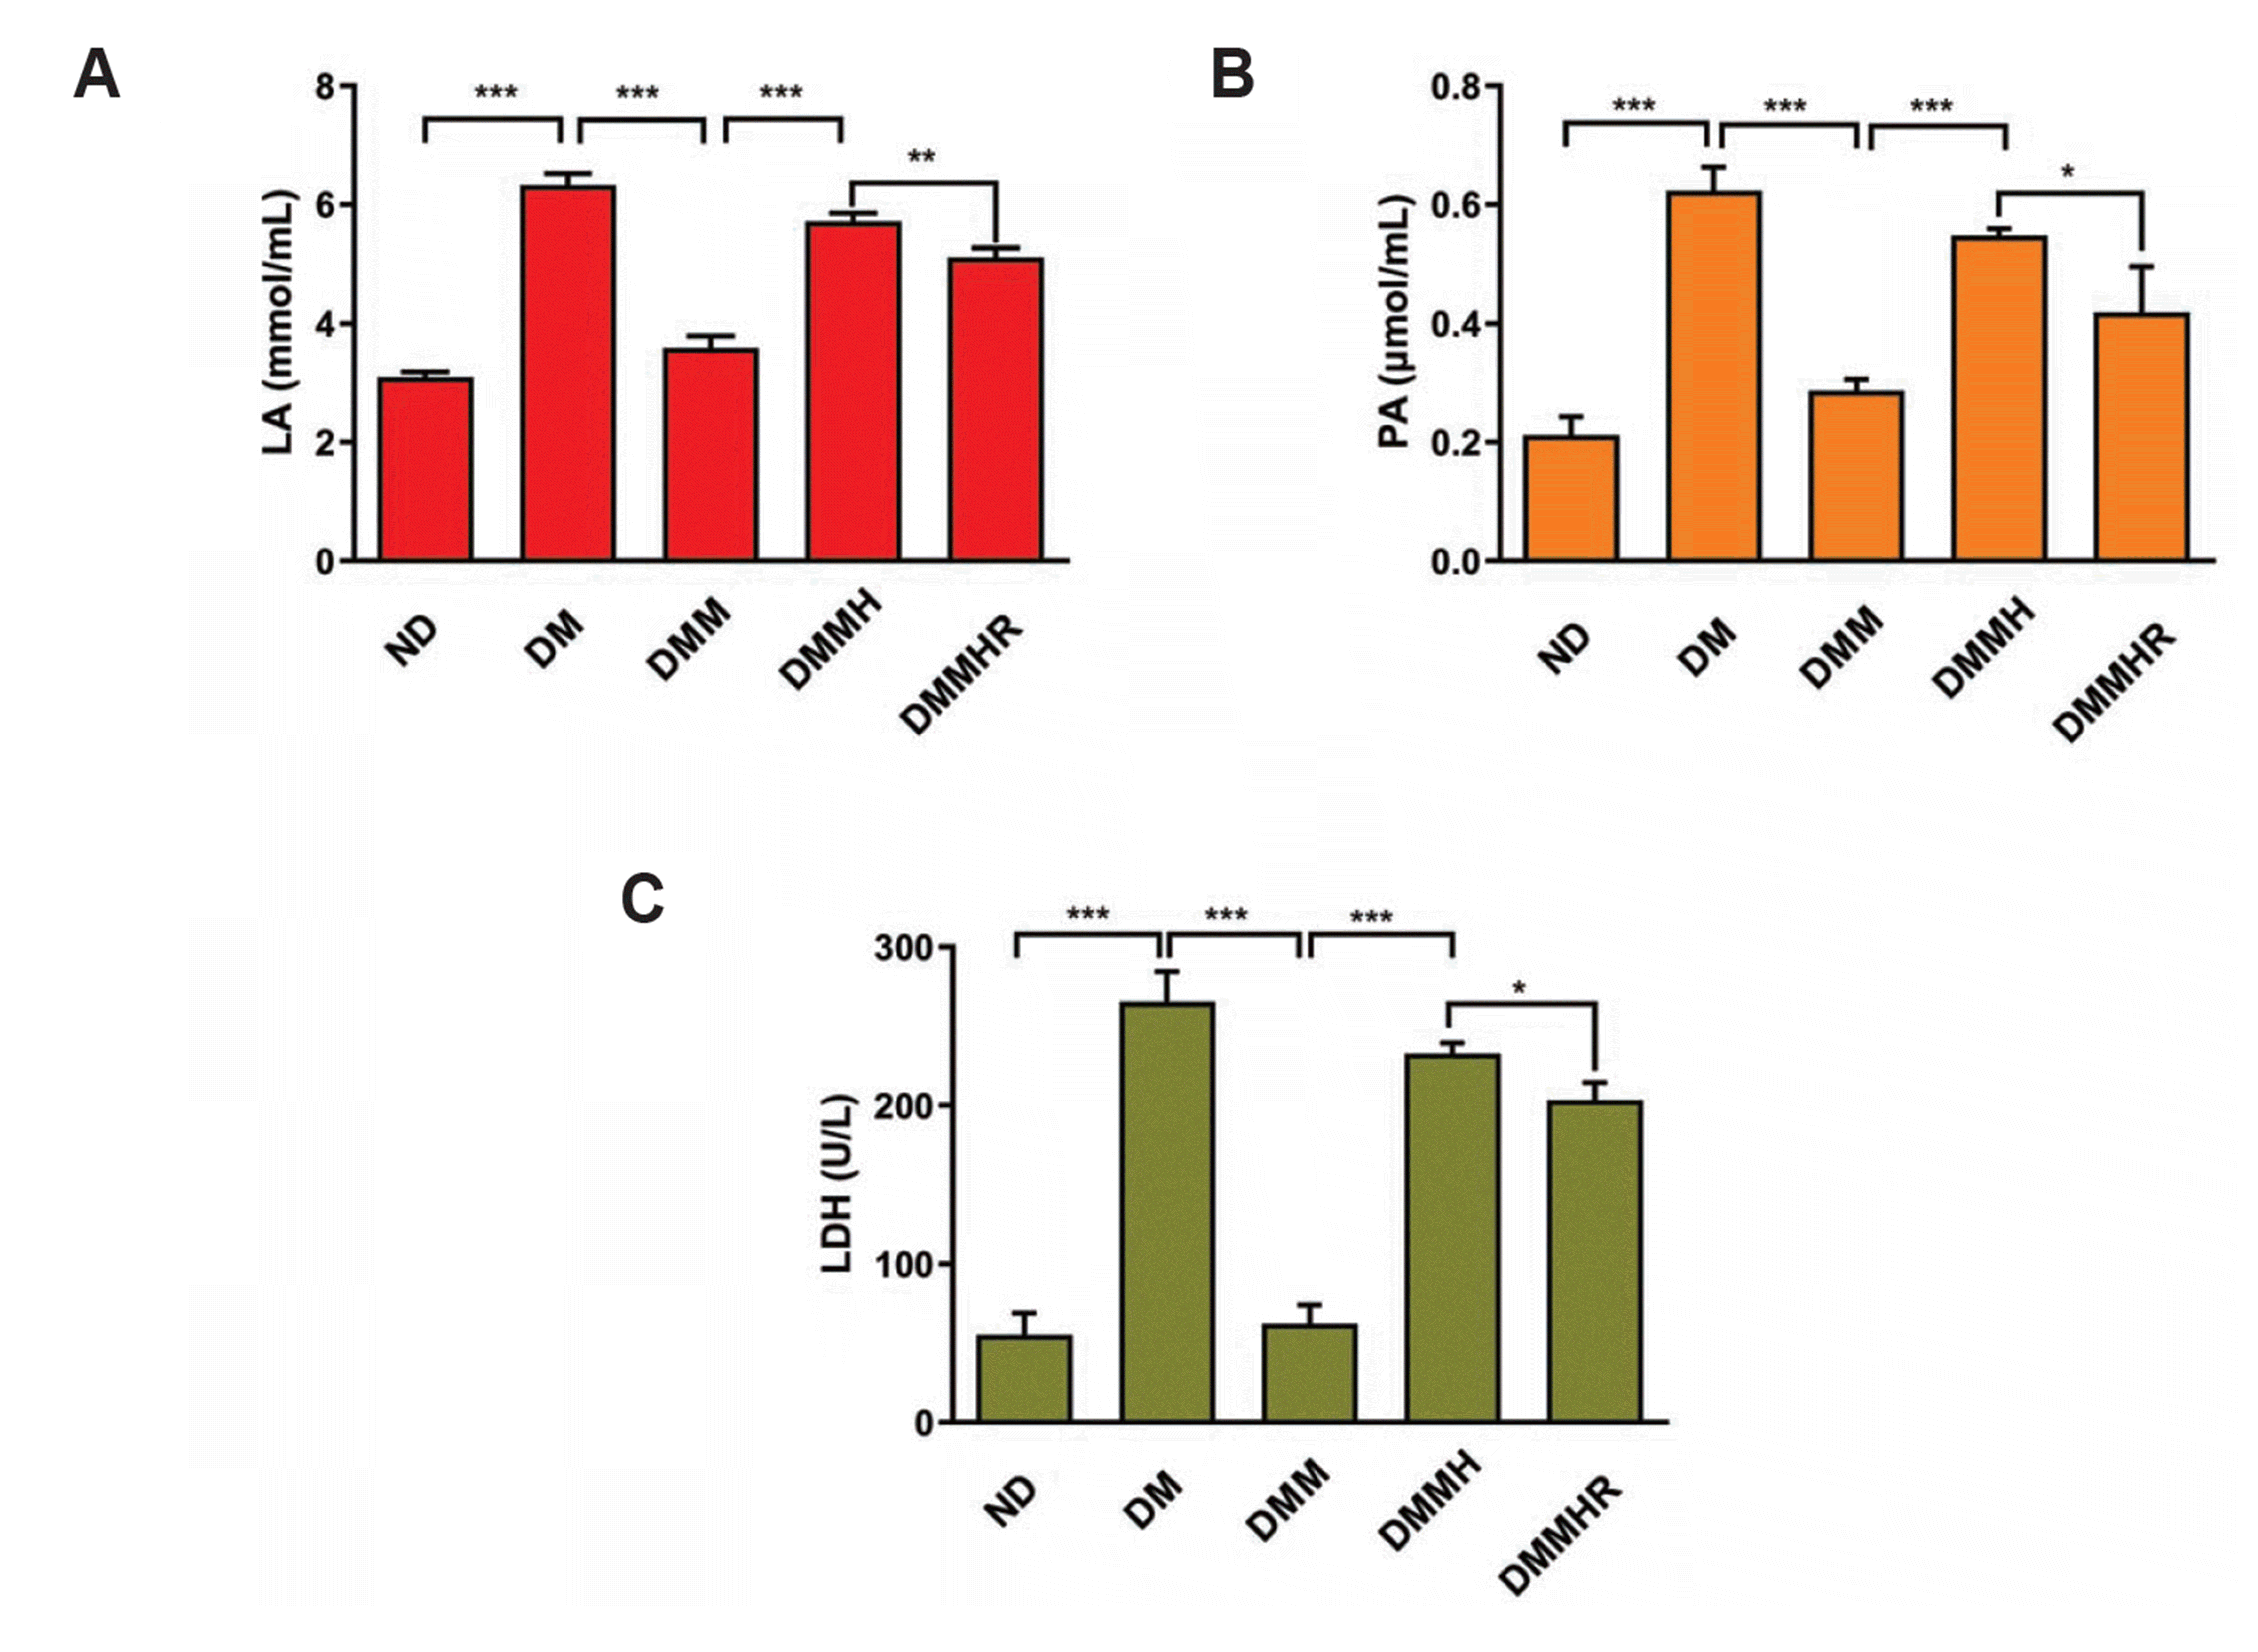
The mice were then divided into five groups: ND (normal diet) group with saline, diabetes model (DM) with saline, DM + metformin (DMM) group, DMM + hypoxia (DMMH) and DMMH + hydrogen-rich water (DMMHR) group. We then performed biochemical analysis to evaluate the blood levels of LA, PA and LDH after different treatments. As shown in Fig. 2, the diabetic induction in DM group increased LA, PA and LDH level when compared to ND group. After metformin administration, LA, PA and LDH levels in DMM group significantly decreased to a similar level as ND group (Fig. 2). With hypoxia induction, LA, PA and LDH levels in DMMH group increased even with metformin treatment. When hydrogen-rich water administration, LA, PA and LDH levels in DMMHR group were significantly lower than DMMH group. However, LA, PA and LDH levels in DMMHR group were still higher than DMM group (Fig. 2).
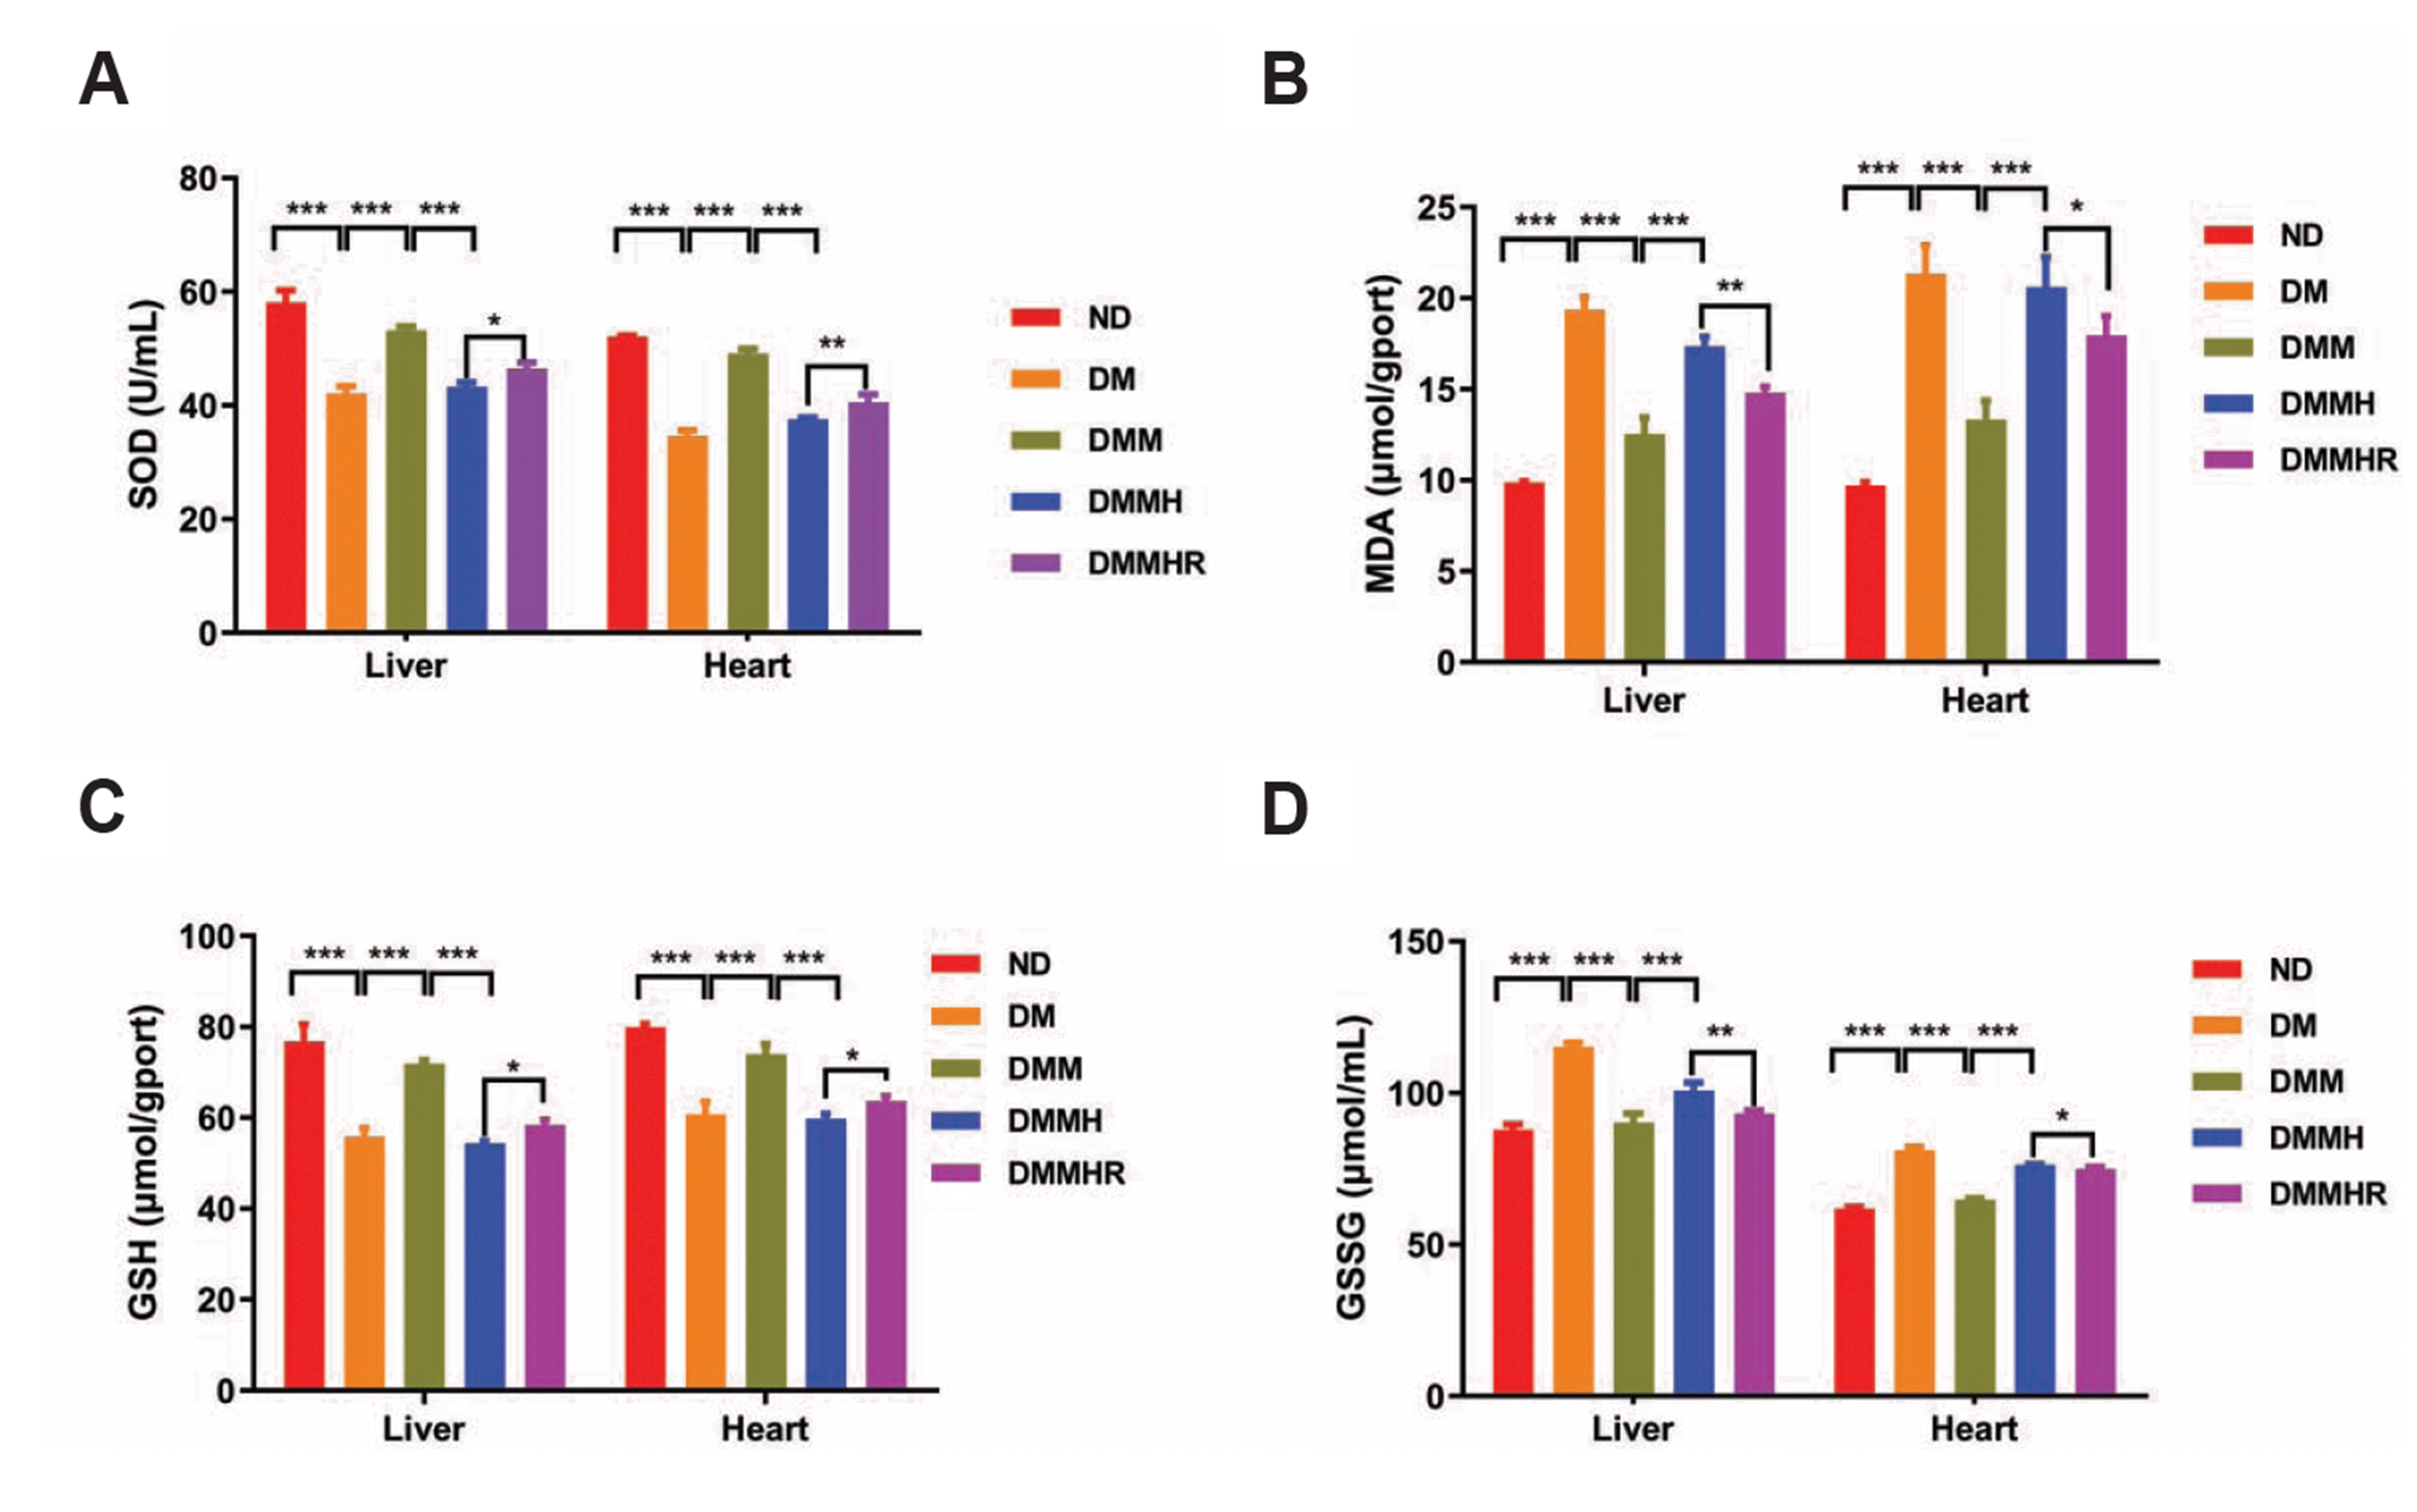
Hydrogen has been reported to be a potential gas agent against oxidative stress [10-12]. Thus, we evaluated the levels of SOD, MDA, GSH and GSSG in the liver and heart. As shown in Fig. 3, DM group showed a lower level of SOD and GSH and a higher-level MDA and GSSG than ND group. In DMM group, metformin significantly reversed the oxidative stress (Fig. 3).
We next attempted to investigate the expression level changes of apoptotic genes in heart and liver tissues of different groups. Our data shows that in both tissues, the pro-apoptotic genes Bax and Caspase-3 showed an increase in DM group than ND group, while anti-apoptotic gene Bcl-2 was expressed at a lower level in DM group than ND group (Fig. 4). After the intervention of metformin, Bax and Caspase-3 expression level was reduced to a level similar to ND group and the Bcl-2 level was significantly increased. However, with hypoxia induction in DMMH group, the effect of metformin was abrogated (Fig. 4).
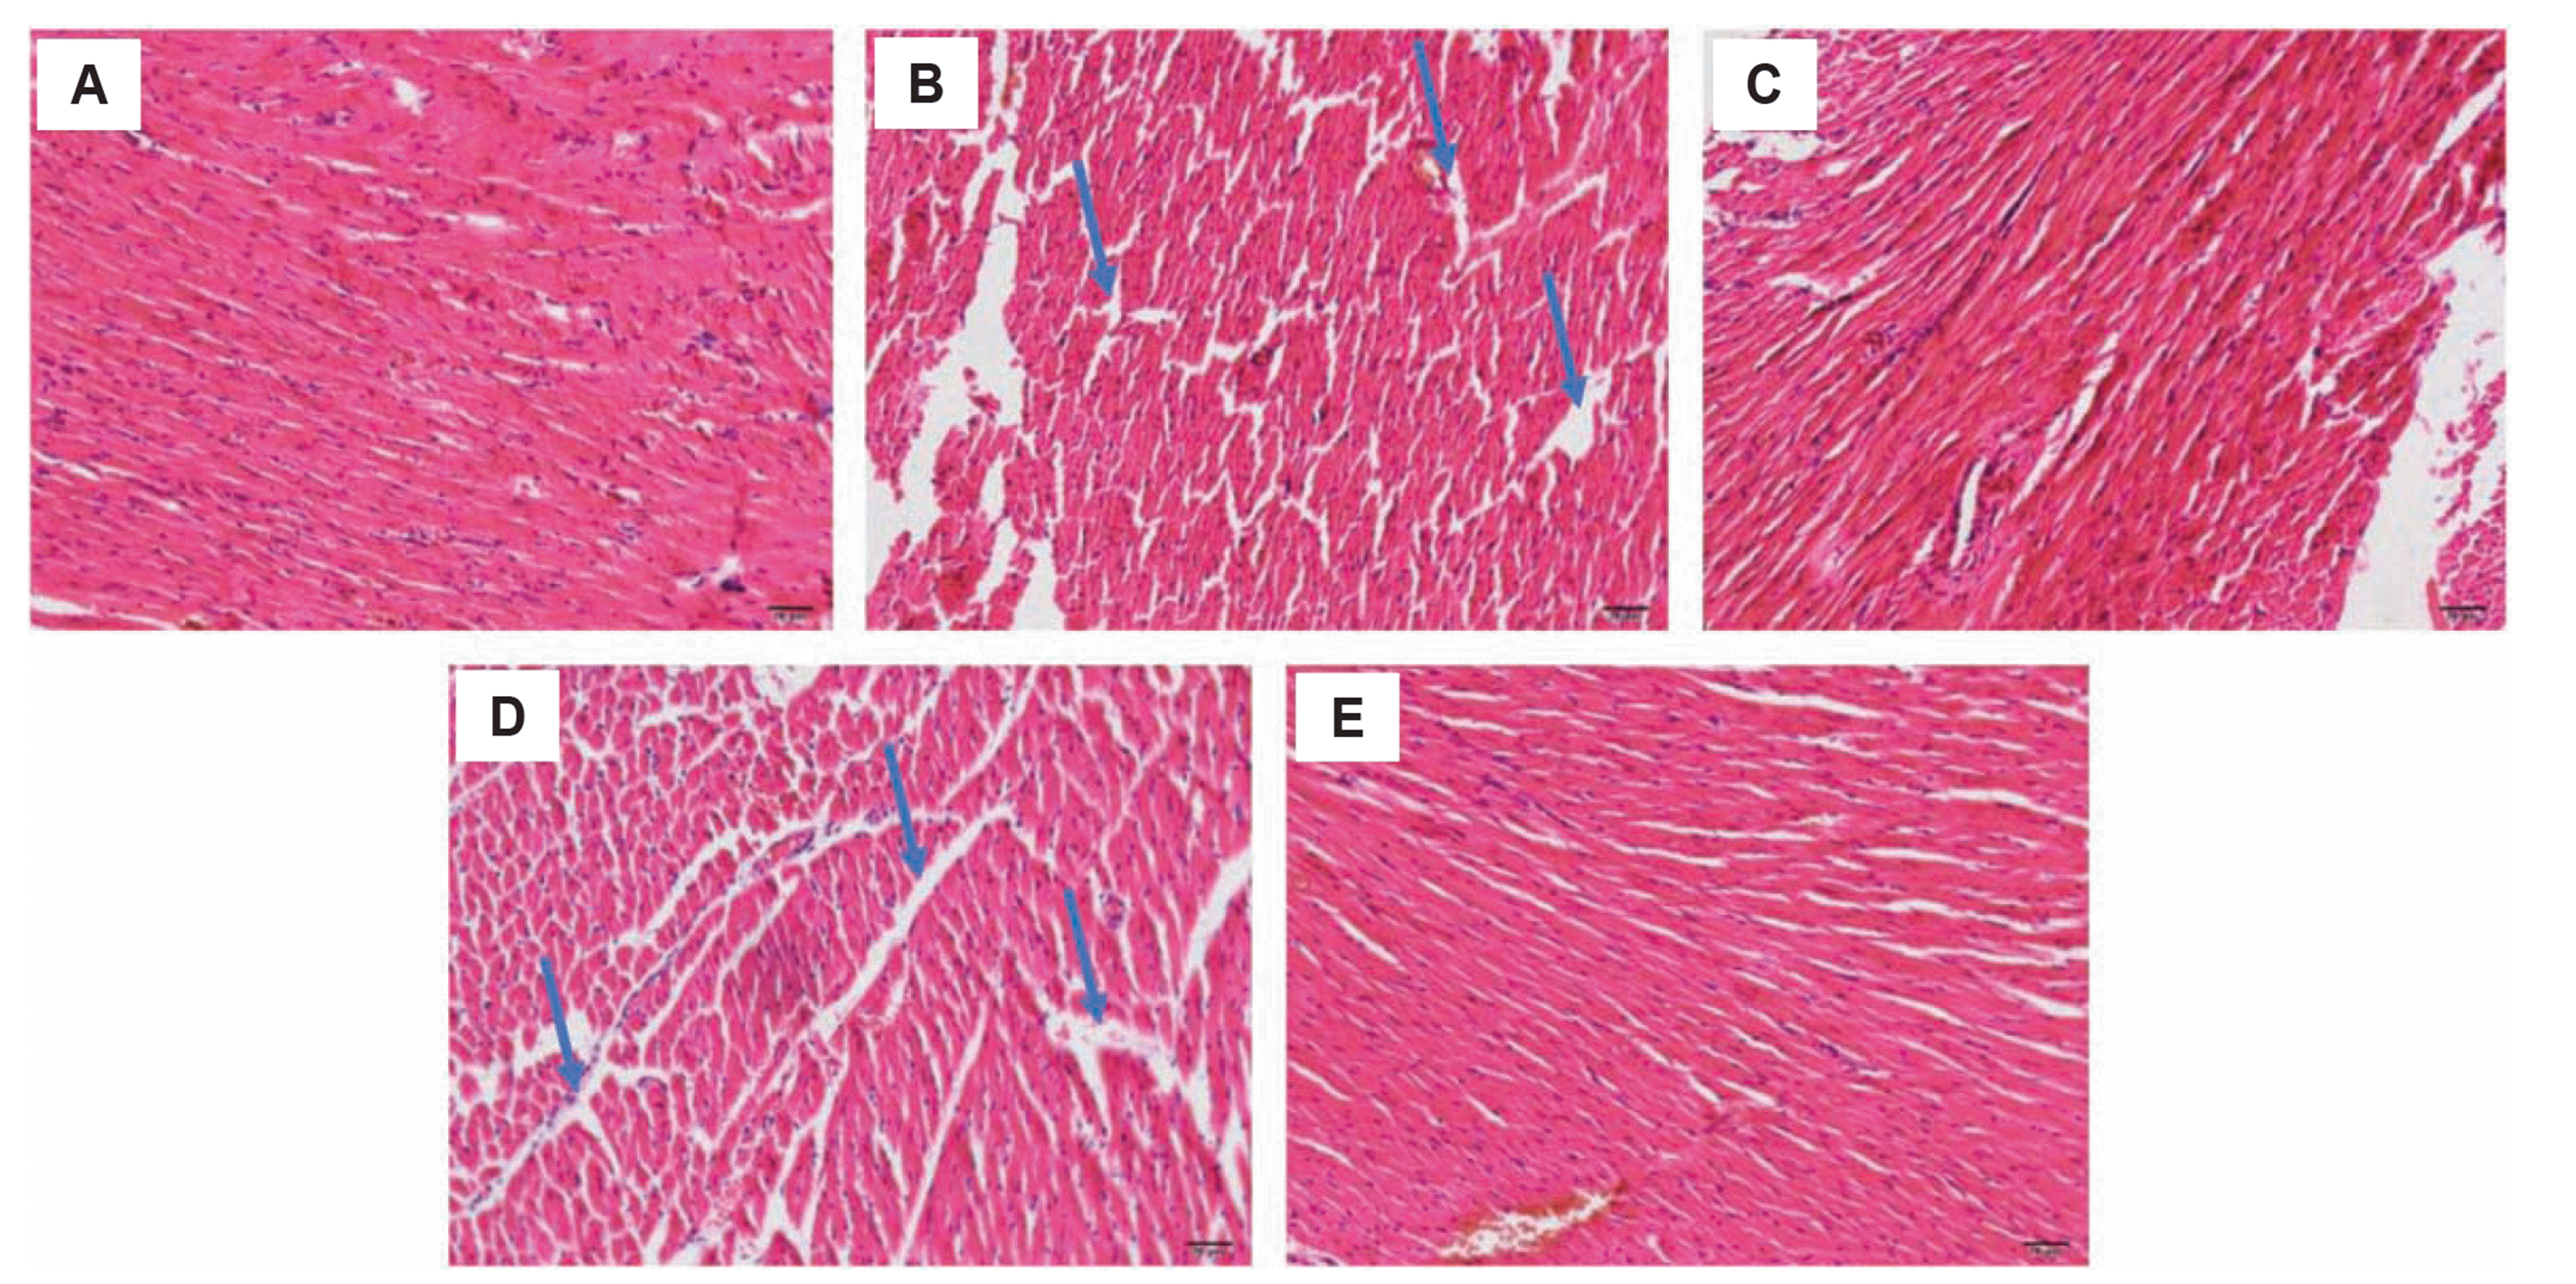
To analyze the pathological changes in the myocardia tissues induced by different conditions w performed H&E staining in the heart tissues. As shown in Fig. 5, the ND group (Fig. 5A) displayed tightly arranged myocardial cells, with intact intima and tunica adventitia. The heart tissue from diabetes rats (Fig. 5B, DM group, see arrows) showed loose arrays of myocardial cells with myocadiac fiber and partial damage of the intima. The treatment of metformin restored the tightly arranged myocardial fibers (Fig. 5C, DMM group). However, the hypoxic condition (Fig. 5D, DMMH group), even though the rats were treated with metformin, myocadiac fiber damages were still observed. The administration of hydrogen-rich water in DMMHR group protected the myocadiac fiber damages induced by hypoxia (Fig. 5E, DMMHR group).
STZ, a DNA alkylation reagent which is destructive to pancreatic β cells, is widely used to induce diabetes in many animals [15]. In this study, the fasting blood glucose level was monitored for 7 days after STZ administration and we observed a sharp increase of blood glucose level in the DM group, indicating that diabetes was successfully induced in the DM group.
LA is an intermediate metabolite of glycolysis. It is generated from PA under the catalysis of lactate dehydrogenase under hypoxic condition. Diabetes induction can lead to microvascular lesions, which may result in tissue hypoxia and the increase of LA [16]. In this study, the concentration of LA in DM group was significantly higher than that in ND group, indicating that LA was up-regulated in diabetic samples. Metformin is a commonly used anti-hyperglycemic agent, and it functions to increase cytosolic AMP concentration and promote AMP-activated protein kinase phosphorylation [17-19]. The results in this study showed that metformin significantly decreased LA, PA, and LDH levels, indicating a beneficial effect of metformin in the treatment of diabetes. Notably, under hypoxic induction, the levels of LA, PA and LDH were increased in the metformin group, indicating that hypoxia impaired the effects of metformin. However, results also described that hydrogen-rich water showed a partially protective effect against the hypoxia induction in this study, indicating that hypoxia impaired the effect of metformin on lowering blood LA, PA and LDH level, but hydrogen-rich water showed a partial protective effect against hypoxia.
In pathological conditions such as hypoxia and inflammation, the production of a large quantity of free radicals and leads to oxidative damage of cells. Hydrogen treatment may serve as an antioxidant to prevent the organs from oxidative damage. In this study, DM group showed a lower level of SOD and GSH and a higher-level MDA and GSSG than ND group, indicating an impaired antioxidant capacity and the increased oxidative stress upon diabetes induction. Under the hypoxia condition, the therapeutic effect of metformin was largely suppressed in DMMH group, while after hydrogen-rich water administration, SOD and GSH level in DMMHR group were marginally increased and the levels of MDA and GSSG were significantly reduced. Since SOD and GSH serves an important antioxidant enzyme in cells [10], these results suggest that hydrogen-rich water could maintain the antioxidant capacity and decrease the oxidative stress induced by hypoxia.
In this study, we detected the expression levels of apoptotic genes in different groups. The data indicated that hypoxia could upregulate the pro-apoptotic genes in diabetic condition treated with metformin. In the presence of hydrogen-rich water, Bax level was marginally decreased in liver, while other genes remained largely unchanged. Together, these data show the dysregulation of apoptotic genes under hypoxia. However, hydrogen-rich water shows little effect on regulating apoptotic genes.
In present study, we analyzed the pathological changes of myocardial tissue under different conditions. The results indicated that the occurrence of cardiomyopathy under hyperglycemia conditions [20]. Moreover, In the diabetic group, cardiomyocytes were loosely arranged, with myocardium fibers and damaged intima. This is consistent with the reported “fuel-gauge effect” of metformin to preserve myocardial mass and increase the ATP levels in cardiomyocytes [17]. Additional, the rats were treated with metformin, myocadiac fiber damages were still observed. This may result from the higher LA levels and elevated oxidative stress in DMM group under hypoxia. It is also reported that diabetes patients with hypoxic condition have a higher risk of developing lactic acidosis when administrated with metformin, and lactic acidosis is a common factor causing cardiomyopathy [21]. Together, our analysis shows hypoxia can induce cardiomyopathy upon metformin treatment while hydrogen-rich water shows protection against hypoxia-induced damage, possibly by attenuating lactic acidosis and oxidative stresses.”
ACKNOWLEDGEMENTS
This work was financially supported by the Innovation Cultivation Fund of the Sixth Medical Center of Chinese PLA General Hospital (No. CXPY201827).
Notes
REFERENCES
1. Tentolouris A, Vlachakis P, Tzeravini E, Eleftheriadou I, Tentolouris N. 2019; SGLT2 inhibitors: a review of their antidiabetic and cardioprotective effects. Int J Environ Res Public Health. 16:2965. DOI: 10.3390/ijerph16162965. PMID: 31426529. PMCID: PMC6720282.

2. Zhang X, Yang L, Xu X, Tang F, Yi P, Qiu B, Hao Y. 2019; A review of fibroblast growth factor 21 in diabetic cardiomyopathy. Heart Fail Rev. 24:1005–1017. DOI: 10.1007/s10741-019-09809-x. PMID: 31175491.

3. An H, He L. 2016; Current understanding of metformin effect on the control of hyperglycemia in diabetes. J Endocrinol. 228:R97–R106. DOI: 10.1530/JOE-15-0447. PMID: 26743209. PMCID: PMC5077246.

4. Wróbel MP, Marek B, Kajdaniuk D, Rokicka D, Szymborska-Kajanek A, Strojek K. 2017; Metformin - a new old drug. Endokrynol Pol. 68:482–496. DOI: 10.5603/EP.2017.0050. PMID: 28819951.

5. Natali A, Ferrannini E. 2006; Effects of metformin and thiazolidinediones on suppression of hepatic glucose production and stimulation of glucose uptake in type 2 diabetes: a systematic review. Diabetologia. 49:434–441. DOI: 10.1007/s00125-006-0141-7. PMID: 16477438.

6. Ellul P, Delorme R, Cortese S. 2018; Metformin for weight gain associated with second-generation antipsychotics in children and adolescents: a systematic review and meta-analysis. CNS Drugs. 32:1103–1112. DOI: 10.1007/s40263-018-0571-z. PMID: 30238318.

7. Filippatos T, Tzavella E, Rizos C, Elisaf M, Liamis G. 2017; Acid-base and electrolyte disorders associated with the use of antidiabetic drugs. Expert Opin Drug Saf. 16:1121–1132. DOI: 10.1080/14740338.2017.1361400. PMID: 28748724.

8. DeFronzo R, Fleming GA, Chen K, Bicsak TA. 2016; Metformin-associated lactic acidosis: current perspectives on causes and risk. Metabolism. 65:20–29. DOI: 10.1016/j.metabol.2015.10.014. PMID: 26773926.

9. Lalau JD. 2010; Lactic acidosis induced by metformin: incidence, management and prevention. Drug Saf. 33:727–740. DOI: 10.2165/11536790-000000000-00000. PMID: 20701406.
10. Takaki A, Kawai D, Yamamoto K. 2013; Multiple hits, including oxidative stress, as pathogenesis and treatment target in non-alcoholic steatohepatitis (NASH). Int J Mol Sci. 14:20704–20728. DOI: 10.3390/ijms141020704. PMID: 24132155. PMCID: PMC3821639.

11. Ohta S. 2011; Recent progress toward hydrogen medicine: potential of molecular hydrogen for preventive and therapeutic applications. Curr Pharm Des. 17:2241–2252. DOI: 10.2174/138161211797052664. PMID: 21736547. PMCID: PMC3257754.

12. Li S, Liao R, Sheng X, Luo X, Zhang X, Wen X, Zhou J, Peng K. 2019; Hydrogen gas in cancer treatment. Front Oncol. 9:696. DOI: 10.3389/fonc.2019.00696. PMID: 31448225. PMCID: PMC6691140.

13. Kamimura N, Nishimaki K, Ohsawa I, Ohta S. 2011; Molecular hydrogen improves obesity and diabetes by inducing hepatic FGF21 and stimulating energy metabolism in db/db mice. Obesity (Silver Spring). 19:1396–1403. DOI: 10.1038/oby.2011.6. PMID: 21293445.

14. Aoki K, Nakao A, Adachi T, Matsui Y, Miyakawa S. 2012; Pilot study: effects of drinking hydrogen-rich water on muscle fatigue caused by acute exercise in elite athletes. Med Gas Res. 2:12. DOI: 10.1186/2045-9912-2-12. PMID: 22520831. PMCID: PMC3395574.

15. Lenzen S. 2008; The mechanisms of alloxan- and streptozotocin-induced diabetes. Diabetologia. 51:216–226. DOI: 10.1007/s00125-007-0886-7. PMID: 18087688.

16. Scale T, Harvey JN. 2011; Diabetes, metformin and lactic acidosis. Clin Endocrinol (Oxf). 74:191–196. DOI: 10.1111/j.1365-2265.2010.03891.x. PMID: 21039727.

17. Bell DSH, Goncalves E. 2019; Heart failure in the patient with diabetes: epidemiology, aetiology, prognosis, therapy and the effect of glucose-lowering medications. Diabetes Obes Metab. 21:1277–1290. DOI: 10.1111/dom.13652. PMID: 30724013.

18. Fryer LG, Parbu-Patel A, Carling D. 2002; The anti-diabetic drugs rosiglitazone and metformin stimulate AMP-activated protein kinase through distinct signaling pathways. J Biol Chem. 277:25226–25232. DOI: 10.1074/jbc.M202489200. PMID: 11994296.

19. Hardie DG, Carling D. 1997; The AMP-activated protein kinase--fuel gauge of the mammalian cell? Eur J Biochem. 246:259–273. DOI: 10.1111/j.1432-1033.1997.00259.x. PMID: 9208914.
20. Han X, Yang J, Yang K, Zhao Z, Abendschein DR, Gross RW. 2007; Alterations in myocardial cardiolipin content and composition occur at the very earliest stages of diabetes: a shotgun lipidomics study. Biochemistry. 46:6417–6428. DOI: 10.1021/bi7004015. PMID: 17487985. PMCID: PMC2139909.

21. Brucculeri S, Urso C, Caimi G. 2013; [The role of lactate besides the lactic acidosis]. Clin Ter. 164:e223–e238. Italian. DOI: 10.7417/CT.2013.1572. PMID: 23868642.
Fig. 1
Body weight (A) and blood glucose (B) measurement in normal diet (ND) group and diabetes model (DM).
Statistics: Two-way ANOVA with post-hoc Tukey test, mean ± SD. n = 6 in ND and n = 24 in DM group. **p < 0.01, ***p < 0.001.

Fig. 2
Levels of lactic acid (LA) (A), pyruvic acid (PA) (B), and lactate dehydrogenase (LDH) (C) in blood measured in different treatment groups.
Normal diet (ND) group with saline, diabetes model (DM) with saline, DM + metformin (DMM) group, DMM + hypoxia (DMMH) and DMMH + hydrogen-rich water (DMMHR) group. Statistics: One-way ANOVA with post-hoc Tukey test, mean ± SD. n = 6 in each group. *p < 0.05, **p < 0.01, ***p < 0.001.

Fig. 3
Effect of hydrogen-rich water on the superoxide dismutase (SOD) (A), malondialdehyde (MDA) (B), reduced glutathione (GSH) (C), and oxidized glutathione (GSSG) (D) levels in liver and heart tissues of hypoxic diabetic rats.
ND, normal diet; DM, diabetes model; DMM, DM + metformin; DMMH, DMM + hypoxia; DMMHR, DMMH + hydrogen-rich water. Statistics: One-way ANOVA with post-hoc Tukey test, mean ± SD. n = 6 in each group. *p < 0.05, **p < 0.01, ***p < 0.001.

Fig. 4
qPCR analysis of Bax, Caspase-3 and Bcl-2 gene expression in liver (A-C) and heart (D-F) tissues in different groups.
ND, normal diet; DM, diabetes model; DMM, DM + metformin; DMMH, DMM + hypoxia; DMMHR, DMMH + hydrogen-rich water. Statistics: One-way ANOVA with post-hoc Tukey test, mean ± SD. n = 6 in each group. *p < 0.05, ***p < 0.001.

Fig. 5
H&E staining analysis of heart tissues from ND (A), DM (B), DMM (C), DMMH (D) and DMMHR (E) groups (magnification, ×200).
Arrows indicate the myocadiac fiber damages. ND, normal diet; DM, diabetes model; DMM, DM + metformin; DMMH, DMM + hypoxia; DMMHR, DMMH + hydrogen-rich water.

Table 1
Groups and processing scheme
| Group | ND | HFSD | ||||
|---|---|---|---|---|---|---|
| Saline | Saline | Metformin | ISO | Hydrogen-rich water | ||
| ND | + | - | - | - | - | |
| DM | - | + | - | - | - | |
| DMM | - | + | + | - | - | |
| DMMH | - | + | + | + | - | |
| DMMHR | - | + | + | + | + | |
Table 2
Primers for reverse transcriptase-PCR


 PDF
PDF Citation
 Print
Print


 XML Download