INTRODUCTION
METHODS
Materials
Experimental animals
 | Fig. 1Morphological changes of skin and subcutis induced by depilatory creams.Representative H&E stain (10×) of transverse sections of dorsal skin tissues received topical application of depilatory creams, and shaved and control (untouched) treatments for three days (A–D), one week (E–H) and two weeks (I–L) in BALB/c mice (n = 5). The thickness of epidermis (M), dermis (N) and subcutis (O) layers of transverse skin sections received different treatments were measured and presented as percent of control. (P) Schematic diagram of application of two brands of depilatory creams (DC-N and DC-S) on mouse dorsal skin along with shaved and control treatments. All data were presented as mean ± SD and analyzed by one-way RMANOVA with a post-hoc analysis of Holm Sidak test for pairwise comparisons. Arrow, hair follicle in the early anagen. *p < 0.05 and **p < 0.01 vs. control. Scale bar, 100 μm.
|
Hematoxylin-eosin staining
HFs and dermal fibroblasts counting
IHC analysis
Statistical methods
RESULTS
Morphological changes of skin and subcutis induced by depilatory creams
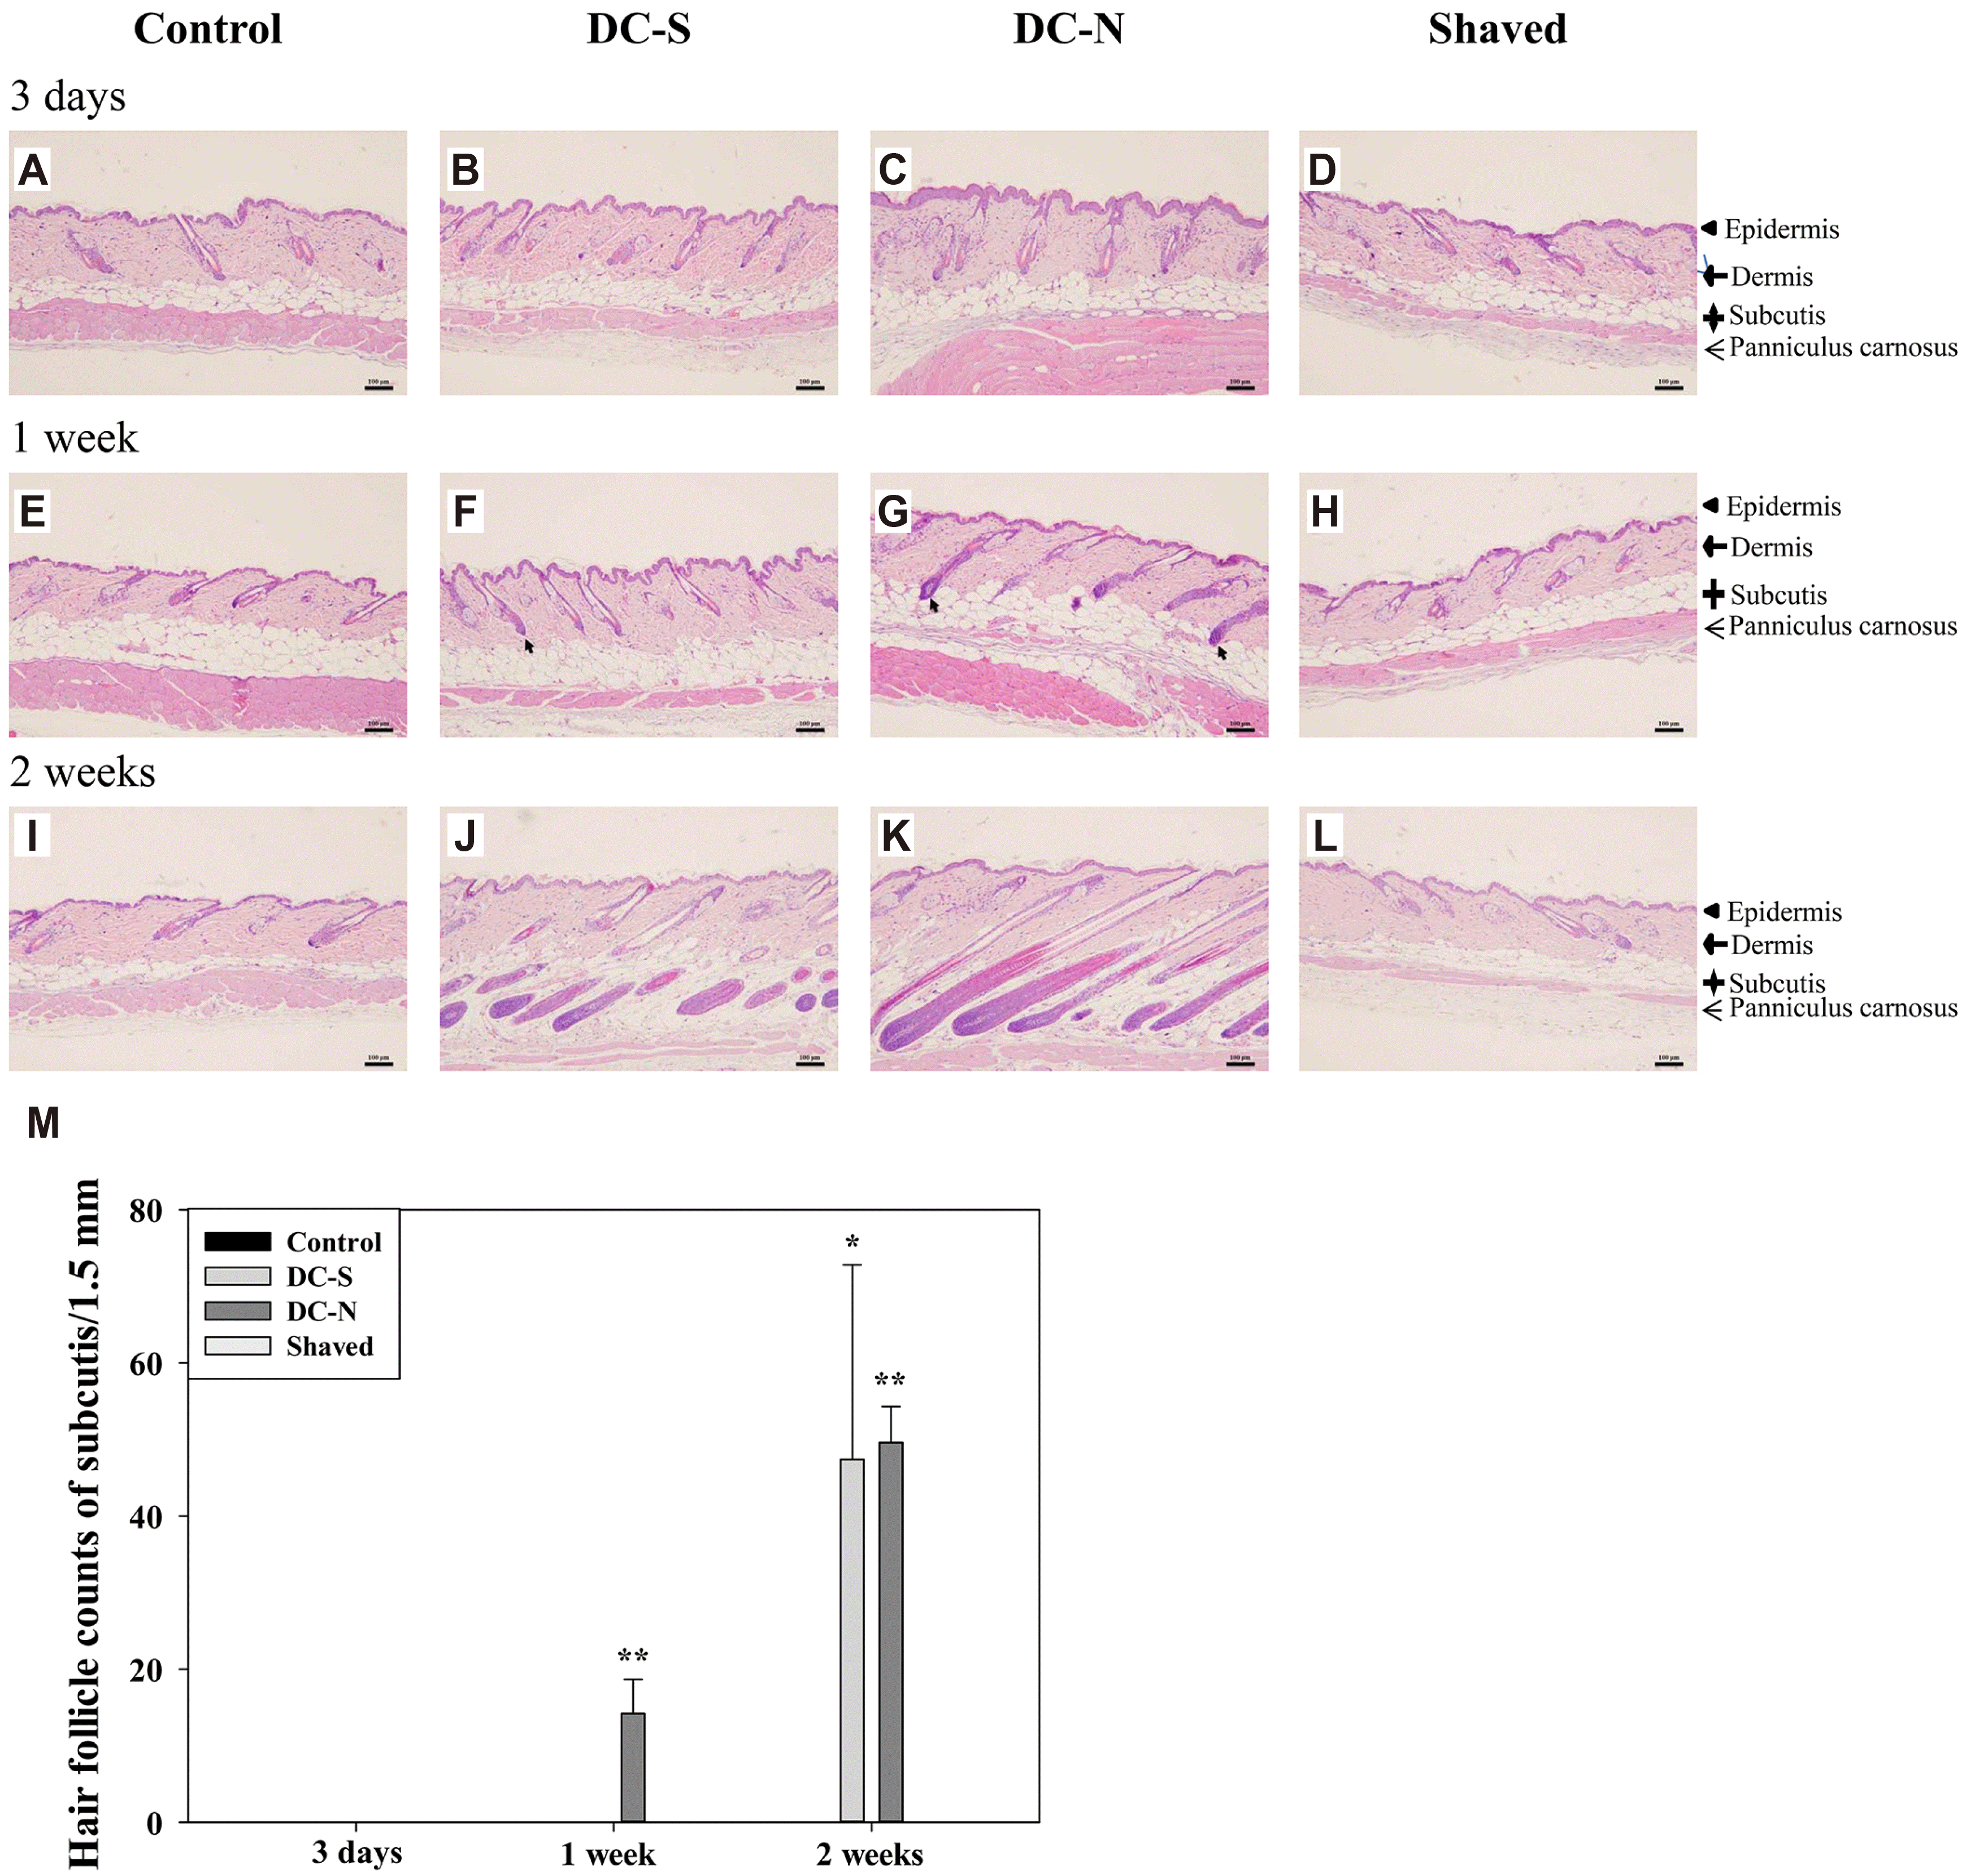
Effects of depilatory creams on HF development in mouse
 | Fig. 2Induced anagen entry and number of hair follicle by treatment of depilatory creams.Representative H&E stain (10×) of longitudinal sections of dorsal skin tissues received topical application of depilatory creams and shaved and control (untouched) treatments for three days (A–D), one week (E–H) and two weeks (I–L) in BALB/c mice (n = 5). (M) The number of hair follicles in subcutis were counted and presented as mean ± SD and analyzed by one-way RMANOVA with a post-hoc analysis of Holm Sidak test for pairwise comparisons. Scale bar, 100 μm. Arrow, hair follicle in the early anagen. *p < 0.05 and **p < 0.01 vs. control.
|
Induced expression of IL-6 and TNFs in dermal fibroblasts by depilatory creams
 | Fig. 3Induced expression of interleukin-6 (IL-6) in dermal fibroblasts by depilatory creams.Representative of histological images (20×) stained with IL-6 antiserum of dorsal skin tissues received topical application of depilatory creams and shaved and control (untouched) treatments for three days (A–D), one week (E–H) and two weeks (I–L) in BALB/c mice (n = 5). (M) Percentage of IL-6 positive fibroblast. Scale bar, 100 μm. All data were presented as mean ± SD and analyzed by one-way RMANOVA with a post-hoc analysis of Holm Sidak test for pairwise comparisons. Arrow, IL-6 positive fibroblast. *p < 0.05 vs. control.
|
 | Fig. 4Induced expression of tumor necrosis factor-α (TNF-α) in dermal fibroblasts by depilatory creams.Representative of histological images (20×) stained with TNF-α antiserum of dorsal skin tissues received topical application of depilatory creams and shaved and control (untouched) treatments for three days (A–D), one week (E–H) and two weeks (I–L) in BALB/c mice (n = 5). (M) Percentages of TNF-α positive fibroblast. Scale bar, 100 μm. All data were presented as mean ± SD and analyzed by one-way RMANOVA with a post-hoc analysis of Holm Sidak test for pairwise comparisons. Arrow, TNF-α positive fibroblast. *p < 0.05 and **p < 0.01 vs. control.
|
 | Fig. 5Induced expression of tumor necrosis factor-β (TNF-β) in dermal fibroblasts by depilatory creams.Representative of histological images (20×) stained with TNF-β antiserum of dorsal skin tissues received topical application of depilatory creams and shaved and control (untouched) treatments for three days (A–D), one week (E–H) and two weeks (I–L) in BALB/c mice (n = 5). (M) Percentage of TNF-β positive fibroblast. Scale bar, 100 μm. All data were presented as mean ± SD and analyzed by one-way RMANOVA with a post-hoc analysis of Holm Sidak test for pairwise comparisons. Arrow, TNF-β positive fibroblast. *p < 0.05 vs. control.
|


 PDF
PDF Citation
 Print
Print


 XML Download