

 PDF
PDF Citation
 Print
Print


INTRODUCTION
Calcitonin is a peptide hormone comprising of 32 amino acids with a molecular weight of 3,418 D and is mainly secreted by the C cells of the thyroid gland. In normal endocrine processes, calcitonin inhibits calcium reabsorption from the bones, thereby main6338taining bone strength [1, 2]. The plasma calcitonin concentration is relatively high in infants, and decreases rapidly until adolescence, leveling off during adulthood [3]. On average, its concentration is higher in men than in women [4, 5].
Calcitonin concentration abnormally increases in medullary thyroid cancer [6, 7]. A cut-off concentration of 10 pg/mL is most commonly used to differentiate between C-cell hyperactivity diseases (including medullary thyroid cancer) and other thyroid diseases [8-10]. In addition, a follow-up of plasma calcitonin concentration after treatment for medullary thyroid cancer is useful for monitoring recurrence and predicting patient prognosis [11, 12]. The diagnostic utility of plasma calcitonin concentration further increases when reviewed in combination with the carcinoembryonic antigen (CEA) concentration, RET protooncogene mutations, and needle aspiration biopsy findings [13, 14]. The measurement of serum calcitonin level is markedly significant as it serves as a quick and cost-effective method for diagnosing medullary thyroid cancer [6, 15-19]. Serum calcitonin concentration testing, like most tests conducted in modern clinical laboratories, is becoming increasingly advanced and automated [5, 9, 20-22].
However, standardization and harmonization of calcitonin measurements using various assays have not been achieved to date. Only few studies have evaluated the equivalence of different calcitonin assays [5, 23]. In this context, we compared the serum calcitonin levels measured using three different automated immunochemical analyzers, namely the LIAISON (Diasorin, Saluggia, Italy), Atellica IM 1600 (Siemens Healthcare Diagnostics Inc., New York, USA), and Cobas e801 (Roche Diagnostics GmbH, Mannheim, Germany), to evaluate the equivalence of the test results and determine whether the current clinical calcitonin cut-offs apply to the available calcitonin immunoassays used in clinical laboratories.
Go to : 
MATERIALS AND METHODS
1. Specimen collection and calcitonin measurement
From January to February 2020, 104 serum samples were referred to the laboratory of Severance Hospital for routine calcitonin measurement. Immediately after completion of the routine test, each sample was aliquoted into three tubes and stored at -70°C until the calcitonin levels were measured using the three different assays. The aliquots were thawed between 20-23°C on the same day and measured using three analyzers, namely the LIAISON, Atellica IM 1600, and Cobas e801 systems without any time interval (Table 1). This study protocol was reviewed and approved by the Institutional Review Board of Severance Hospital in Seoul, Korea (IRB No. 2019-3377-001).
Table 1
Specifications of the calcitonin assays
![]()
2. Comparison of the methods
The methods were compared according to the Clinical and Laboratory Standards Institute (CLSI) guideline EP09c-ED3 [24]. As an established reference method was not available, we performed pairwise comparisons of the results obtained using the LIAISON, Atellica IM 1600, and Cobas e801 systems. After conducting an initial analysis with all data points, we excluded the data points for concentrations >20 pg/mL and repeated the analysis to evaluate the agreement of the measured values near the clinically significant cut-off value of 10 pg/mL.
4. Statistical analysis
We performed statistical analysis and presented the results as graphs using Analyse-it (v2.30, Analyse-it Software Ltd, Leeds, UK). The relationships among the calcitonin assays were evaluated by Spearman correlation analysis. The slope and y-intercepts for the results obtained using each instrument were determined by performing the Passing–Bablok regression analysis to investigate the equivalence between the pairs of instruments. Cohen’s kappa coefficient was also calculated to analyze the classification concordance.
Go to :
RESULTS
1. Comparison of three different analyzers
The calcitonin values measured by the LIAISON analyzer were mainly distributed between <1.0 and >2,000 pg/mL. Fifty-six of the 104 samples (53.3%) had values exceeding the clinically meaningful cut-off (10 pg/mL). The Cobas e801 analyzer showed positive bias compared with the LIAISON analyzer, with a slope of 1.23; y-intercept, -0.94; and R, 0.77 (Fig. 1). The Atellica IM 1600 analyzer also showed a positive bias compared with the LIAISON analyzer, with a slope of 1.14; y-intercept, 1.18; and R, 0.63. Comparison of the Atellica IM 1600 analyzer with the Cobas e801 analyzer showed a slope of 1.05, y-intercept of 2.27, and R of 0.95, indicating a relatively smaller bias and a higher correlation than that of the other two pairs.
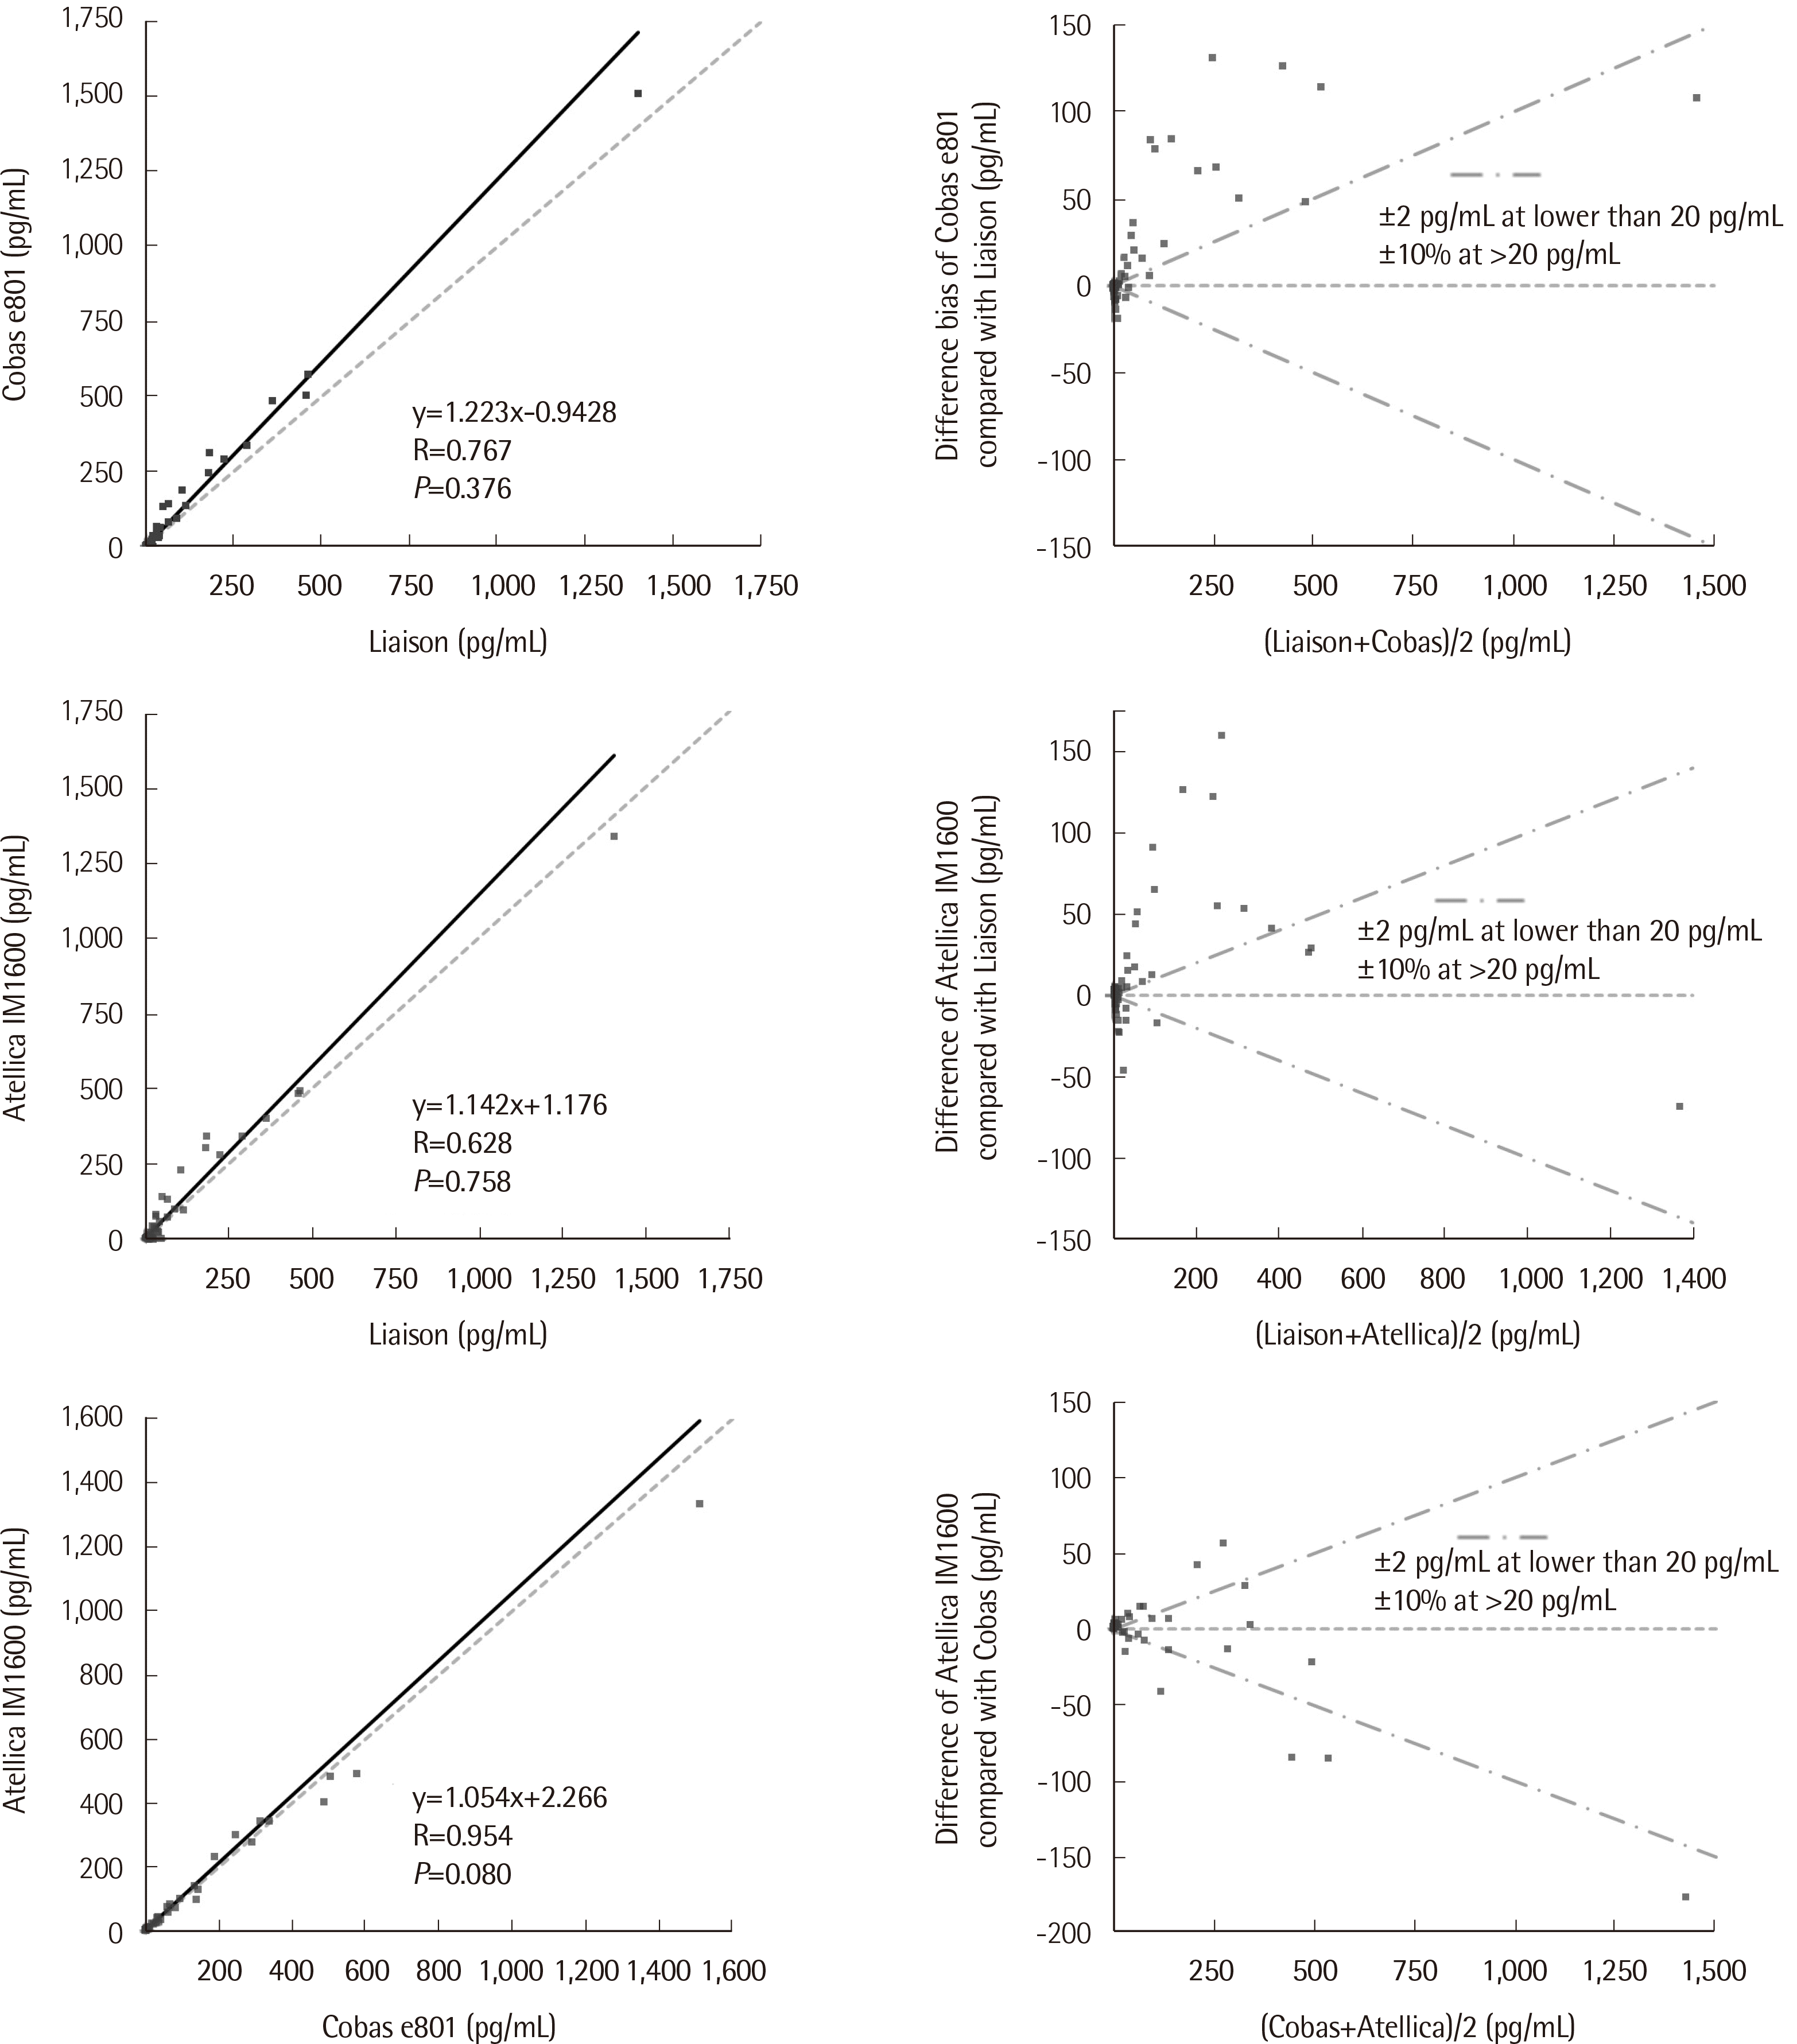 | Fig. 1Passing–Bablok regression and bias plots for all data points. Results obtained using the Cobas e801 analyzer compared to those obtained using the LIAISON analyzer (upper left), results obtained using the Atellica IM1600 analyzer compared to those obtained using the LIAISON analyzer (middle left), and results obtained using the Atellica IM1600 analyzer compared with those obtained using the Cobas e801 analyzer (lower left) were plotted with the Passing–Bablok regression and identity lines. P-values for linearity test are also indicated. The corresponding relative bias plots are displayed on the right side.
|
2. Correlation analysis of the data points for concentrations below 20 pg/mL
We conducted an additional analysis using only the data points for concentration <20 pg/mL to assess the concordance among the measured values near the clinically significant cut-off value of 10 pg/mL, which is commonly used for differentiating possible thyroid cancers from benign conditions. The exclusion of points for concentrations >20 pg/mL had a substantial impact on the slopes and intercepts during pairwise comparisons of the instruments. The Cobas e801 analyzer showed a negative bias compared with the LIAISON analyzer, with a slope of 0.86; y-intercept, 0.07; and R, 0.39 (Fig. 2). The Atellica IM 1600 analyzer also showed negative bias compared with the LIAISON analyzer, with a slope of 0.88; y-intercept, 2.31; and R, 0.22. Comparison of the Atellica IM 1600 analyzer with the Cobas e801 analyzer revealed a slope of 1.27; y-intercept, 1.74; and R, 0.90, indicating a much higher correlation than those noted for the other two pairs. The first two pairs under consideration showed significantly decreased correlation coefficients after excluding the data points for concentrations >20 pg/mL. We next calculated the relative differences at a critical value of 10 pg/mL between pairs of analyzers (Table 2). Compared to LIAISON’s result of 10 pg/mL, Cobas e801 showed a value of 8.63 pg/mL (95% confidence interval [CI]; 5.61 to 10.25 pg/mL) and a relative difference of -13.66% (95% CI; -43.95% to 2.49%). Similarly, Atellica IM 1600 showed a value of 11.15 pg/mL (95% CI; 8.01 to 13.43 pg/mL) and a relative difference of 11.48% (95% CI; -19.92% to 34.33%) over LIAISON. When Atellica IM 1600 was compared to Cobas e801, Atellica IM 1600 showed a value of 14.41 pg/mL (95% CI; 13.37 to 16.53 pg/mL) and the relative difference was 44.07% (95% CI; 33.67% to 65.31%) at 10 pg/mL as measured by Cobas e801.
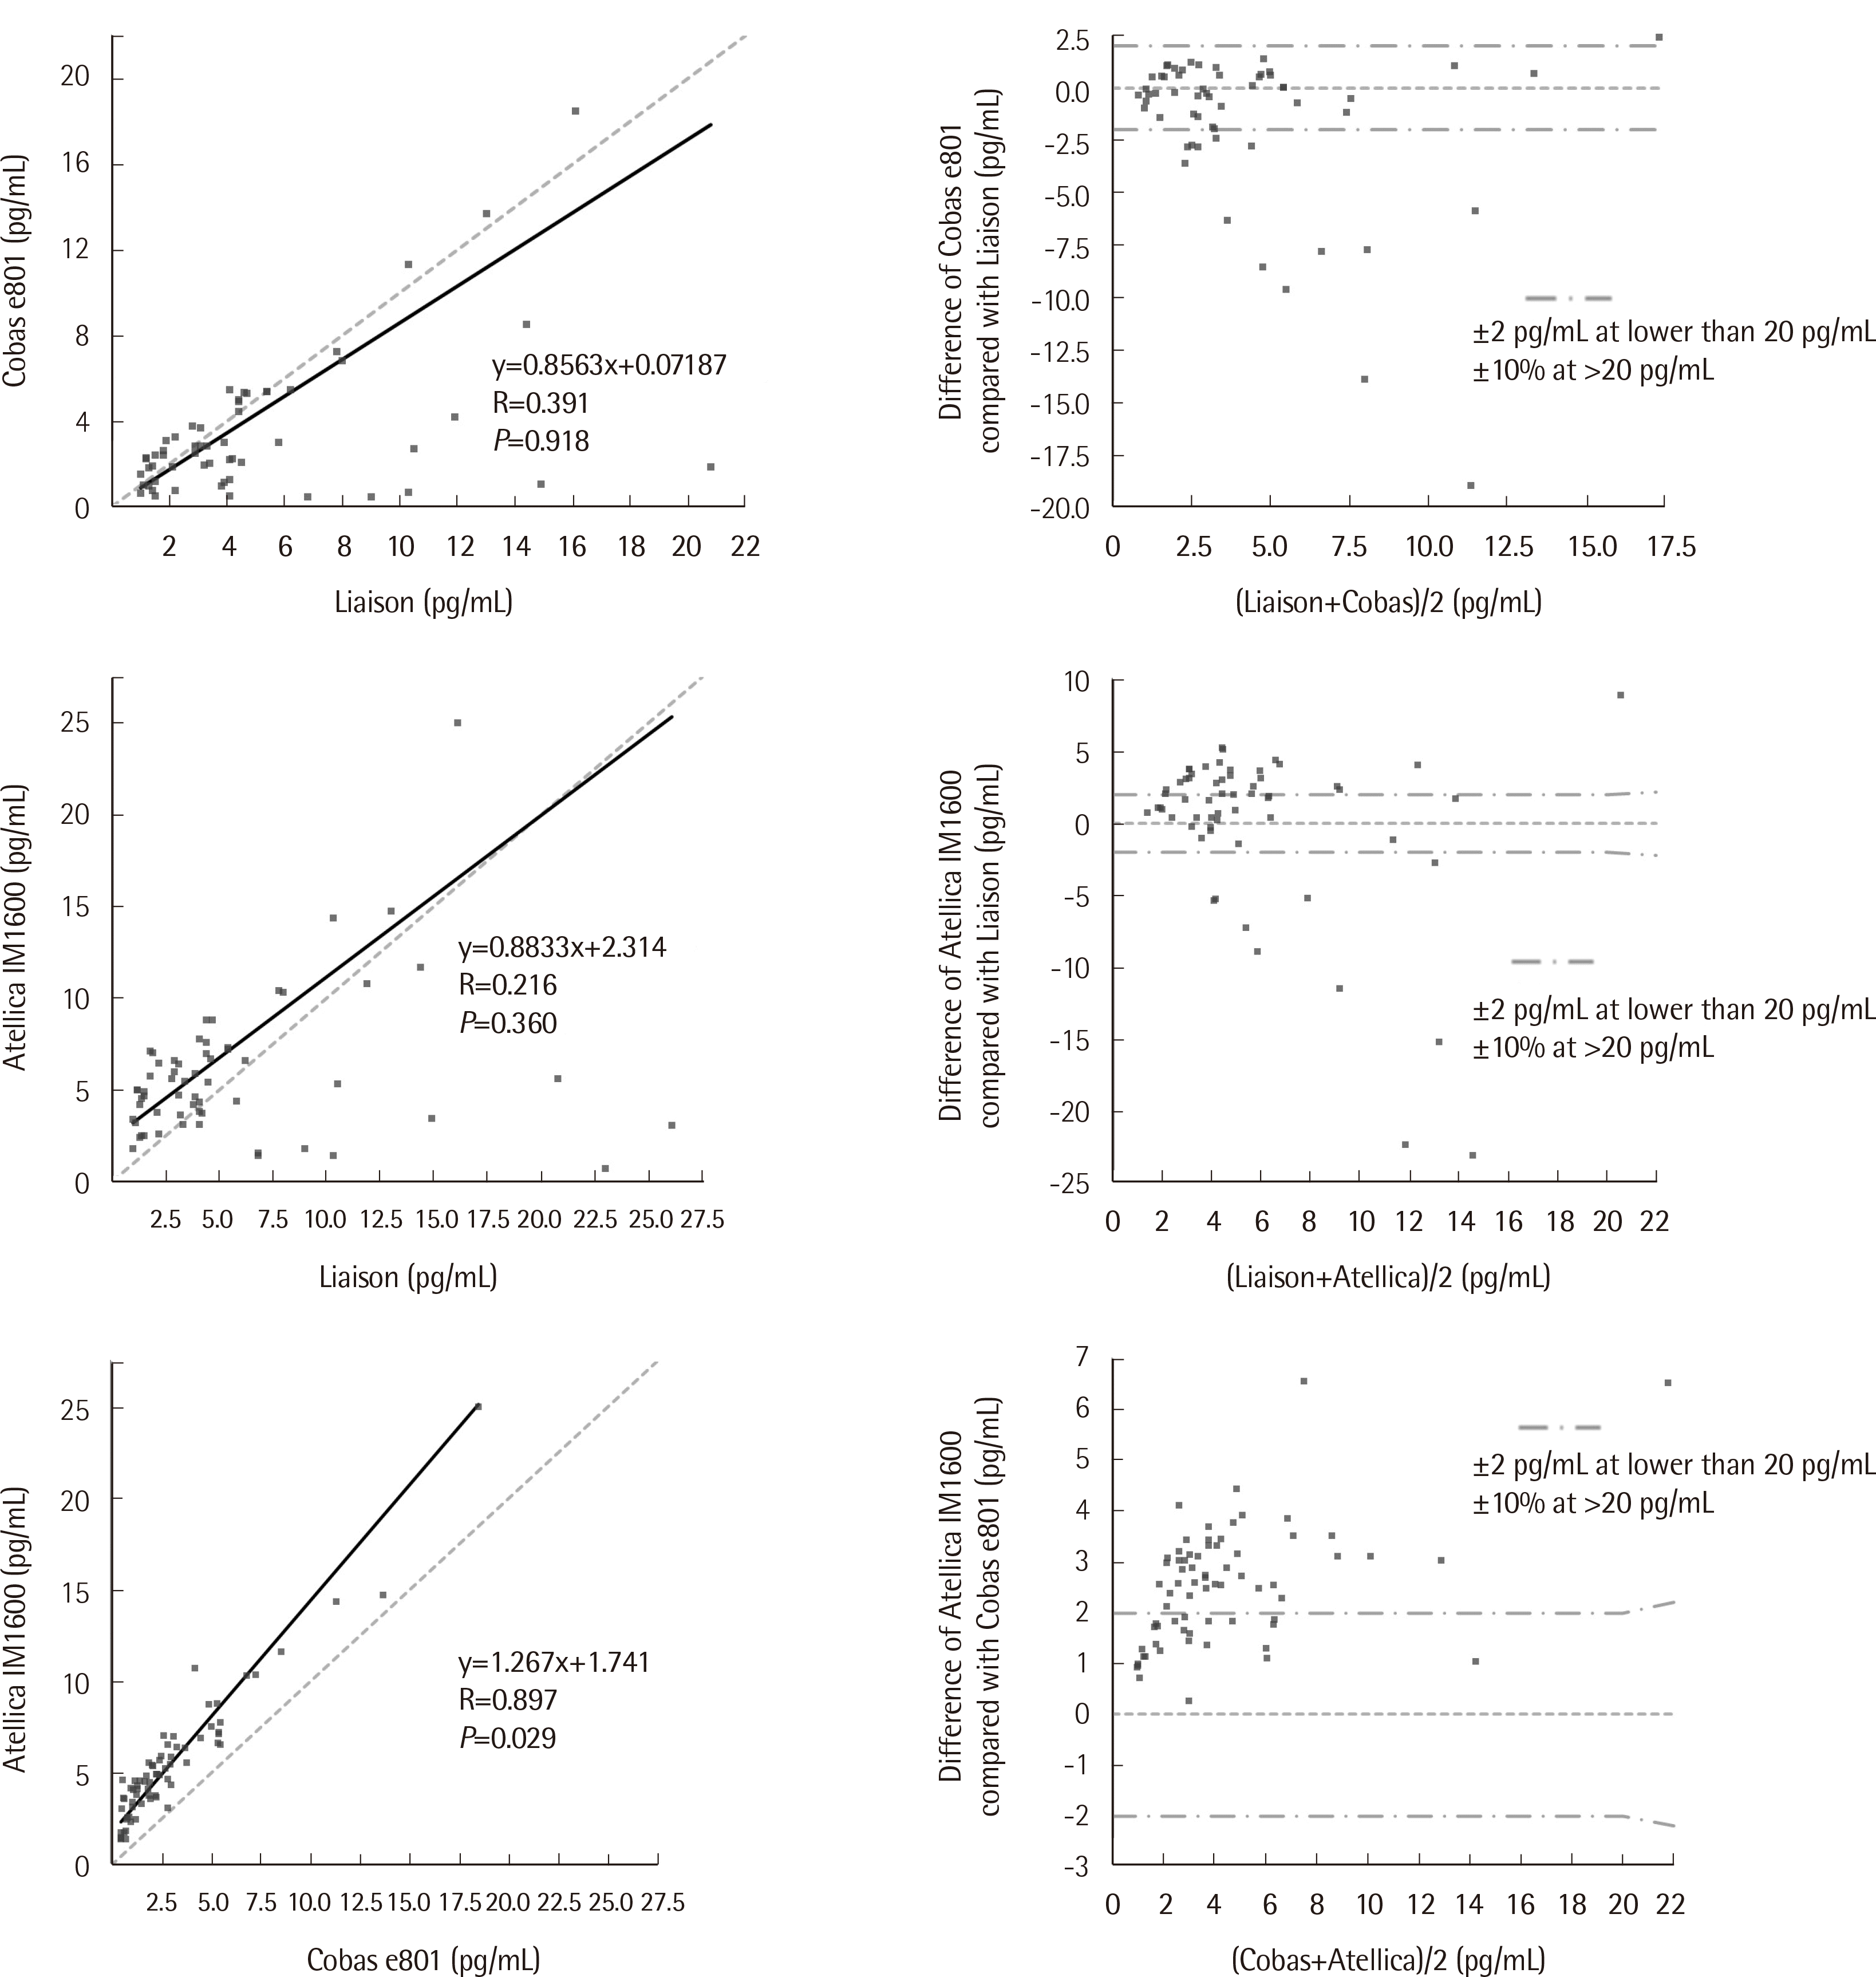 | Fig. 2Passing–Bablok regression and bias plots excluding the data points for concentrations >20 pg/mL. Results obtained using the Cobas e801 analyzer compared to those obtained using the LIAISON analyzer (upper left), results obtained using the Atellica IM1600 compared to those using the LIAISON analyzer (middle left), and results obtained using the Atellica IM1600 analyzer compared to those obtained using the Cobas e801 analyzer (lower left) were plotted with the Passing–Bablok regression and identity lines. Only data points for concentrations <20 pg/mL were included in the regression analysis. P-values for linearity test are also indicated. The corresponding relative bias plots are displayed on the right side.
|
Table 2
Predicted calcitonin concentrations and relative differences at 10 pg/mL calculated by the Passing–Bablok regression analysis with data points for concentrations <20 pg/mL
![]()
3. Categorical concordance rate based on the cut off level of 10 pg/mL
We also assessed the effects of these systemic biases on the clinical interpretation of calcitonin levels. The calcitonin levels obtained using each instrument were categorized based on the commonly used clinical decision point, namely ≤10 pg/mL or >10 pg/mL. Using the Cobas e801 analyzer, the calcitonin levels in 30 of the 104 (28.8%) samples exceeded 10 pg/mL; the results of all 30 (100.0%) samples matched the results obtained using the LIAISON analyzer (Table 3). Moreover, 74 of the 104 (71.2%) samples showed calcitonin levels ≤10 pg/mL; the results of 65 of these 74 (87.8%) matched the results obtained using the LIAISON analyzer. In summary, for 9 samples, only the LIAISON analyzer provided calcitonin concentration measurements >10 pg/mL, and only the LIAISON analyzer did not detect calcitonin levels ≤10 pg/mL in any sample. Cohen’s kappa, used to assess classification concordance, was 0.81. Using the Atellica IM 1600 analyzer, calcitonin levels in 34 of the 104 (32.7%) samples exceeded 10 pg/mL; the results of 32 of 34 (94.1%) matched the results obtained using the LIAISON analyzer. A total of 70 of the 104 (67.3%) samples had calcitonin levels ≤10 pg/mL; the results of 63 (90.0%) of these samples mat ched the results obtained using the LIAISON analyzer. For 7 samples, only the LIAISON analyzer provided calcitonin concentration measurements >10 pg/mL; however, only 2 samples had calcitonin levels ≤10 pg/mL as detected using the LIAISON analyzer. Cohen’s kappa was 0.81. Comparison of the Atellica IM 1600 analyzer with the Cobas e801 analyzer revealed matching results of calcitonin levels >10 pg/mL for 30 of the 34 (88.2%) samples and of calcitonin levels ≤10 pg/mL for all 70 of 70 (100.0%) samples. Cohen’s kappa was 0.91.
Table 3
Agreement of calcitonin concentration classification based on the clinical decision point
| A. Cobas e801 system versus LIAISON system | |||
|---|---|---|---|
| LIAISON, pg/mL | |||
| ≤10 | >10 | ||
| Cobas, pg/mL | ≤10 | 65 | 9 |
| >10 | 0 | 30 | |
| B. Atellica IM-1600 system versus LIAISON system | |||
|---|---|---|---|
| LIAISON, pg/mL | |||
| ≤10 | >10 | ||
| Atellica, pg/mL | ≤10 | 63 | 7 |
| >10 | 2 | 32 | |
| C. Atellica IM-1600 system versus Cobas e801 system | |||
|---|---|---|---|
| LIAISON, pg/mL | |||
| ≤10 | >10 | ||
| Atellica, pg/mL | ≤10 | 70 | 0 |
| >10 | 4 | 30 | |
![]()
To directly show the discordant results, the overall calcitonin concentration values <30 pg/mL obtained using the three different instruments were presented in ascending order in a single chart (Fig. 3). The three results for each sample obtained using the three different analyzers are presented on a single vertical line. The results obtained using the different analyzers are indicated by hollow markers, whereas the solid markers indicate discordance in the concentration category based on a cut-off of 10 pg/mL. The 11 samples showing discordant results include 7 samples with calcitonin concentrations >10 pg/mL measured using only the LIAISON analyzer, 2 samples with calcitonin concentrations >10 pg/mL measured using only the Atellica IM 1600 analyzer, and 2 samples with calcitonin concentration >10 pg/mL measured using both the LIAISON and Atellica IM 1600 analyzers.
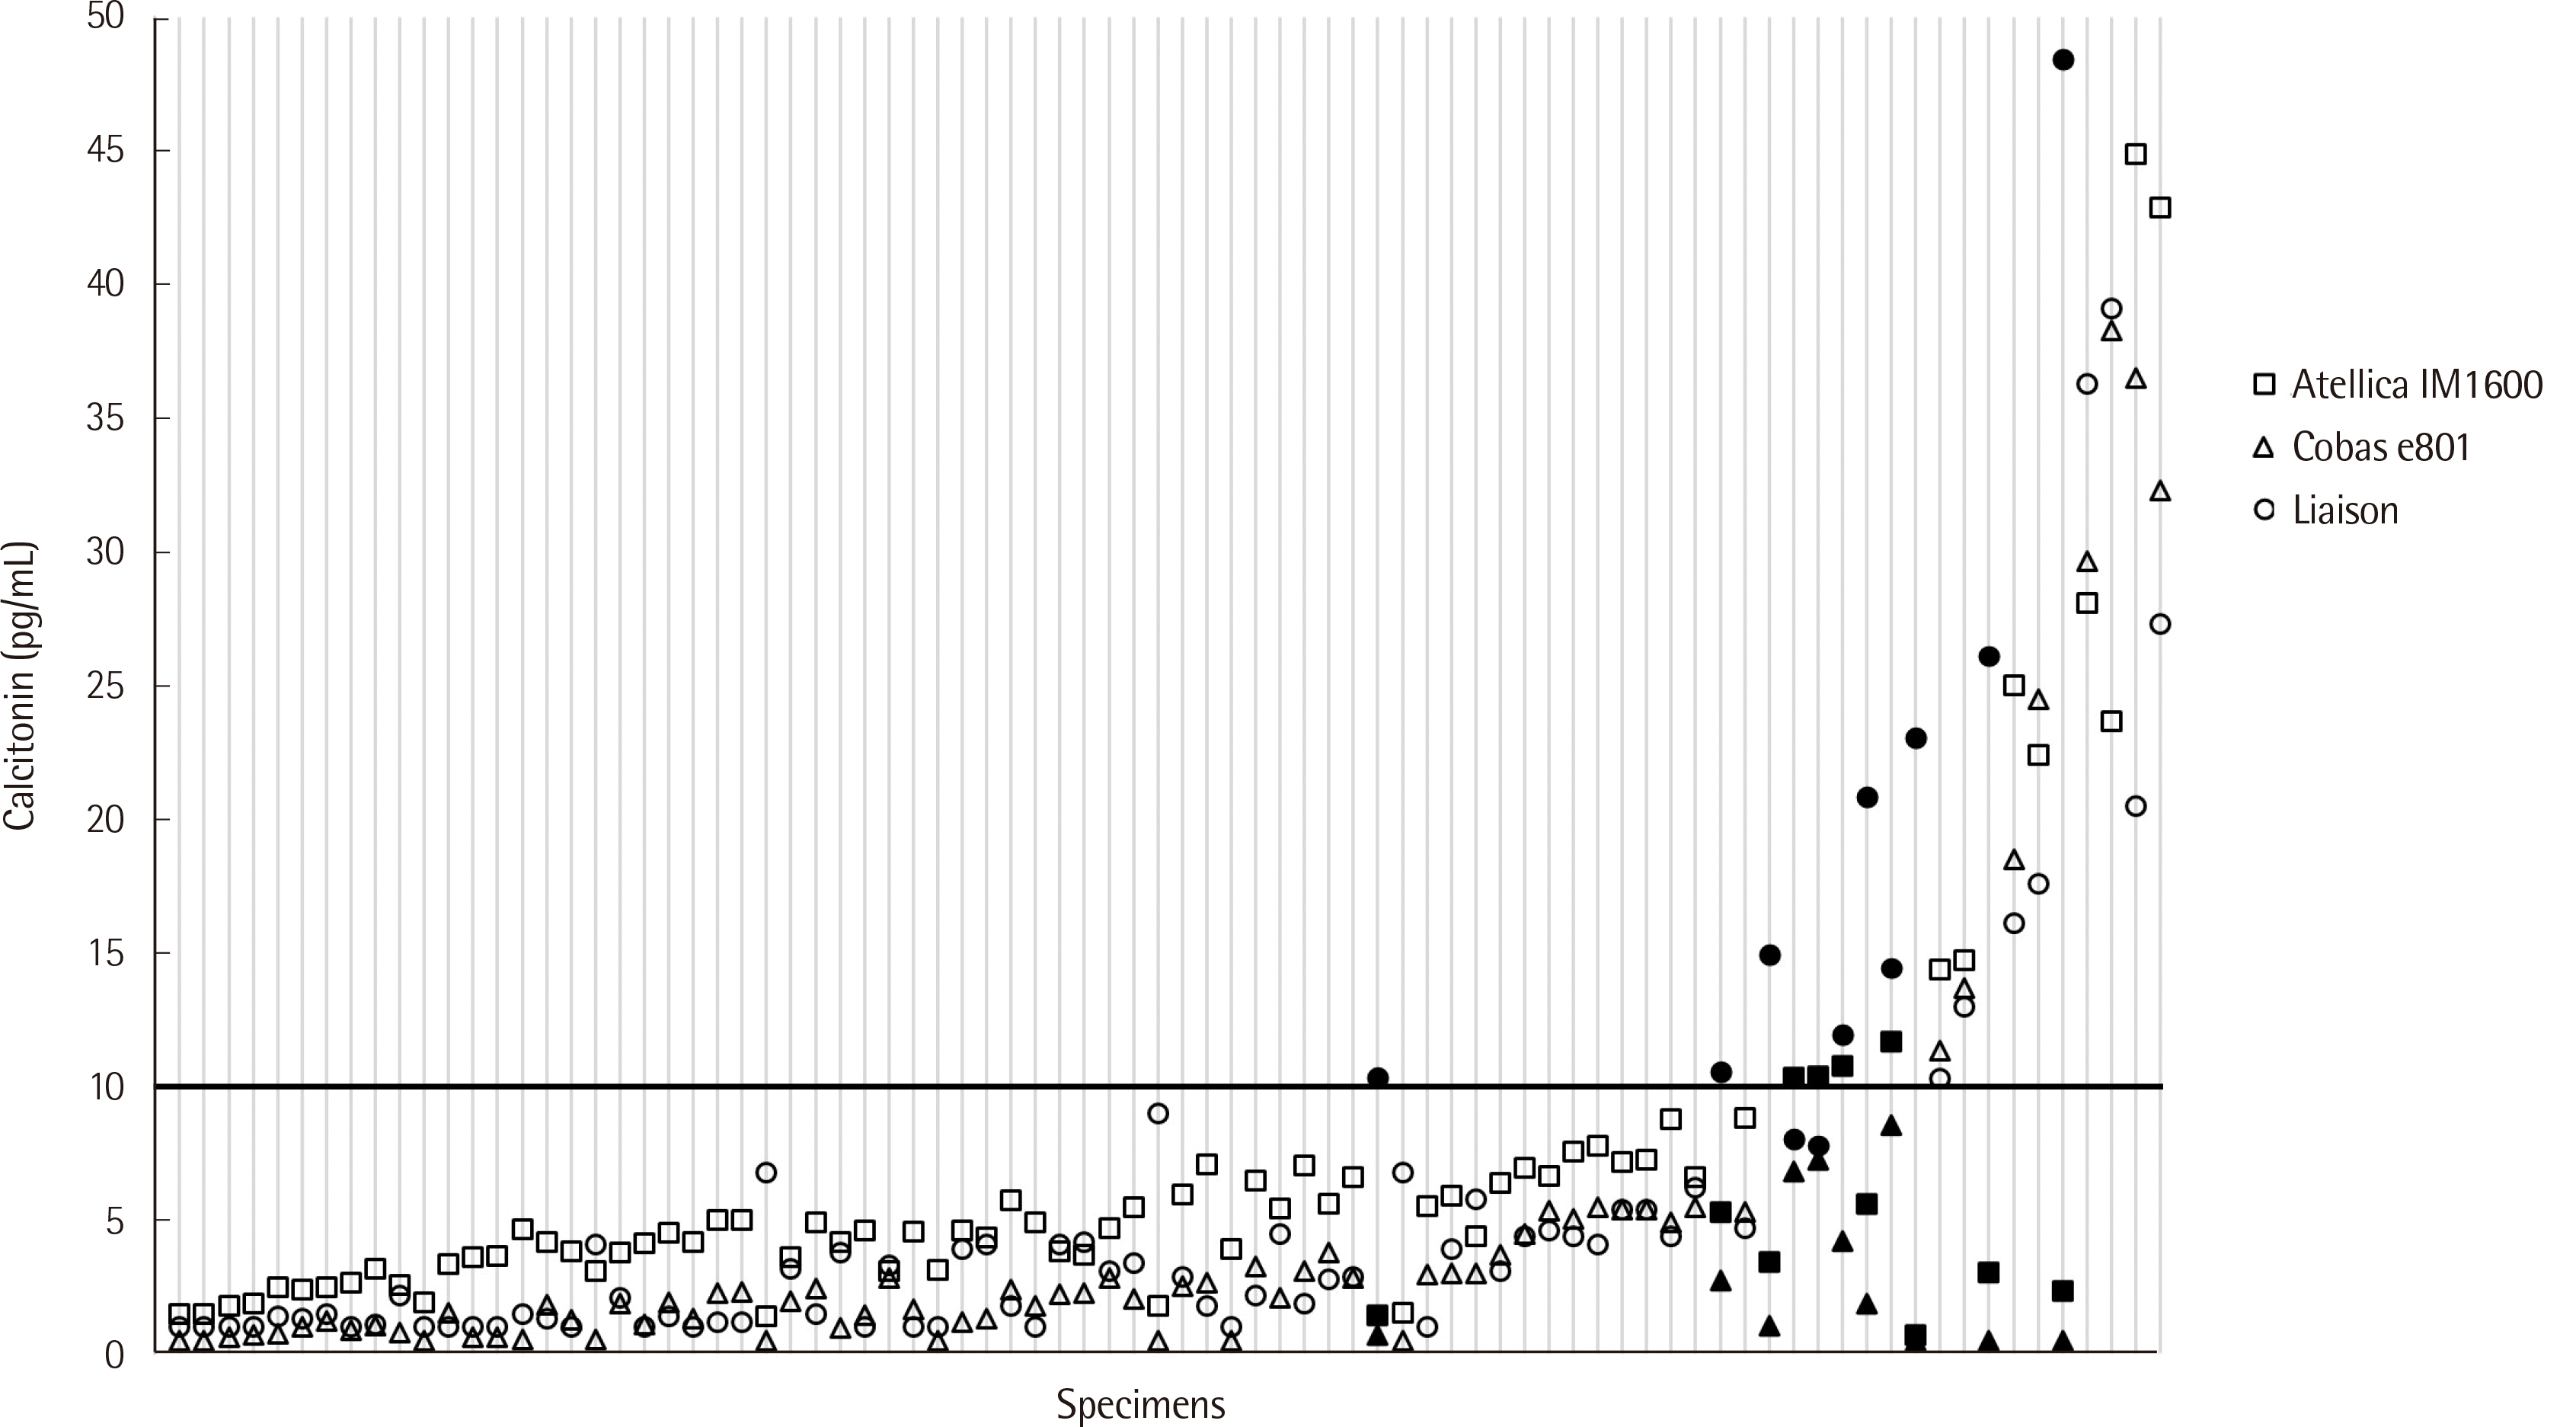 | Fig. 3Scatter plot showing calcitonin concentrations measured using all three analyzers. Data points for the calcitonin concentrations <50 pg/mL measured using the three analyzers were plotted in the order of increasing average concentrations. The discordance between the interpretive categories (concentration ≤10 pg/mL and concentration >10 pg/mL) is indicated by solid markers and all other results are indicated by hollow markers.
|
Go to :
DISCUSSION
Previously, the serum calcitonin levels were primarily measured using a radioimmunoassay. However, the differences in assay specificity and sensitivity, matrix-related and nonspecific serum effects, and heterogeneity in the circulating calcitonin levels contributed to contradicting results and discrepancies in the calcitonin concentrations measured using different assays. In modern clinical laboratories, several highly sensitive two-site immunometric methods, including chemiluminescence immunoassay (CLIA) are used. However, the methods for measuring calcitonin levels are not currently fully standardized [25]. Therefore, we conducted direct comparisons of the currently available instruments used for calcitonin measurement to empirically demonstrate the level of harmonization in clinical laboratories.
Initially, when all data points were included in the comparison, both the Cobas e801 and Atellica IM 1600 analyzers showed limited positive bias compared with the LIAISON analyzer, with acceptable correlation coef-cients for both comparisons. The comparison of the Atellica system with the Cobas indicated better correlation and non-significant bias. Similarly, the bias noted upon comparing the Cobas and the Atellica with the LIAISON analyzer led to clinically significant differences in the interpretation of the calcitonin levels. Based on the clinical cut-off of 10 pg/mL, of the 39 samples determined positive by LIAISON analyzer, 9 samples were determined negative by Cobas analyzer and 7 samples were determined negative by the Atellica analyzer, thereby revealing substantial discordance with the results from LIAISON system. After excluding the data points for concentrations >20 pg/mL, the discordance between the measured values around 10 pg/mL was elucidated. We observed some aberrant high concentrations when using the LIAISON analyzer compared to the other two analyzers. Comparison of the Atellica to the Cobas analyzer showed relatively high correlation, although some positive bias was observed. Based on the clinical cut-off of 10 pg/mL, the calcitonin levels of 39 of the 104 samples (37.5%) were above the threshold level when using the LIAISON analyzer, while the calcitonin levels of 9 of the 39 samples were below the threshold level when using the Cobas analyzer, revealing significant discordance with the results obtained using the LIAISON analyzer. Similarly, the calcitonin levels of 7 of the 39 samples were below the threshold level when using the Atellica analyzer, which also showed substantial discordance with the results obtained using the LIAISON system. After excluding the data points for concentrations >20 pg/mL (to elucidate the discordance between the values measured around the 10 pg/mL level), the results obtained using the Cobas e801 and Atellica IM 1600 analyzers showed weak correlations with those obtained using the LIAISON analyzer. The discordance in the calcitonin concentration measured near 10 pg/mL seemed to be the major contributor to this weak correlation. We observed some aberrantly high concentrations using the LIAISON analyzer compared to concentrations obtained for identical samples analyzed using the other analyzers. Comparison of the Atellica to the Cobas analyzer revealed higher correlation, although some positive bias was observed.
The Royal College of Pathologists of Australasia suggests an acceptable difference ±2 pg/mL calcitonin level for concentrations that are the same as, or less than 20 pg/mL and ±10% for concentrations above 20 pg/mL [26]. The allowable difference band was drawn on relative bias plots in Figs. 1 and 2. When all the data points were analyzed, Cobas e801 and Atellica IM1600 showed some positive bias over LIAISON between 20 pg/mL and 600 pg/mL, while for data points below 20 pg/mL, the two analyzers assigned a profoundly lower value for some samples than the LIAISON. The relative difference for these samples, even exceeding -100% sometimes, may have critically attributed to the weak correlation between LIAISON and the other two analyzers. For these samples, factors involved in pre-analytical or analytical phases could be considered as causes of the discrepancy. When the samples were being measured, there were no cases of recognized hemolysis, icterus, or lipidemia. Moreover, the principles of the three assays invariably resort to mouse anti-hCT (human calcitonin) antibody, albeit minor variations exist among reagent compositions. Characteristic reagent components of the three assays are indicated in Table 1. LIAISON assay included a small amount of polyclonal mouse IgG in its assay buffer to prevent the interference from heterophilic antibody. However, the Cobas and Atellica assays used a biotinylated antibody. This may result in interference from any intake of a biotin substance. All these minor differences among the assays might attribute to the discordance to some extent.
Due to the lack of a reference method for measuring the calcitonin concentration, we cannot conclude that results obtained using one of these analyzers may be closer to the actual values than those obtained using the other analyzers. However, because there were some aberrant high concentrations around 10 pg/mL when using the LIAISON analyzer in our study, we attempted to verify whether false-positive results using this analyzer were reported previously. Our results may be more informative when reviewed in combination with those reported in previous studies [5, 23]. Bieglmayer et al. [23] compared four calcitonin assays: the first version of a CLIA from LIAISON (Stillwater, MN, USA), a CLIA from Nichols Institute Diagnostics (San Juan Capistrano, CA, USA), a CLIA from Diagnostic Products Corporation (Los Angeles, CA, USA), and an immunoradiometric assay from Scantibodies (Santee, CA, USA). Comparisons of these assays revealed implausible detection of calcitonin levels in thyroidectomized patients using the LIAISON system and substantial discordance in the measured concentrations among all assays assessed, especially at low calcitonin levels. Cavalier et al. [5] compared the LIAISON Calcitonin II-gen to the cisbio h-CT (CIS bio international, Gif-sur-Yvette, France) to validate the analytical performance of the second-generation LIAISON calcitonin assay. The measurement of serum calcitonin concentrations in 250 consecutive patients showed no significant systematic bias or significant differences, as noted by the Wilcoxon test. They concluded that the specificity of the new version of the LIAISON analyzer was markedly improved, although 1 of the 14 thyroidectomized patients showed detectable calcitonin concentrations.
Currently, there is no consensus on the reference method for calcitonin measurement. To standardize the calcitonin assay, the World Health Organization (WHO) established an international reference preparation, IRR 70/234, which was replaced by the IS 89/620 standard. All three assays addressed in this study are traceable to this IS 89/620 standard. However, this standard is not commutable (that is, not proven to be equivalent for representative authentic clinical samples) for any specific assay [27]. Therefore, the possibility of significant inter-assay differences could not be disregarded, although most assays are currently calibrated to a common international reference standard. In addition, it remains uncertain whether the current clinical calcitonin cut-off applies to all available calcitonin immunoassays or if monitoring using different methods is clinically reliable when patients are transferred between healthcare facilities. There is a scarcity of studies on the concordance among various calcitonin test methods. The results of the present study indicated the differences in the measured calcitonin values for each of the three analyzers, especially at low values near the clinical cut-off. These differences are probably attributable to the use of different calibrators among the manufacturers, which is an inevitable challenge as commutable reference material is not available. Therefore, joint efforts by the expert scientific community, manufacturers, and regulatory organizations are warranted to establish a reference method and commutable reference material for improved standardization and harmonization of the calcitonin assays.
Discordant results for calcitonin levels can lead to misclassification of patients and unnecessary additional examinations or delayed diagnosis of serious disease. Due to the high sensitivity and specificity of calcitonin to medullary thyroid cancer, routine calcitonin measurements are performed in many countries, including major parts of Europe [16]. In patients with elevated basal serum calcitonin levels >10 pg/mL, pentagastrin stimulation testing is performed to distinguish among the false-positive findings and to more accurately estimate the possibility of medullary thyroid cancer [28]. Stimulated calcitonin concentrations >200 pg/mL suggest medullary thyroid cancer, which requires thyroidectomy. With respect to the impact of early diagnosis, a study on the screening of 10,864 patients reported elevated calcitonin levels in 44 patients, all confirmed to have medullary thyroid cancer based on pentagastrin-stimulated calcitonin tests. Among these patients, 59% achieved complete remission compared to 2.7% of patients with medullary thyroid cancer before the implementation of calcitonin screening [17]. A common cut-off of 10 pg/mL is conventionally used for the initial screening of C-cell hyperplastic conditions [8-10]. However, additional studies are needed to achieve a sophisticated and evidence-based consensus on new criteria considering the inter-method variability. Sex-specific cut-offs should also be considered as the reference intervals of normal calcitonin levels for women and men significantly differ [4, 5, 29]. In the current situation where there is an apparent lack of harmonization among the calcitonin measurement methods, the same instrument should be used to obtain the follow-up calcitonin concentration for a patient. Moreover, it is recommended that each laboratory use method-specific reference interval rather than universal cut-off for clinical decision.
This study had several limitations. First, we compared only three assays that use the CLIA method. Thus, further studies evaluating the equivalence among more assays using different test principles are warranted. Second, as the clinical information of patients was not available, we could not accurately identify the assay that provided clinically reliable results when there were discrepancies in the classification based on concentration.
The results of this study showed that, although three automated calcitonin immunoassays showed acceptable correlations for the full analytical measurement range, the correlation and agreement were limited at low concentration ranges, especially at the clinical decision threshold (10 pg/mL). Hence, continuous joint efforts by the expert scientific community, manufacturers, and regulatory organizations are imperative for improved standardization and harmonization of the calcitonin tests to avoid unnecessary and costly additional testing or absence of testing that may lead to a missed diagnosis of cancer. A single instrument should be consistently used when following-up a patient to avoid the effect of systemic bias among the instruments.
Go to :
 XML Download