This article has been
cited by other articles in ScienceCentral.
Abstract
Background
Automated urine sediment analysis has been developed to address the limitations of microscopic examination of dysmorphic red blood cells (RBCs). We evaluated the urinary RBC distribution (URD) parameter of a recently launched automated urinary flow cytometry analyzer, UF-5000 (Sysmex, Kobe, Japan), to differentiate glomerular hematuria (GH) from non-GH (NGH).
Methods
Samples submitted for urine sediment analysis from patients with hematuria (>20 RBCs/μL) were divided into derivation (N=156; 101 GH, 55 NGH) and validation cohorts (N=107; 60 GH, 47 NGH). The clinical diagnosis of GH or NGH was established based on clinical data review. Differences in UF-5000 parameters (URD, small RBC, lysed RBC, RBC-P70FSC, RBC-SF-FSC-W, mean forward-scattered light, and mean side-scattered light) between GH and NGH, and areas under the ROC curves (AUC) were analyzed in the derivation cohort. The derived ideal cut-off value was evaluated in the validation cohort. We applied the Kitasato criteria to compare the diagnostic performance.
Results
URD (%), differed significantly between GH and NGH (P<0.001) in the two cohorts. The AUC of URD was 0.814 and 0.806 in the derivation and validation cohorts, respectively. Using a cut-off of >20.1%, the sensitivity was 99.0%/89.4% and the specificity was 50.9%/63.3% in the derivation/validation cohort. When the Kitasato criteria were applied, the sensitivity and specificity were 80.2% and 52.7%, respectively.
Conclusions
URD is a rapid, objective, and quantitative measure that can be used to differentiate GH and NGH.
Go to :

Keywords: Glomerular hematuria, Urinary RBC distribution, Automated urinary flow cytometry analyzer, UF-5000
INTRODUCTION
Microscopic hematuria is a relatively common characteristic of renal or urological disorders with a reported prevalence of 0.18%–16.1% according to population-based studies [
1–
3]. It can be classified as either glomerular hematuria (GH) or non-glomerular hematuria (NGH). For initial triage of patients presenting with microscopic hematuria, a method that can accurately discriminate GH from NGH is of great value to increase the efficiency and effectiveness of clinical work-up and management.
Pathophysiologically, GH is caused by damage to the glomer1ular filtration barrier (GFB). Hence, an increase in the number of dysmorphic red blood cells (RBCs), which are distorted RBCs resulting from egression through the disrupted GFB, in the urine indicates GH [
4]. Manual microscopic urine examination remains the gold standard for the identification and enumeration of dysmorphic RBCs. However, it is time-consuming, labor-intensive, and associated with wide inter-observer variation, hampering standardization. Automated analyzers for urine sediment analysis have been evaluated as an alternative for differentiating GH from NGH [
5–
12].
There have been conflicting results regarding the usefulness and practicability of automated analyzers for differentiating GH from NGH. It would be of major clinical value if a rapid, robust, and standardized method that can accurately differentiate both types of hematuria could be incorporated into the laboratory workflow. The third-generation automated flow cytometry analyzer UF-5000 (Sysmex, Kobe, Japan), launched in 2015, introduced a new parameter for measuring RBC size, i.e., urinary RBC distribution (URD). We evaluated UF-5000, including URD, for its diagnostic performance in differentiating GH from NGH.
Go to :
METHODS
Patients
This study included patient samples submitted for urine sediment analysis to the Department of Laboratory Medicine at Seoul St. Mary’s hospital between August and November 2019. Samples submitted between August and September 2019 were used as a derivation cohort, and samples submitted between October and November 2019 were used as a validation cohort. In the derivation cohort, differences in UF-5000 parameters between GH and NGH were analyzed, and using ROC curves, an ideal cut-off value was derived, which was validated in the validation cohort. The inclusion and exclusion criteria were as follows
(
Fig. 1): only samples with hematuria (corresponding to >20 RBCs/μL as measured using UF-5000) were included for analyses. Samples were excluded if sufficient data for GH or NGH classification were unavailable or if the cause of hematuria remained inconclusive. When multiple samples were obtained from the same patient, only the initial sample was included. In total, 156 samples from both in- and out-patients were included in the derivation cohort: 101 samples (64.7%) from patients with GH and 55 samples (35.3%) from patients with NGH (
Table 1). Most samples were requested from the nephrology (67.3%) and urology (15.4%) departments.
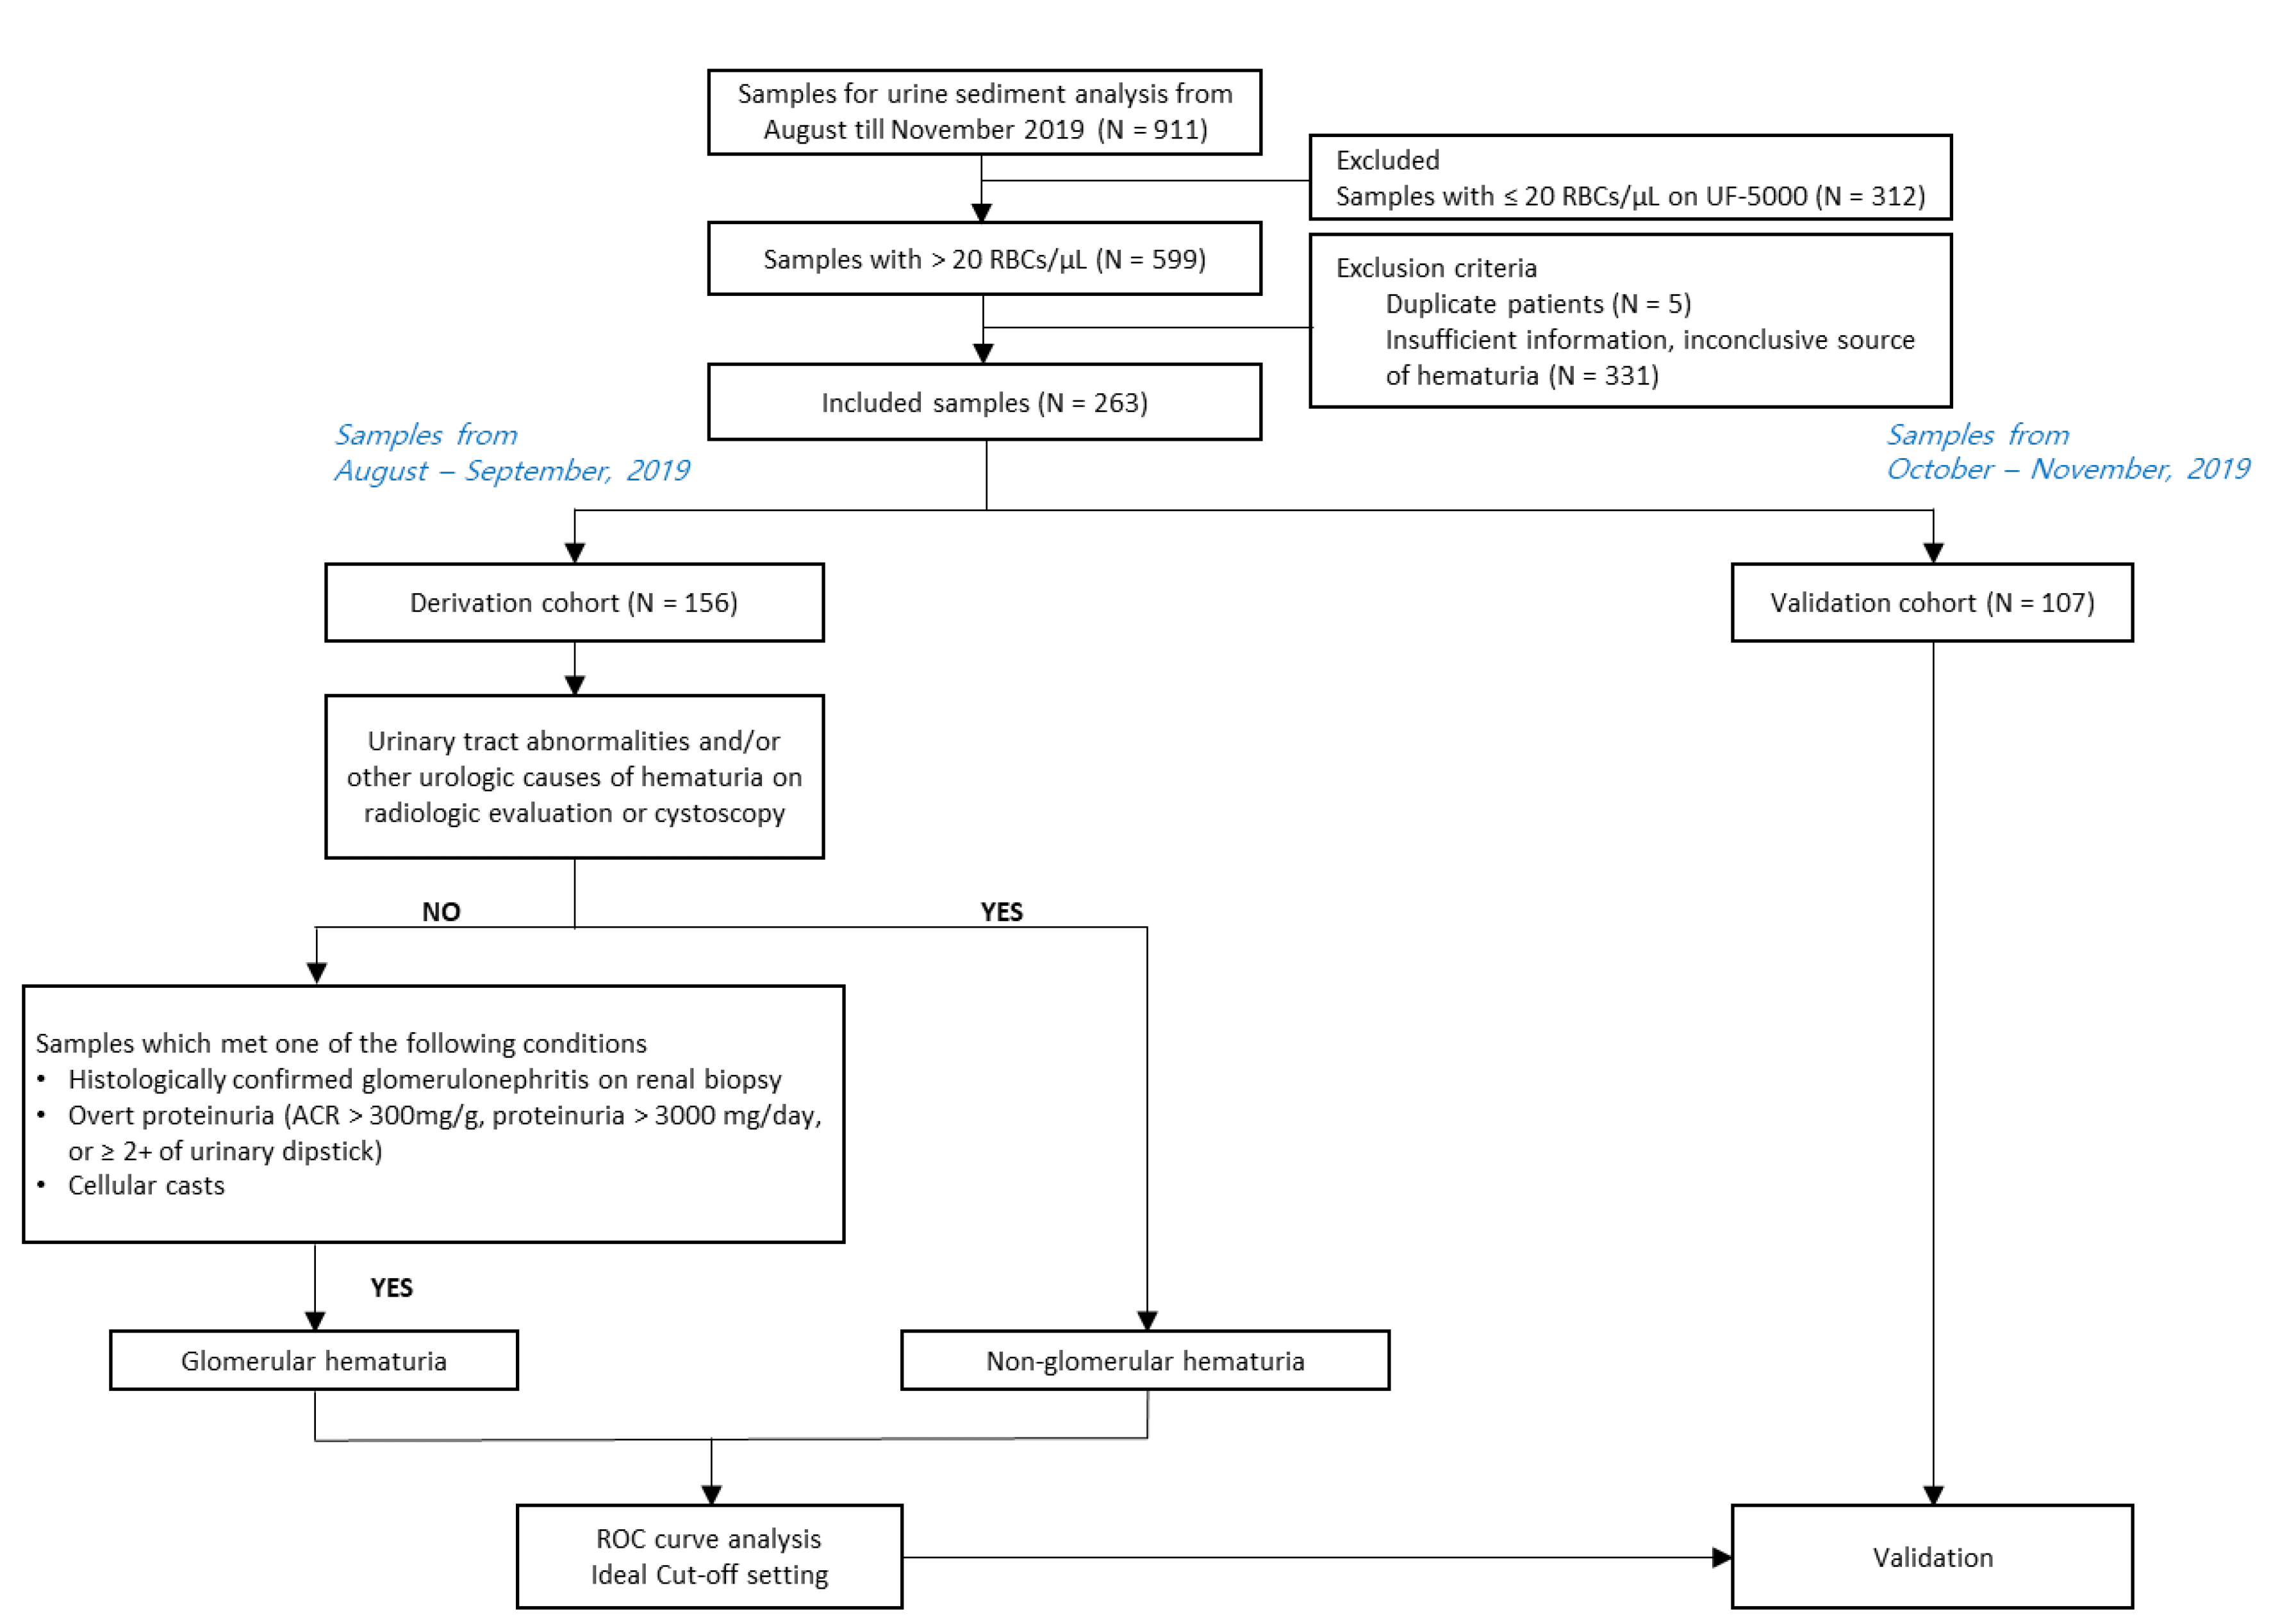 | Fig. 1
Flow chart of the study design.
Abbreviation: ACR, albumin: creatinine ratio.

|
Table 1
Clinical characteristics of patients with GH and NGH in the derivation and validation cohorts
|
Derivation cohort |
Validation cohort |
|
GH |
NGH |
P
|
GH |
NGH |
P
|
|
Number of patients |
101 |
55 |
|
47 |
60 |
0.001 |
|
Male, N (%) |
44 (43.6) |
31 (56.4) |
0.126 |
25 (53.2) |
37 (61.7) |
0.380 |
|
Age (yr), median (IQR) |
51 (36–64) |
65 (49–72) |
0.001 |
55 (20–91) |
60.5 (6–85) |
0.945 |
|
RBC count (/μL), median (IQR) |
65.1 (29.7–122.2) |
89.8 (39.0–914.1) |
0.003 |
73.1 (33.0–219.9) |
102.65 (39.8–781.1) |
0.215 |
|
Dysmorphic RBC (%), N (%)*
|
|
|
<0.001 |
|
|
0.143 |
|
0% |
30 (38.5) |
17 (73.9) |
|
11 |
10 |
|
|
1%–10% |
37 (47.4) |
5 (21.7) |
|
15 |
5 |
|
|
11%–20% |
7 (9.0) |
1 (4.3) |
|
0 |
1 |
|
|
21%–30% |
2 (2.6) |
0 |
|
0 |
0 |
|
|
>31%–40% |
2 (2.6) |
0 |
|
0 |
0 |
|
|
Urinary protein concentration (mg/L), median (IQR)†
|
471 (228–1,200) |
150 (102–813) |
0.017 |
510 (111–15.5) |
207 (79–468) |
0.061 |
|
Urinary dipstick scores of protein, N (%)‡
|
|
|
0.003 |
|
|
<0.001 |
|
Negative |
24 (23.8) |
28 (50.9) |
|
14 (29.8) |
37 (61.7) |
|
|
Trace |
17 (16.8) |
1 (1.8) |
|
4 (8.5) |
7 (11.7) |
|
|
1+ |
28 (27.7) |
15 (27.3) |
|
9 (19.1) |
13 (21.7) |
|
|
2+ |
7 (6.9) |
4 (7.3) |
|
8 (17.0) |
0 |
|
|
3+ |
9 (8.9) |
4 (7.3) |
|
12 (25.5) |
2 (3.3) |
|
|
4+ |
16 (15.8) |
3 (5.5) |
|
0 |
1 (1.7) |
|

Urine samples were collected using the clean catch method, and only fresh samples (within an hour of sample collection) with a sufficient volume (≥10 mL) were included. On arrival, the samples were aliquoted; one aliquot was used for manual microscopic examination, and a second aliquot for automated urine sediment analysis. This study was approved by the Institutional Review Board of Seoul St. Mary’s Hospital (KC18DESI0634) and was granted a waiver of informed consent.
The consensus clinical diagnosis of GH or NGH was established based on independent review of clinical data by two experienced physicians according to published guidelines and recommendations [
4,
13] (
Fig. 1). GH was assumed in the following conditions: histologically confirmed glomerulonephritis on kidney biopsy, presence of overt proteinuria (albumin:
creatinine ratio (ACR) >300 mg/g, >3,000 mg/day proteinuria, or urinary dipstick score of protein ≥2+), presence of cellular casts, without evidence of urinary tract abnormalities on radiologic evaluations or cystoscopy. NGH was inferred in patients with urinary tract abnormalities and/or other urological causes of hematuria, such as urolithiasis on radiologic evaluation or cystoscopy.
Urinalysis and microscopic urine examination
Urine chemistries, including urinary protein (mg/L), albumin (mg/L), and creatinine (mmol/L) concentrations, were measured using a Hitachi 7600-110 automated chemical analyzer (Hitachi High-Tech Co., Tokyo, Japan). Urinary protein concentration was measured using the pyrogallol red method (Wako Pure Chemical Industries, Osaka, Japan), urinary albumin using the immuno-turbidimetric method (Roche Diagnostics, Indianapolis, IN, USA), and urinary creatinine (mg/dL) using the Jaffe method (Roche Diagnostics). Urine strip tests were performed using a URiSCAN Super plus analyzer (YD diagnostics, Yongin, Korea). The urinary ACR was calculated as the urinary albumin concentration divided by the urinary creatinine concentration and the protein: creatinine ratio (PCR) was calculated as the urinary protein concentration divided by the urinary creatinine concentration.
Microscopic urine examination was performed using a bright-field microscope according to the recommendations in the CLSI guidelines [
14]. Briefly, a well-mixed urine sample in a conical tube was centrifuged at 400×g for 5 minutes, and the supernatant was discarded, leaving 0.5 mL of urine sediment. The urine sediment was gently resuspended, and a drop (15–20 μL) of the sediment was placed onto a glass slide and covered with an 18×18-mm2 coverslip. All fields were first screened at low power (×100) to assess particle distribution, and dysmorphic RBCs were counted in high-power fields (×400). According to our laboratory protocol, urinary RBCs consistent with acanthocytes and their variants were identified as dysmorphic RBCs, according to the classification of Bessis (e.g., ring form with vesicle-shaped protrusions); other forms, such as echinocytes and ghost forms were excluded [
15–
17]. The percentage of dysmorphic RBCs was graded as follows: 0%, 1%–10%, 11%–20%, 21%–30%, 41%–50%, 51%–60%, 61%–70%, 71%–80%, 81%–90%, and 91%–100%. The microscopic examinations were carried out by two technicians independently.
Automated urine sediment analysis using a UF-5000 flow cytometry analyzer
UF-5000 is a third-generation automated flow cytometry analyzer for urine sediment analysis [
18], and compared with the previous model, UF-1000i (Sysmex, Kobe, Japan), a new blue semiconductor laser beam (wavelength: 488 nm) is used. The analyzer utilizes fluorescence flow cytometry and hydrodynamic focusing in two types of channels: a surface channel (SF) and a core channel (CR). Particles are identified and classified according to algorithms based on four types of signals: forward-scattered light (FSC), side-scattered light (SSC), side fluorescence (SFL), and depolarized side-scattered light (DSS). Urine sediment was analyzed according to the manufacturer’s instructions, using 450 μL of urine sample. Hematuria was defined as >20 RBCs/μL per the manufacturer’s specifications.
Parameters related to RBC size, internal structure, and number incorporated in the UF-5000 analyzer were compared between patients with GH and those with NGH. These included “URD,” “small RBC,” “lysed RBC,” “RBC-P70FSC,” “RBC-SF-FSC-width (W)” (equivalent to RBC-FSC-distribution width in UF-1000i), mean FSC, and mean SSC. Briefly, “small RBC” represents RBCs having an FSC intensity <70, and “lysed RBC” represents morphologically unstable RBCs by SSC. The newly introduced parameter, “URD” is obtained by dividing the number of “small RBC” by the number of non-lysed RBCs. “RBC-P70FSC” is an index of RBC size and is defined as the FSC channel number under which the smaller 70% of the RBCs in the sample are distributed. “RBC-SF-FSC-W” is an index of RBC size variation and indicates the range of FSC distribution in the central portion of the FSC histogram under which the central 60% of the RBCs are distributed. In addition, we analyzed the effect of adding proteinuria to URD (%) on improving the specificity using urine strip protein results ≥2+.
Comparative analysis using the Kitasato criteria
We compared the diagnostic performance of the parameters against that of the Kitasato criteria [
19]. The Kitasato criteria utilize the glomerular discrimination point and non-glomerular discrimination point, defined as an FSC intensity of 126 channels (6 μm) and 84 channels (4 μm), respectively. According to these criteria, if >80% of all RBCs are ≤126 channels and <80% are ≥84 channels, hematuria is regarded glomerular [
19,
20]. If >80% of all RBCs are ≥84 channels, hematuria is regarded non-glomerular. If <80% are ≤126 channels and <80% are ≥84 channels, hematuria is regarded mixed.
Statistical analysis
Qualitative data are presented as percentages, and quantitative data are presented as medians and interquartile ranges (IQRs) for non-normally distributed data. Normality was assessed using the D’Agostino-Pearson normality test. Chi-square and Mann-Whitney tests were used to compare categorical variables and continuous variables, respectively. The Mann-Whitney test was used to assess the differences in UF-5000 parameters between GH and NGH. Non-parametric Spearman rank correlation was used to test the correlation between URD (%) and dysmorphic RBC (%). ROC curve analysis was performed to assess the performance of UF-5000 parameters in differentiating GH and NGH. All statistical analyses were performed using MedCalc 19.1.3 (MedCalc Software, Ostend, Belgium), and a two-tailed P≤0.05 was considered statistically significant.
Go to :
RESULTS
In the derivation cohort, the median RBC counts in GH and NGH were 65.1/μL (29.7–122.2) and 89.8/μL (39.0–914.1), respectively (P=0.003). Due to the significant difference in RBC counts between the groups, for parameters that are based on absolute RBC counts, relative proportions were compared unless specifically noted.
Urinary protein concentrations were significantly higher (P=0.017) in the GH group (471 mg/L) than in the NGH group (150 mg/L). The urinary dipstick scores for protein were also significantly higher in the GH group than in the NGH group (P=0.003). The ACR and PCR were not significantly different between the GH and NGH groups (237.3 vs. 74.3 [P=0.207] and 0.47 vs. 0.23 [P=0.062], respectively). The median reported range of dysmorphic RBCs (%) was 1%–10% and 0% in the GH and NGH groups, respectively. However, there was no significant correlation between URD (%) and dysmorphic RBC (%) (ρ=−0.05, P=0.618), and the agreement rate between URD (%) >20.1% and dysmorphic RBC (%) >0% was 58.4%.
The median and IQR values of UF-5000 parameters for the GH and NGH groups are summarized in
Table 2. Parameters associated with RBC size (URD (%), small RBC (%), and RBC-P70FSC) were significantly different between the two groups (
P<0.001). The proportion of small-sized RBCs was significantly higher in the GH group than in the NGH group based on URD (%) (61.2% vs. 20.1%) and small RBC (%) (55.9% vs. 19.6%). This difference in proportion was reflected in significantly lower median values of RBC-P70FSC (100 vs. 145) and mean FSC values (83 vs. 120) in the GH group than in the NGH group. The proportion of lysed RBCs (3.8% vs. 1.0%) and variability in the distribution of RBC-SF (48 vs. 36) were higher in the GH group than in the NGH group (
P<0.001 and
P=0.009, respectively).
Table 2
Distribution of UF-5000 parameters in GH and NGH patients in the derivation and validation cohorts
|
Parameter |
Derivation cohort |
Validation cohort |
GH
Median value (IQR) |
NGH
Median value (IQR) |
P
|
GH
Median value (IQR) |
NGH
Median value (IQR) |
P
|
|
URD (%) |
61.2 (44.1–84.1) |
20.1 (1.9–52.1) |
<0.001 |
49.5 (38.9–64.6) |
9.6 (2.7–38.0) |
<0.001 |
|
Small RBC (%) |
55.9 (42.6–68.4) |
19.6 (1.9–49.0) |
<0.001 |
46.7 (38.5–63.3) |
9.5 (2.7–36.3) |
<0.001 |
|
Lysed RBC (%) |
3.8 (1.2–8.6) |
1.0 (0.2–3.7) |
<0.001 |
2.2 (0.6–7.8) |
1.0 (0.1–3.1) |
0.010 |
|
RBC-P70FSC (ch) |
100 (76.8–111.5) |
145 (107.0–163.0) |
<0.001 |
110 (93.0–130.0) |
154 (115.0–165.5) |
<0.001 |
|
RBC-SF-FSC-W (ch) |
48 (40.0–60.0) |
36 (24.0–61.5) |
0.009 |
50 (42.0–66.0) |
35 (24.0–45.5) |
<0.001 |
|
Mean FSC*
|
83 (65.5–95.0) |
120 (90.3–148) |
<0.001 |
- |
- |
- |
|
Mean SSC*
|
79.5 (57.5–105.5) |
81 (60.5–97.2) |
0.897 |
- |
- |
- |
Cut-off values were derived from ROC curve analysis based on the greatest diagnostic accuracy, and diagnostic sensitivity and specificity were assessed (
Table 3). The greatest area under the curve (AUC) values were obtained for URD (%) (0.814), small RBC (%) (0.814), RBC-P70FSC (0.815), and mean FSC (0.798), without statistically significant differences among the AUC values (
Fig. 2). These four UF-5000 parameters are all associated with RBC size and had a significantly higher diagnostic performance than the other parameters, including lysed RBC (%), RBC-SF-FSC-W (%), dysmorphic RBC (%), and urinary protein concentration. Because no significant difference was observed in the diagnostic performance of the four parameters associated with RBC size, URD (%) was used as the representative UF-5000 parameter for further assessment of the diagnostic sensitivity and specificity. The ideal URD (%) cut-off value for the screening of GH was 20.1%, and the sensitivity and specificity at this cut-off value were 99.0% and 50.9%, respectively. However, when the Kitasato criteria were applied, the sensitivity and specificity in diagnosing GH were 80.2% and 52.7%, respectively. When the presence of proteinuria by urine strip analysis (≥2+) was incorporated as an additional diagnostic criterion for GH, the number of false-positive cases decreased from 27 to 1 (
Table 4).
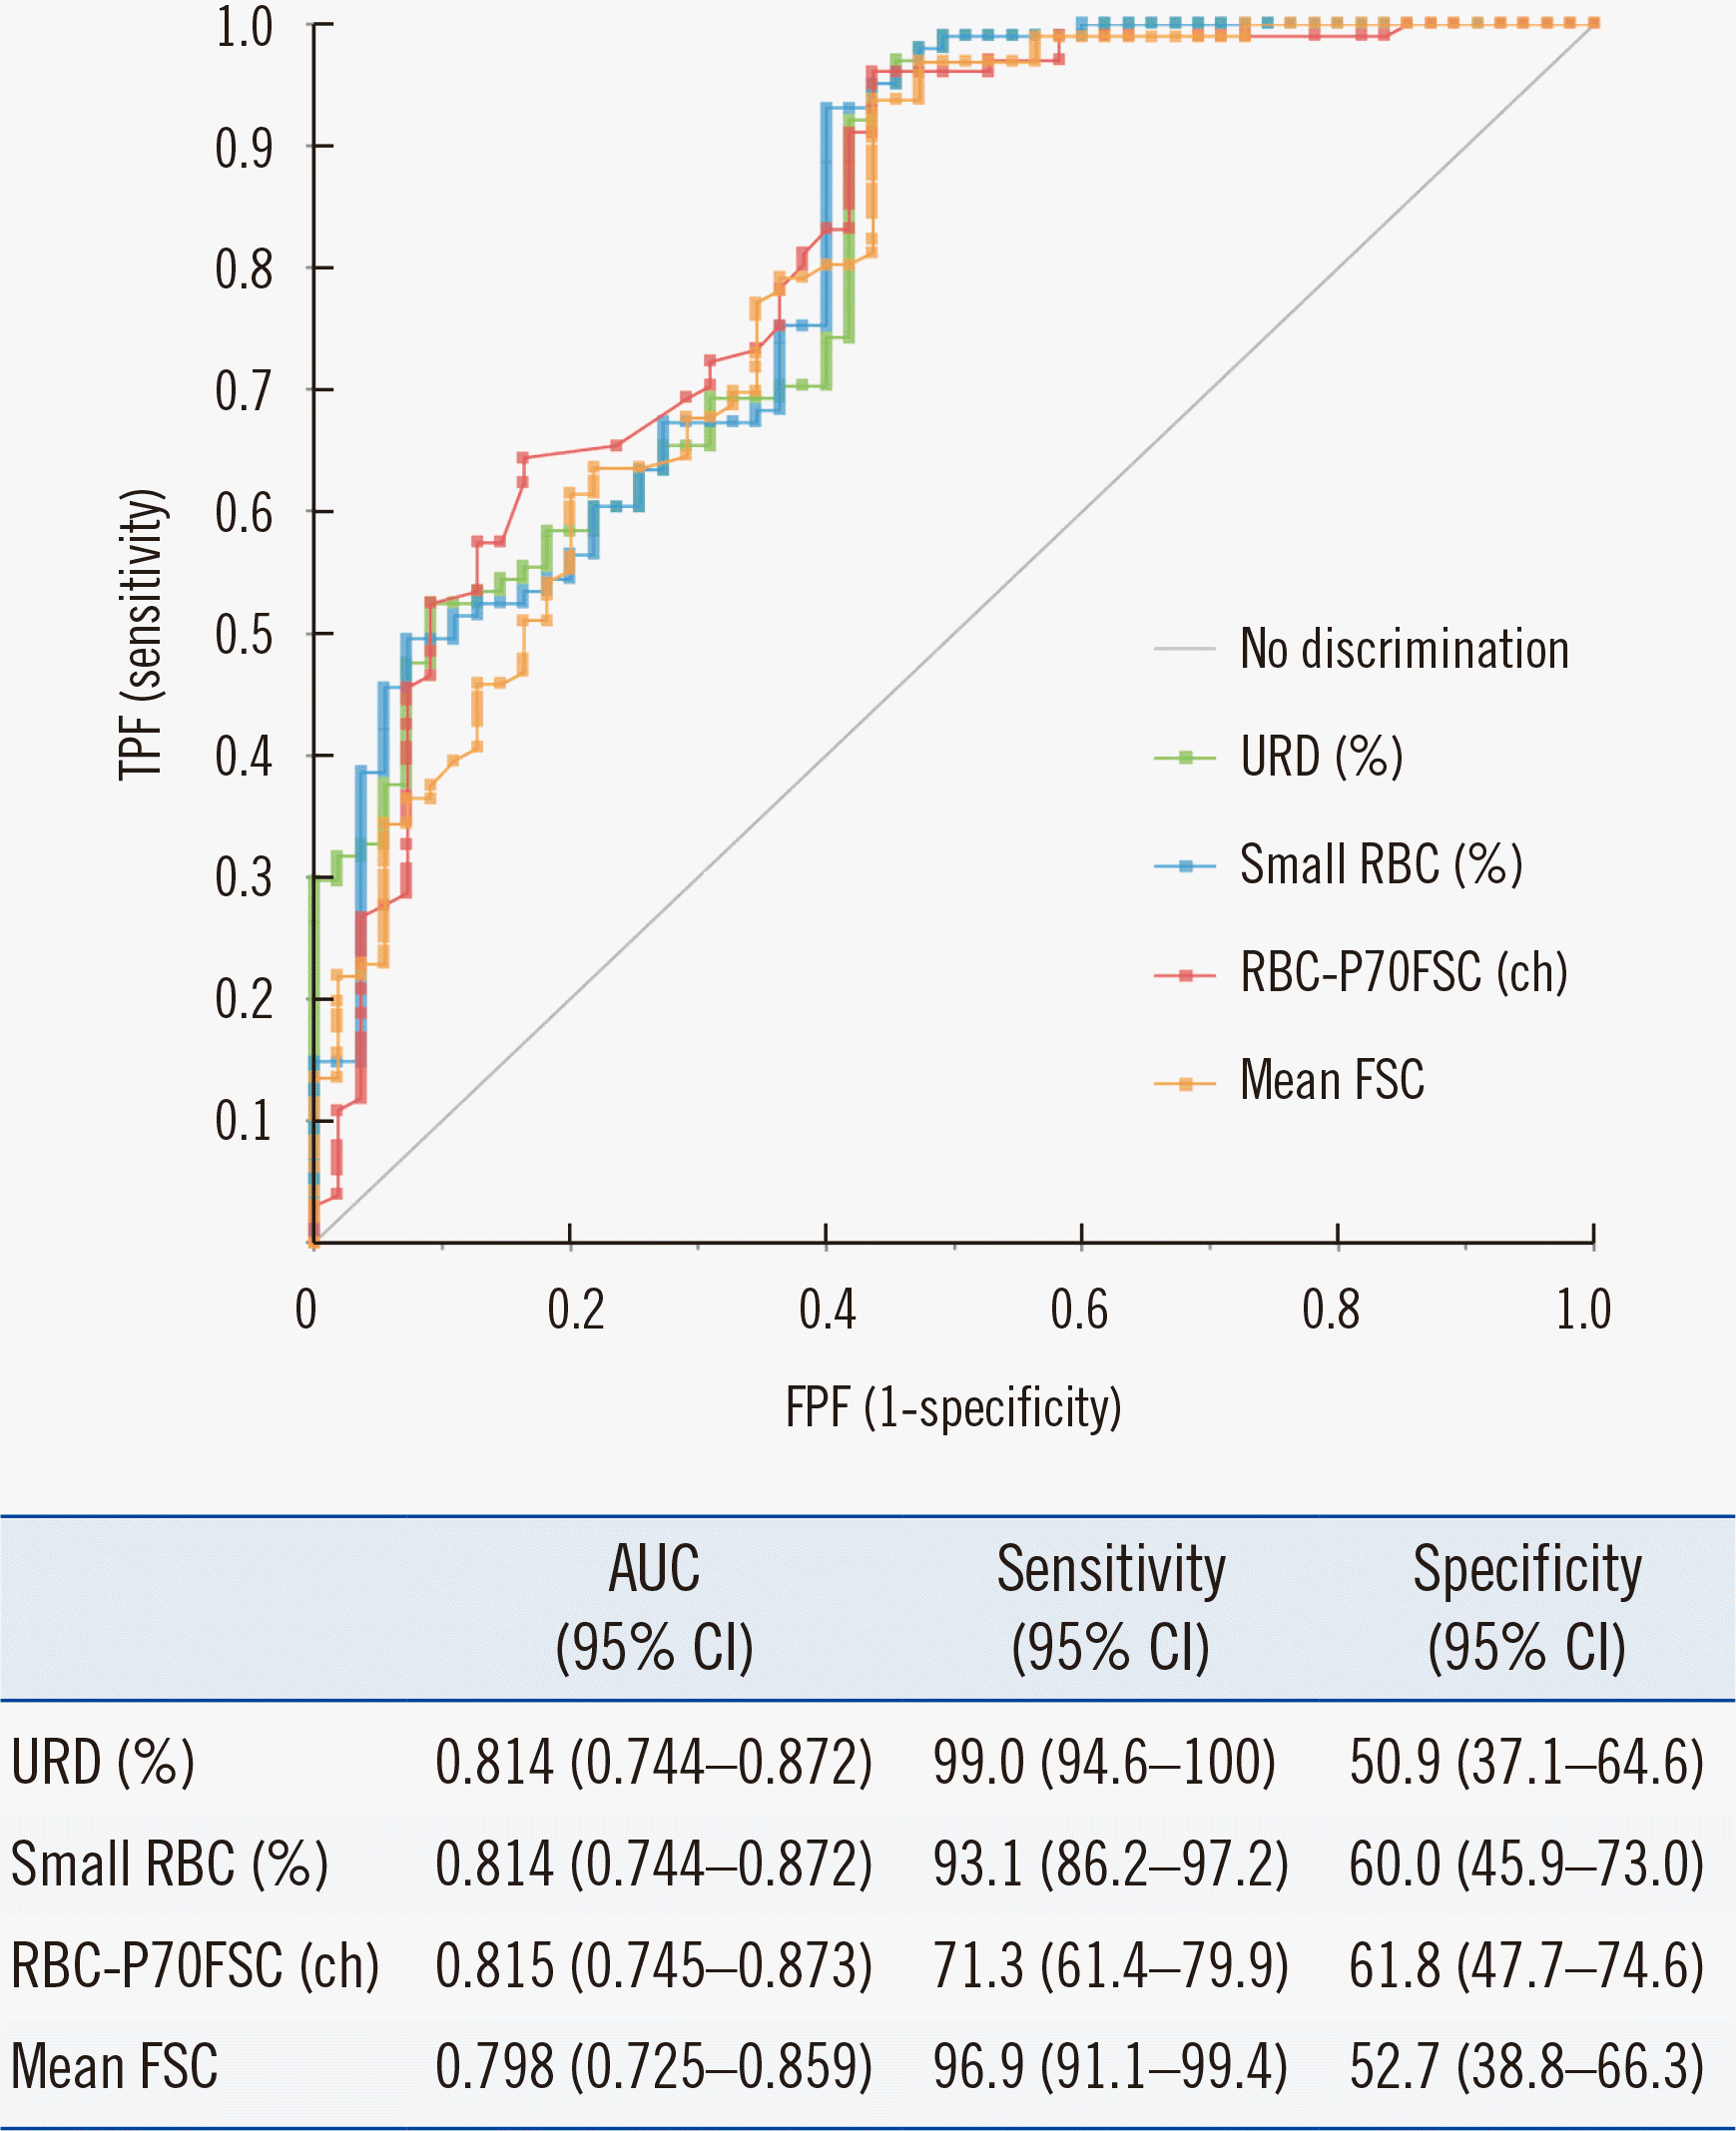 | Fig. 2
ROC curves and AUC values obtained with URD (%) (0.814), small RBC (%) (0.814), RBC-P70FSC (0.815), and mean FSC (0.798) parameters in the derivation cohort.
Abbreviations: AUC, area under the curve; URD, urinary RBC distribution; RBC, red blood cell; FSC, forward-scattered light; TPF, true-positive fraction; FPF, false-positive fraction.
|
Table 3
Performance of UF-5000 parameters, dysmorphic RBC (%), and urinary protein concentration for GH in the derivation and validation cohorts
|
AUC (95% CI) |
P
|
Ideal cut-off |
Derivation cohort |
Validation cohort*
|
|
Sensitivity% (95% CI) |
Specificity% (95% CI) |
Sensitivity% (95% CI) |
Specificity% (95% CI) |
|
URD (%) |
0.814 (0.744–0.872) |
<0.001 |
>20.1 |
99.0 (94.6–100) |
50.9 (37.1–64.6) |
89.4 (76.9–96.5) |
63.3 (49.9–75.4) |
|
Small RBC (%) |
0.814 (0.744–0.872) |
<0.001 |
>30.1 |
93.1 (86.2–97.2) |
60.0 (45.9–73.0) |
83.0 (69.2–92.4) |
68.3 (55.0–79.7) |
|
Lysed RBC (%) |
0.704 (0.626–0.774) |
<0.001 |
>1.7 |
71.3 (61.4–79.9) |
61.8 (47.7–74.6) |
53.2 (38.1–67.9) |
65.0 (51.6–76.9) |
|
RBC-P70FSC (ch) |
0.815 (0.745–0.873) |
<0.001 |
≤138 |
96.0 (90.2–98.9) |
56.4 (42.3–69.7) |
83.0 (69.2–92.4) |
65.0 (51.6–76.9) |
|
RBC-SF-FSC-W (ch) |
0.627 (0.546–0.703) |
0.017 |
>30 |
93.1 (88.2–97.2) |
43.6 (30.3–57.7) |
87.2 (74.3–95.2) |
53.3 (40.0–66.3) |
|
Mean FSC†
|
0.798 (0.725–0.859) |
<0.001 |
≤113 |
96.9 (91.1–99.4) |
52.73 (38.8–66.3) |
- |
- |
|
Dysmorphic RBC (%)‡
|
0.683 (0.583–0.772) |
<0.001 |
>0 |
61.5 (49.8–72.3) |
73.9 (51.6–89.8) |
57.7 (36.9–76.7) |
37.5 (15.2–64.6) |
|
Urinary protein concentration (mg/L)§
|
6.78 (5.83–7.63) |
0.021 |
>190 |
800 (705–875) |
667 (410–867) |
702 (551–827) |
483 (295–675) |
Table 4
Diagnostic performance of URD (%) >20.1% in the derivation and validation cohorts
|
Cohort |
AUC
(95% CI) |
Sensitivity%
(95% CI) |
Specificity%
(95% CI) |
RBC count |
Type of hematuria |
%URD*
|
%URD and proteinuria†
|
|
Positive |
Negative |
Sensitivity (95% CI) |
Specificity (95% CI) |
Positive |
Negative |
Sensitivity
(95% CI) |
Specificity
(95% CI) |
|
Derivation cohort (N=156) |
0.814
(0.744–0.872) |
99.0
(94.6–100) |
50.9
(37.1–64.6) |
20–100/μL (N=99) |
Glomerular (N=70) |
70 |
0 |
100
(94.9–100.0) |
20.7
(8.0–39.7) |
20 |
50 |
28.6
(18.4–40.6) |
96.6
(82.2–99.9) |
|
Non-glomerular (N=29) |
23 |
6 |
1 |
28 |
|
≥100/μL (N=57) |
Glomerular (N=31) |
30 |
1 |
96.8
(83.3–99.9) |
84.6
(65.1–95.6) |
12 |
19 |
38.7
(21.9–57.8) |
100
(86.8–100) |
|
Non-glomerular (N=26) |
4 |
22 |
0 |
26 |
|
Validation cohort (N=107) |
0.806
(0.719–0.876) |
89.4
(76.9–96.5) |
63.3
(49.9–75.4) |
20–100/μL (N=57) |
Glomerular (N=27) |
26 |
1 |
96.3
(81.0–99.9) |
50
(31.3–68.7) |
8 |
19 |
29.6
(13.8–50.2) |
100
(88.4–100) |
|
Non-glomerular (N=30) |
15 |
15 |
0 |
30 |
|
≥100/μL (N=50) |
Glomerular (N=20) |
16 |
4 |
80.0
(56.3–94.3) |
76.7
(57.7–90.1) |
9 |
11 |
45.0
(23.1–68.5) |
100
(88.4–100) |
|
Non-glomerular (N=30) |
7 |
23 |
0 |
30 |
When samples were stratified based on the degree of hematuria, the specificity was much lower in samples with a lower degree of hematuria (20–100/μL; 20.7%) than in those with a higher degree of hematuria (>100/μL; 84.6%;
Table 4). In the validation cohort of 107 non-duplicate samples with similar demographic characteristics, URD (%) maintained good diagnostic accuracy, with an AUC of 0.806. When the URD (%) cut-off value of >20.1% was applied in the validation cohort, the sensitivity and specificity were 89.4% and 63.3%, respectively (
Table 4).
Go to :
DISCUSSION
UF-5000 parameters associated with RBC size, including URD (%), small RBC (%), and RBC-P70FSC, showed significant differences between GH and NGH. According to the ROC curve analysis, URD (%) revealed the highest AUC, and an ideal cut-off >20.1% was derived with 99.0% sensitivity and 50.9% specificity from the derivation cohort.
To address the limitations of microscopic examination of dysmorphic RBCs, an alternative method utilizing size distribution curves obtained using automated blood-cell analyzers has been developed [
21]. The development of a dedicated urine particle analyzer enabled quantitative measurement of the size distribution of urinary RBCs that could be easily implemented in clinical practice. Subsequently, automated urine analyzers have been evaluated in numerous studies for their ability to differentiate between GH and NGH [
8,
19,
20].
We evaluated diverse UF-5000 parameters for detection of hematuria as well as microscopic urinalyses and urine chemistry results. The highest AUC values were obtained for parameters associated with RBC size (URD (%), small RBC (%), RBC-P70FSC, and mean FSC), albeit without statistically significant differences among the AUCs. The fact that multiple size distribution parameters showed high AUCs underscores that RBC size is a very robust characteristic for identifying GH, regardless of the estimate selected. These parameters also had a significantly higher diagnostic performance than the others, such as dysmorphic RBC (%) and urinary protein concentration. Of note, dysmorphic RBCs (%) showed lower (61.5%) sensitivity and AUC than those reported in other studies [
5,
8]. There was no correlation between dysmorphic RBC (%) and URD (%). Possible reasons may include a conservative classification of dysmorphic RBCs (e.g., excluding echinocytes, anulocytes, ghost cells, schizocytes, stomatocytes, codocytes, and knizocytes), relative scarcity of urine samples with a high degree of hematuria and dysmorphic RBCs (%), and the semi-quantitative reporting scheme of dysmorphic RBCs used in this study. The robustness of the size characteristics of RBCs in GH together with the advantages of objective, accurate, and high-throughput analysis with an automated analyzer are major improvements compared with manual microscopy.
In urine chemistry analysis, urinary protein concentrations and urinary dipstick protein scores were significantly higher in the GH group than in the NGH group, but there were no significant differences in ACR and PCR between the two groups. Although ACR and PCR show better correlations with albumin and protein concentrations in 24-hour urine than with albumin and protein concentrations in spot urine, the relatively small number of samples with ACR and PCR values may have led to a decreased power and lack of statistical significance.
The sensitivity of URD (%) was highly satisfactory (99.0%) for GH screening; however, the specificity was not very high (50.9%). Compared with a previous study of small RBC parameters in the UF-1000i analyzer, the AUC of the new URD (%) parameter was higher (0.814 vs. 0.745), with significantly higher sensitivity (99.0% vs. 70.2%) [
5]. Notwithstanding the differences in the patient populations, the higher accuracy could at least in part be explained by the fact that using URD rather than the small RBC parameters benefits from a successful exclusion of lysed RBCs, which are known to shift the RBC size distribution curve to the left [
5,
19]. Notably, our single cut-off-based URD performed better in terms of sensitivity and specificity than the Kitasato criteria, which are major criteria in the differential diagnosis of GH and NGH. Hence, using a single cut-off value instead of the multiple Kitasato criteria makes integration into the laboratory workflow more feasible and eliminates samples that are classified as indeterminate or mixed, while providing comparable sensitivity and specificity [
8].
Based on the high sensitivity and low specificity, URD (%) cannot be solely used to discriminate GH from NGH, as Scharnhorst,
et al. [
8] have also reported. Hence, the primary use of URD (%) supported by the present study is in excluding NGH samples. When we applied proteinuria (urinary dipstick ≥2+) as an additional criterion, the number of false-positive cases decreased substantially. In addition, specificity was substantially higher in samples with a higher degree of hematuria (>100/μL) than in those with a lower degree of hematuria (20–100/μL). Therefore, the accuracy of URD (%) in detecting GH can be improved in samples with a higher degree of hematuria (>100 RBC). For samples with a lower degree of hematuria, additional tests, such as microscopic analysis of dysmorphic RBCs and RBC casts, and urinary protein concentration measurement, should be incorporated in the confirmatory diagnostic algorithm when evaluating the origin of hematuria in the clinical laboratory.
This study had several limitations. Because test results other than urine sediment analysis using UF-5000 were obtained by clinical data review, some samples had missing values for parameters, such as dysmorphic RBCs (%) and urinary ACR and PCR. In addition, we did not include samples with a mixed type of hematuria and thus, the performance of URD (%) in this subgroup of hematuria was not evaluated. This may limit the generalizability of the study results, especially if a laboratory serves a population where mixed type hematuria constitutes a substantial proportion of patients with hematuria.
In conclusion, the URD (%) parameter in the automated urine analyzer UF-5000 provides a rapid, objective, and quantitative measure for excluding NGH samples from microscopic analysis and can be efficiently implemented into the laboratory workflow of microscopic hematuria.
Go to :


 PDF
PDF Citation
 Print
Print


 XML Download