

 PDF
PDF Citation
 Print
Print


INTRODUCTION
Since the first coronavirus disease 2019 (COVID-19) suspected case was reported on December 8, 2019, in Wuhan, as of May 6, 2021, the number of confirmed cases worldwide has surpassed 155 million cases, with 3.2 million deaths.12 Amid the unprecedented challenges from COVID-19, governments have more significant demands for data and statistics to navigate through the crisis.
Mortality is a primary outcome measure to assess the impact of COVID-19 on society across the country. With the number of COVID-19 cases, mortality provides a league table to compare policy responses to COVID-19 among countries. As of December 2020, there have been almost 900 deaths (1.8 per 100,000 people) related to COVID-19 in Korea, which is the lowest level compared to other OECD (Organization for Economic Co-operation and Development) countries with populations exceeding 5 million and greater than $25,000 GDP (Gross Domestic Product) per capita.3
However, just because the COVID-19 deaths are low does not mean that the country has been relatively less affected by COVID-19. Since governments have different rules about recording COVID-19 confirmed cases and deaths, a cross-country comparison of mortality is likely to be misinterpreted. For example, the COVID-19 deaths can be either underreporting or over-reporting, depending on how to assign the cause of death.4 Also, the numbers of the COVID-19 cases and deaths can be strongly affected by countries' testing capacity.5 However, excess mortality, which compares all-cause deaths before and after the pandemic within a country, can be an alternative to overcome this challenge. Moreover, assuming that the incidences of other diseases and accidents that may affect deaths other than COVID-19 are stable without rapid changes, the excess mortality could be a comparative method to assess the countries' performances with different policy responses to COVID-19 in a more comprehensive way.
Also, in order to understand the full extent of the health impact on population health, indirect impact as well as direct impact on mortality should be assessed. There are increasing concerns about the indirect impacts of COVID-19, which are caused by missed or delayed care, reduced health and social care, and psychological and economic consequences of the pandemic.6 The excess all-cause mortality can provide a more objective and unbiased estimate of the mortality burden of COVID-19.78 Countries, including South Korea, the United States, and Canada, have regularly measured and reported excess mortality.
South Korea reported more than 60,740 confirmed cases of COVID-19, including 900 deaths from January to December 2020.9 The first wave occurred with clusters in Daegu and Gyeongbuk Province in February and March. Then the second wave hit the country again in August and September around the capital area, including Seoul. The third wave in November and December spread out across the whole country. As each region, even in a country, has experienced different waves, the impact of COVID-19 is also uneven by region. In other words, a region with a higher incidence rate (IR) of COVID-19 would be more likely to have excess mortality compared to other regions.
Thus, the study aims to estimate national and regional excess all-cause mortality during the pandemic to investigate the impact of COVID-19 on mortality in Korea.
METHODS
Data source
This study obtained administrative data from the Korea Ministry of Interior and Safety (MOIS), which provides all-cause death data and population statistics based on resident registration.
We analyzed monthly all-cause death counts for Korean between January 2010 to December 2020, stratified by month and region. Region was classified into three groups according to the cumulative number of COVID-19 cases and IR reported by Korea Disease Control and Prevention Agency on December 31, 2020: 1) Capital Area (Seoul, Gyeonggi, and Incheon) with more than 10,000 cumulative cases or 90 cases per 100,000 people; 2) Daegu-Gyeongbuk Province with more than 7,000 cumulative cases or 80 cases per 100,000 people; and 3) the other areas. The cumulative numbers of COVID-19 cases per 100,000 people were 132 cases in the capital area, 198 cases in the Daegu-Gyeongbuk Province, and 53 cases in the other regions. The mortality rate was calculated per 100,000 population derived from the population statistics of the respective regions.
Estimating expected mortality in 2020
To assess whether excess mortality existed in 2020, we first need to estimate expected mortality in the absence of COVID-19. A quasi-Poisson regression model was fitted to monthly death data to estimate the expected number of deaths each month. The model included year and seasonal variation for capturing the time trend during the ten years. Seasonal variation referred to the four seasons in Korea: winter from December to February, spring from March to May, summer from June to August, and fall from September to November. We also adjusted the effect of cold waves that may increase mortality due to the extreme weather conditions in temperature in January. The average death count in the previous month was included in the model, as it could affect the monthly mortality in the month. In other words, in January 2020, we put the average death count in December over the past decade in the model. The population was included as an offset variable to correct for differences in population size among the regions.
(2)
E (Yr t) = β0 r + β1 Yeart + β2 Seasont + β3 CWt +β4 ln(ADt-1)+ β5 Impact 2020 + offset (ln(Pr t))Here, Yrt denotes the all-cause deaths for region r at month t. Year t and SVt is the year and the season at time t. CWt is a dummy variable to indicate a cold wave, which is one in January and otherwise zero. Prt is the number of population for region r at time t. AD indicates the average death counts from 2010 to 2020 in the month t-1. The expected monthly death counts are obtained with model (1), and yearly death counts are given by summing up the counts for all months in 2020. In addition, we set up model (2) added ‘impact 2020’ to the variables in the model (1) to assess whether the annual mortality changed significantly in 2020.
We determined the model with lower AIC (Akaike Information Criteria) and the mean deviance (deviance/df) closed to one to adjust for over-dispersion in the Poisson model. SAS Enterprise Guide 7.1 was utilized in all analyses.
Excess mortality in 2020
Excess mortality was obtained by comparing the observed mortality with the expected mortality. Average excess mortality was defined as the difference between the observed and expected mortality, and the range of excess mortality was calculated using a 95% confidence interval (CI) of the expected mortality. To compare with the COVID-19 deaths in 2020, excess death counts were also obtained by comparing the observed and expected death counts. The count is rounded to the nearest 10.
RESULTS
Excess mortality in 2020
The observed mortality in 2020 was 582.9 per 100,000 people, higher than the expected mortality of 582.3 but within the expected range (95% CI, 568.3–596.7) (Table 1). Thus, there was no significant excess all-cause mortality in 2020 at the national level compared to the previous ten years (P = 0.932). Similarly, excess mortality was not observed at the regional level. The observed mortality at each region in 2020 was 473.5 in the capital area, 719.6 in Daegu-Gyeongbuk Province, and 686.5 in the other regions, and all were within the expected ranges. The results indicate that the mortality in 2020 was similar to the historical trend (P = 0.878, 0.152, and 0.825, respectively).
Table 1
National and regional mortality in 2020
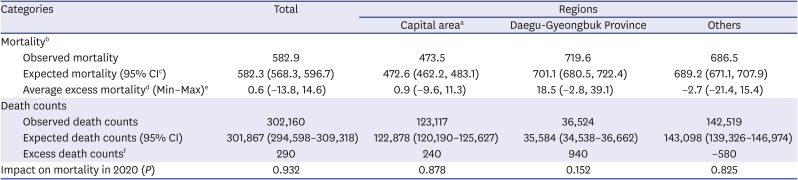
CI = confidence interval.
aCapital area: Seoul, Gyeonggi, and Incheon; bMortality: the number of deaths per 100,000 people; c95% confidence interval, lower – upper; dAverage excess mortality = Observed mortality – Expected mortality; eRange of Excess mortality = Observed mortality – the upper (lower) limit of 95% CI of expected mortality; fExcess death count = Observed death count – the expected death counts.
*P < 0.05, **P < 0.01, ***P < 0.001.
Meanwhile, we found that the number of deaths in 2020 exceeded 290 deaths than what we expected. Given that the official COVID-19 death counts were reported to be 900 deaths in 2020, it may suggest that 610 fewer deaths occurred than would be expected in 2020.
Monthly excess mortality in 2020
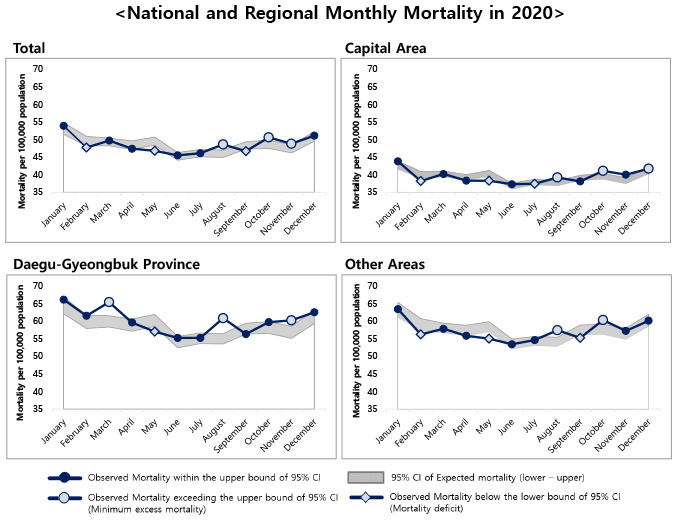
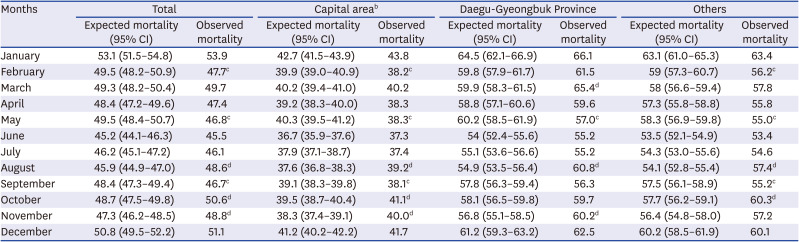
At the national level, the average excess mortality was higher in August, October, and November than in other months (Fig. 1). Monthly mortality in August, October, and November were 48.6, 50.6, and 48.8 per 100,000 people and exceeded the expected ranges of each month (95% CI of August, 44.9–47.0; 95% CI of October, 47.5–49.8; and 95% CI of November, 46.2–48.5) (Table 2) (Fig. 2).
Fig. 1
National and regional excess all-cause mortality in 2020.
Average excess mortality = Observed mortality − Expected mortality.
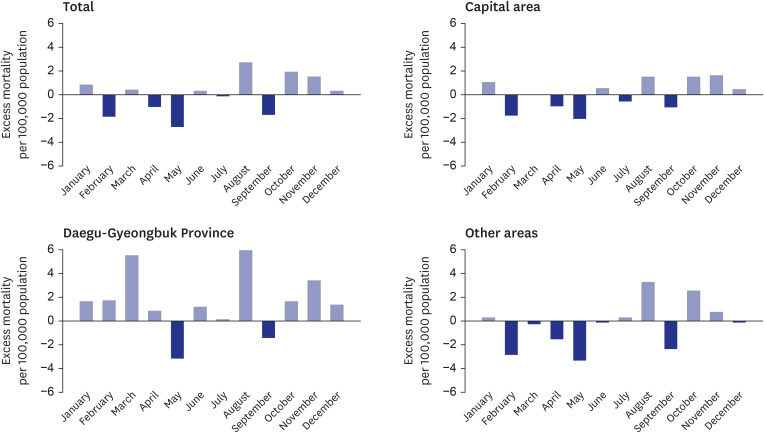
Table 2
National and regional monthly mortalitya in 2020

Furthermore, the result shows regional variations depending on the waves of the COVID-19 pandemic in Korea at the regional level. Mainly, Daegu-Gyeongbuk Province, the epicenter of Korea's outbreak, had a high average excess mortality (Table 2) (Figs. 1 and 2).
In March, while the mortality in the capital area and other areas were observed at previous average levels, the mortality in Daegu-Gyeongbuk Province exceeded the expected range (observed mortality, 65.4 per 100,000 people; 95% CI, 58.3–61.5). The monthly mortality in the Daegu-Gyeongbuk Province was the highest in March, except in January. In August, the average excess mortality was high in all regions. Notably, this month, the Daegu-Gyeongbuk Province showed the highest excess mortality across all regions and months (Observed mortality, 60.8 deaths per 100,000 people; 95% CI, 53.5–56.4). In October, all regions showed average excess mortality, and especially the capital area and other areas exceeded the expected range. The mortality in October was 41.1 in the capital area and 60.3 in other regions, and it exceeded the expected range (95% CI of the capital area, 38.7–40.4; 95 CI of other areas, 56.2–59.1). Finally, in November, the average excess mortality was identified in all regions. In particular, the mortality in November was 40.0 in the capital area and 60.2 in the Daegu-Gyeongbuk Province, which exceeded the expected range (95% CI of the capital region, 37.4–39.1; 95% CI of the Daegu-Gyeongbuk Province, 55.1–58.5).
DISCUSSION
This study explored the impact of COVID-19 on mortality using the all-cause death data from January 2010 to December 2020. We concluded that there were no significant differences in the mortality for 2020 compared to the previous years, and excess mortality did not exist at the national level in 2020. Since the COVID-19 deaths accounted for a tiny portion of the total deaths in 2020, assuming no change to other causes of deaths, the excess mortality might not be observed. Indeed, the COVID-19 IR, case fatality rate (CFR), and the COVID-19 deaths in Korea were relatively low compared to other countries. With 1,205 per 1 million people of IR and 1.49% of CFR, Korea reported only 1.8 deaths per 100,000 people as the COVID-deaths by December 31, 2020. Compared to other countries where excess mortality was not observed, such as Norway, New Zealand, and Denmark, CFR was similar to Korea in those countries (IR: 9,143, 448, and 28,333 per million people, respectively; CFR: 0.88%, 1.16%, and 0.79%, respectively; COVID-19 deaths: 8.0, 0.5, and 22.0 per 100,000 people, respectively).101112 In Denmark, the IR was high, but the COVID-19 death was relatively low. In contrast, Italy, the United Kingdom, and the United States, where excess mortality existed in 2020, reported higher IR, CFR, and COVID-19 deaths (IR: 34,851, 36,770, and 60,725 per million people, respectively; CFR: 3.52%, 2.95%, and 1.75%, respectively; COVID-19 deaths: 122.0, 106.4, and 100.9 per 100,000 people, respectively).4121314
However, we found differences in excess mortality by month. While the mortality in August, October, and November exceeded what we expected, the mortality in September was lower than the expected range. Furthermore, there were regional variations in the monthly excess mortality; the months in which excess deaths were identified differed by region. Daegu-Gyeongbuk Province experienced a cluster outbreak for the first wave caused by religious groups and showed excess mortality during that period. Similarly, the second wave began with a rally in Seoul in August, and the capital area showed excess mortality. Thus, monthly mortality in 2020 seems to be associated with the waves of the pandemic. It indicates that cluster outbreaks began with mass gatherings such as religious groups, rallies, families, and businesses, spread community transmission, and eventually caused regional variations in the outbreak of the COVID-19. It is consistent with the previous studies in the United States and Italy that suggested regional variations on excess mortality in the countries.1516171819
On the other hand, there are likely to be more impacts of the COVID-19 that are not yet visible. Indirect deaths resulting from interrupted care will not occur in a short time and therefore would have no immediate impact on mortality.20 However, it would be possible to detect the indirect impact of COVID-19 in cardiovascular emergencies such as acute myocardial infarction (AMI). For example, emergency care would be disrupted because of a surge in COVID-19 suspected patients and repeated closures of emergency departments, resulting in increased mortality risks among severe AMI patients. With a higher COVID-19 incidence than Korea, the United Kingdom identified excess mortality in cardiovascular conditions.11 Containment policies such as social distancing and self-isolation implemented to prevent the spread of COVID-19 could lead to a sharp decline in the supply and demand of essential healthcare services. It, in turn, would have a far-reaching impact on mortality through changes in morbidity, severity, and resource utilization.
This study contributes to the very timely discussion of excess mortality in Korea during the pandemic. There are few studies on it, and the results vary depending on the method to estimate the expected deaths. In this study, we used a quasi-Poisson regression to model count data. Our model is practically similar to the method in the national institutes of the United States, Canada, and Australian.212223
However, one of the previous studies,11 which estimated excess mortality across 29 countries using a Poisson model, shows that Korea had low but significant excess mortality. Their study also estimated that the excess death counts in 2020 were around 4,000, much higher than our estimate of 290. It is in contrast to our conclusion that no significant excess mortality existed in 2020 at the national level. It could be due to differences in the observation period and data analysis between the two studies. Firstly, Islam et al.'s study11 utilized a shorter baseline period (2016–2019) compared to ours (2010–2019). Secondly, Islam et al.'s study11 used weekly death data stratified by sex and age. They estimated the expected deaths by sex and age groups and aggregated it; thus, the yearly estimates could differ from ours, which used monthly death data for all ages. Lastly, Islam et al.'s study11 excluded periods of atypical mortality, such as heatwaves and influenza outbreaks, from the model. On the other hand, our study included all periods of the past decade, and instead included covariates in the model to adjust for observed seasonal patterns and the effect of cold waves. Cold wave, for example, reflects an environmental characteristic of Korea, where the mortality increases every January.
Meanwhile, the Statistics Korea compared the weekly number of deaths with the range (minimum-maximum) of death in the same week over the past three years and defined excess death occurred when the death counts exceed the maximum. They reported that deaths in some weeks of 2020, particularly in August, exceeded the maximum range of the previous three years. It is similar to our study, which shows a high average excess mortality in August. However, the method used by the Statistics Korea is not appropriate to reflect critical factors such as the aging population. Deaths per 100,000 people in Korea have increased by 19.5%, from 497.3 in 2009 to 574.8 in 2019.24 Accordingly, our study, which reflected this natural increase in mortality, concluded that excess mortality in 2020 was not significant. Additional figures are given in the Supplementary Table 1.
Finally, some limitations should be noted. First, the study assumed no changes in the monthly composition of contributors to death, such as sex, age, and other risk factors. It estimated the mortality considering only the number of deaths and the time variables. However, as the COVID-19 has affected differently across sex and age groups, examining the changes in mortality among sex and age groups is required. Thus, we further analyzed sex and age-specific mortality, structured into sex (male, female) and six age groups; 0–19, 20–34, 35–49, 50–64, 65–79, and ≥ 80 years. The results are provided in Supplementary Figs. 1 and 2. The monthly mortality of women exceeded the expected range only in August, while that of men exceeded the expected range in August, October, and November. By age group, excess monthly mortality was observed the most in the 20-34 group, which accounts for a large portion of all COVID-19 patients. The mortality exceeded the expected range in all months except April and December. On the other hand, in the group over 80 with the highest CFR, mortality exceeding the expected range was confirmed only in August and October. Second, this study included a period until 2020, after a year of the COVID-19 pandemic. It is not enough to understand the long-term impact on mortality following the containment measures such as social distancing and self-isolation. Third, we estimated all-cause excess mortality in 2020 but could not clarify the direct impact of COVID-19 from total mortality. Further analysis is required, using the 2020 cause-of-deaths statistics, which the Statistics Korea will publish.
Although the findings should be interpreted with caution, this study is an initial study that has documented the impacts of COVID-19 on mortality in Korea. Excess all-cause mortality is a composite indicator that includes deaths of those infected with the COVID-19 and patients whose care was interrupted due to the pandemic; it shows the health system's resilience to cope with the pandemic in the country.25 Therefore, we suggest a rapid assessment on the impact of COVID-19 using excess mortality and monitoring it over the long term. Future work will establish a more robust model to assess whether excess mortality exists because it could be affected by the method to estimate the expected deaths. For that, further analysis is required to explain how and how many direct and indirect deaths occur. Building a system to monitor the impact of COVID-19 in fast and accurate ways can provide informative data for timely and effective decision-making in public emergencies such as the COVID-19 pandemic.
 XML Download