

 PDF
PDF Citation
 Print
Print


INTRODUCTION
The prevalence of diabetes mellitus (DM) is increasing worldwide.1 Chronic hyperglycemia affects many organs and can induce a variety of macro- or microvascular complications, which consequently result in increased rates of morbidity and mortality.2 Although recent studies have reported an increased risk of osteoporotic fractures in patients with diabetes,3 the mechanisms underlying DM-induced bone fragility are not yet fully understood. Studies have shown that hyperglycemia, oxidative stress, advanced glycation end-products (AGEs), homocysteine, and the reduction of insulin and insulin-like growth factor-I activity tend to result in poorer bone quality.4
Methylglyoxal (MG) is a reactive dicarbonyl metabolite of the glucose degradation pathway that accumulates in diabetic patients.5 MG acts as a potent glycating agent that interacts with protein residues to rapidly form AGEs.6 The toxicity levels of MG and MG-derived AGEs are widely related to cell apoptosis.78 MG-induced apoptosis in human osteoblasts has been previously observed in in vitro studies.9 Additionally, the bone mineral density of rats decreases following the consumption of drinking water containing MG, which suggests that higher levels of MG accumulation in diabetic patients may be a risk factor of osteoporosis.9
Patients with primary aldosteronism exhibit increases in urinary calcium excretion, which results in decreased blood calcium levels and could lead to the enhanced secretion of the parathyroid hormone. Subsequently, this secondary hyperparathyroidism increases bone loss and the risk of fractures.101112 Spironolactone is a competitive antagonist of aldosterone, and widely used in the treatment of hypertension and heart failure.13 Spironolactone acts competitively on aldosterone receptors to inhibit their actions and prevent bone loss caused by aldosterone. Rats with hyperaldosteronism demonstrated increased bone loss and decreased bone strength, but these changes are improved by spironolactone.1415 And elevated bone turnover markers in patients with primary aldosteronism decreased after spironolactone treatment.16 Carbone et al.17 reported that spironolactone treatment negatively correlated with fractures in men with congestive heart failure. Aldosterone receptors are present in osteoblasts, osteocytes, and osteoclasts.18 There is no study to investigate the direct impacts of spironolactone itself on bone health beyond aldosterone antagonism to date. Spironolactone also had a cardioprotective effect through several mechanisms by acting on cardiomyocytes damaged by diabetes in streptozotocin-induced diabetic rats.1920 By reviewing the results of previous studies, we attempted to determine the effect of spironolactone on diabetes-related bone fragility at the cellular level. Thus, the present in vitro study investigated the effects of spironolactone on MG-induced cytotoxicity in osteoblastic MC3T3-E1 cells.
Go to : 
METHODS
Materials
Spironolactone was purchased from Sigma Chemical (St. Louis, MO, USA). Cell culture medium and antibiotics were purchased from Gibco BRL (Grand Island, NY, USA). Other reagents were purchased from Sigma Chemical.
Cell culture
The osteoblastic MC3T3-E1 subclone 4 line was obtained from ATCC (Manassas, VA, USA). The MC3T3-E1 cells were cultured in α-modified minimal essential medium (α-MEM; Gibco) in a CO2 incubator (5% CO2/air) at 37°C. The medium contained 10% fetal bovine serum (FBS), 100 U/mL of penicillin, 100 μg/mL of streptomycin and 25 μg/mL amphotericin B. At confluence, the cells were maintained in osteogenic differentiation medium containing 5 mM β-glycerophosphate and 50 μg/mL ascorbic acid. After either 6 (collagen content and alkaline phosphatase [ALP] activity) or 14 (mineralization assay) days, the cells were incubated with spironolactone for 48 hours.
Cell viability
The MC3T3-E1 cells were seeded in a 24-well plate at a density of 2 × 10⁴ cells per well. After 48 hours, the cells were incubated for 1 hour with α-MEM containing 0.1% FBS and spironolactone and then treated with MG for 48 hours. Cell viability was assessed using water-soluble tetrazolium (WST; Dojindo Molecular Technologies, Inc., Rockville, MD, USA). Briefly, WST was added to each well, and the plates were incubated for 2 hours. The absorbance was measured at 570 nm using a Multiskan™ Microplate reader (Thermo Scientific Co. Waltham, MA USA). Control cells were incubated with culture medium only to represent 100% cell viability and to further calculate the percent viability of the treated cells.
Measurement of apoptosis
Apoptosis was assessed using a Cell-Death-Detection enzyme-linked immunosorbent assay (ELISA)PLUS kit (Sigma Chemical) in accordance with the manufacturer's instructions. The assay was based on a quantitative sandwich-enzyme-immunoassay-principle using mouse monoclonal antibodies directed against DNA and histones, respectively. This allows for the specific determination of mono- and oligonucleosomes in the cytoplasmic fraction of cell lysates. The absorbance of each well was recorded on a microplate spectrophotometer at 450 nm.
Collagen content
The cultured osteoblasts were washed with Dulbecco's phosphate buffered saline and then fixed with Bouin's solution for 1 hour. The culture dishes were then washed under running tap water for 15 minutes, air-dried and stained using Sirius Red dye reagent for 1 hour under mild shaking conditions. After that, the solution was removed, and the cultures were washed with 0.01 N HCl to remove any non-bound dye. The stained material was dissolved in 0.1 N NaOH, and absorbance was measured at 550 nm. A standard curve was constructed using concentrations of commercial collagen (Sigma).
ALP activity
The cell lysates were used to measure ALP activities according to the instruction manual of ALP activity assay kit (BioVision, Milpitas, CA, USA). Protein concentrations were determined using a Bio-Rad (Hercules, CA, USA) protein assay reagent.
Mineralization
Mineralization was measured using calcium deposition assays. The cells were fixed with 70% ethanol and then stained with Alizarin Red S. The absorbance of the solubilized stain was measured at 561 nm as in our previous study.21
Measurements of inositol-requiring 1 (IRE1) and activating transcription factor 6 (ATF-6) levels
IRE1 and ATF6 are indicators of endoplasmic reticulum (ER) stress. The levels of ATF-6 and IRE1 in the cytosol were determined using ELISA kits (MyBioSource, Inc., San Diego, CA, USA) according to the manufacturer's instructions.
Measurements of tumor necrosis factor-α (TNF-α) and interleukin (IL)-6 levels
TNF-α and IL-6 levels in the medium were measured using an enzyme immunoassay system (R&D System Inc., Minneapolis, MN, USA) according to the manufacturer's instructions.
Measurements of glyoxalase I activity and reductions in glutathione (GSH) levels
Glyoxalase I activity was measured using a previously published method.22 GSH was measured with a GSH Assay kit (BioAssay Systems, Hayward, CA, USA) according to the manufacturer's instructions.
Measurement of intracellular reactive oxygen species (ROS) levels
The formation of intracellular ROS was measured using 2′,7′-dichlorodihydrofluorescein diacetate (H2DCFDA).22
Measurement of mitochondrial superoxide levels
Mitochondrial superoxide levels were detected using the MitoSOXTM Red mitochondrial superoxide indicator (Invitrogen Molecular Probes, Carlsbad, CA, USA). MitoSOXTM Red (excitation, 510 nm; emission, 580 nm) is a fluorogenic dye used for the highly selective detection of superoxides in the mitochondria of cells.23
Measurement of cardiolipin peroxidation
10-N-nonyl-acridin orange (NAO; Molecular Probes, Inc., Eugene, OR, USA) binds to mitochondrial cardiolipin. It was used for the determination of cardiolipin levels. The cells were labeled with 5 μM NAO for 20 minutes and washed. Then, the fluorescence was measured as previously described method.22
Determination of the mitochondrial membrane potential (MMP)
A JC-1 MMP Assay kit (Cayman Chemical Co., Ann Arbor, MI, USA) was used to measure changes in the MMP in cells.22
Measurement of adenosine triphosphate (ATP) levels
The supernatants of cell homogenates were used for ATP assays and protein content measurements. ATP concentrations were determined with a luciferase reaction using EnzyLight™ ATP Assay kits (BioAssay Systems), and protein concentrations were determined using a Bio-Rad protein assay reagent.
Measurement of proliferator-activated receptor gamma coactivator 1α (PGC-1α) levels
The supernatants of cell homogenates were used for ELISA and protein content measurements. PGC-1α levels were measured using Mouse Peroxisome PGC-1α ELISA kits (MyBioSource), and protein concentrations were determined using a Bio-Rad protein assay reagent.
Measurement of nitric oxide (NO) generation
The cells were loaded with 5 μM 4-amino-5-methylamino-2′,7′-difluorofluorescein (DAF-FM) diacetate (Invitrogen Corp., Burlington, Canada) for 2 hours at 37°C. After removal of the excess probe, the fluorescence intensity of DAF, which reflects intracellular NO levels, was measured with an excitation wavelength of 495 nm and an emission wavelength of 515 nm.2224
Statistical analysis
All results were expressed as the mean ± standard error. Statistical significance was determined by analysis of variance tests followed by Dunnett's t-tests. All statistical analyses were carried out using PASW software (version 20.0; IBM Co., Armonk, NY, USA), and P values < 0.05 were considered to indicate statistical significance.
Go to :
RESULTS
Cytoprotective effects of spironolactone on MG-induced cytotoxicity in osteoblastic MC3T3-E1 cells
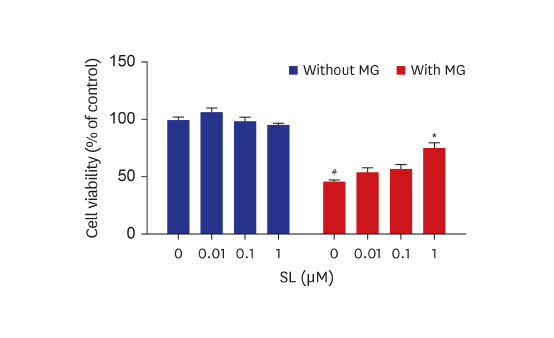
The cytoprotective effects of spironolactone on MG-induced cytotoxicity in osteoblastic MC3T3-E1 cells are illustrated in Fig. 1. Compared to non-treated control cells, treatment with 400 μM of MG induced nearly 50% MC3T3-E1 cell death. Although the viability of MG-treated MC3T3-E1 cells did not change following treatment with either 0.01 or 0.1 μM of spironolactone, 1 μM of spironolactone inhibited MG-induced cytotoxicity (Fig. 1A). In addition, MG-induced apoptosis in MC3T3-E1 cells reduced after each concentration of spironolactone (Fig. 1B).
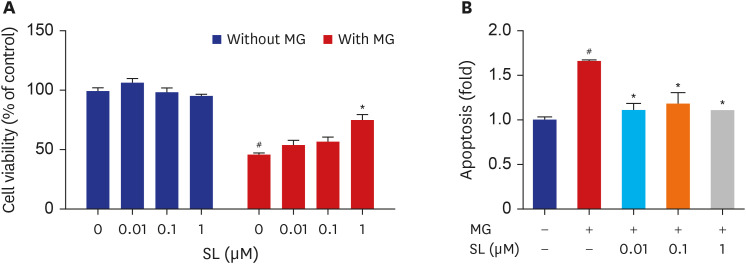 | Fig. 1Effects of spironolactone on the MG-induced cytotoxicity in MC3T3-E1 cells. Osteoblasts were treated with SL in the absence or presence of 400 μM of MG for 48 hours, and then (A) cell viability and (B) apoptosis were analyzed. Data are expressed as the mean ± standard error of mean (n = 6).MG = methylglyoxal, SL = spironolactone.
#P < 0.05 compared to untreated cells; *P < 0.05 compared to cells treated with MG alone.
|
Effects of spironolactone on osteoblast differentiation in MG-treated MC3T3-E1 cells
Collagen synthesis, ALP activity, and mineralization decreased in the MG-treated MC3T3-E1 cells (Fig. 2). Following spironolactone administration, collagen synthesis increased significantly after doses of 0.01 and 0.1 μM (Fig. 2A), ALP activity increased significantly after doses of 0.1, and 1 μM (Fig. 2B), and mineralization increased significantly after all concentrations (Fig. 2C).
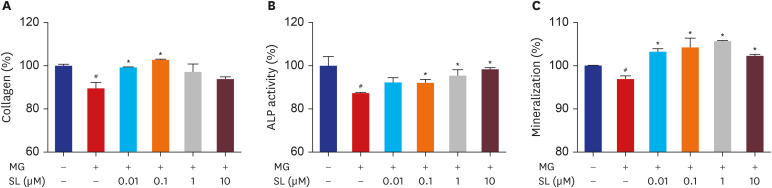 | Fig. 2Effects of SL on MG-induced osteoblast dysfunction in osteoblastic MC3T3-E1 cells. Cells were treated 10 mM of β-glycerophosphate and 50 μg/mL of ascorbic acid to initiate differentiation. After six days, osteoblasts were treated with SL in the absence or presence of 400 μM of MG for 48 hours, and then (A) collagen content and (B) ALP activity were measured. (C) After 14 days, osteoblasts were treated with SL in the absence or presence of 400 μM of MG for 48 hours, and then mineralization levels were measured. The control values for collagen content, ALP activity, and mineralization were 46.27 ± 0.346 μg/106 cells, 0.502 ± 0.022 unit/mg protein, and 0.654 ± 0.0004 OD/106 cells, respectively. Data are expressed as the mean ± standard error of mean (n = 6).MG = methylglyoxal, SL = spironolactone, ALP = alkaline phosphatase.
#P < 0.05 compared to untreated cells; *P < 0.05 compared to cells treated with MG alone.
|
Effects of spironolactone on ER stress and the generation of inflammatory cytokines in MG-treated MC3T3-E1 cells
When 400 μM of MG was added to MC3T3-E1 cells, there were increases in the levels of IRE1 and ATF-6, which are indicative of ER stress (Fig. 3A and B). Spironolactone administration significantly reduced the levels of IRE1 and ATF-6 in MG-treated MC3T3-E1 cells at all concentrations (Fig. 3A and B). Significantly more TNF-α and IL-6 were generated in MG-treated MC3T3-E1 cells. However, the MG-induced increases in TNF-α and IL-6 were significantly inhibited by spironolactone doses of 0.01, 0.1, and 1 μM (Fig. 3C and D).
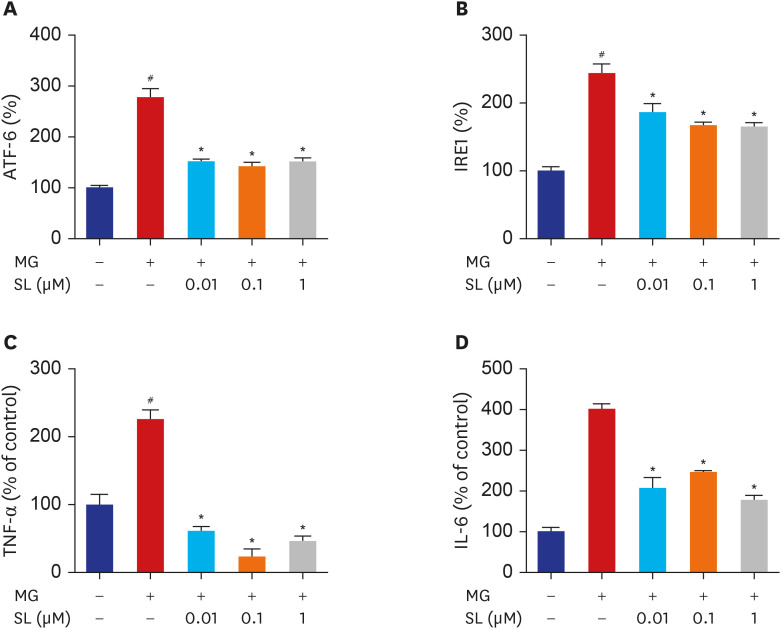 | Fig. 3Effects of SL on ER stress, TNF-α and IL-6 production in MG-treated MC3T3-E1 cells. Osteoblasts were pre-incubated with SL before treatment with 400 μM of MG for 24 hours. The control values for ATF6 and IRE1 were 54.72 ± 0.498 and 3.095 ± 0.179 ng/mg, respectively. The control values for TNF-α and IL-6 were 18.09 ± 2.713 pg/mg and 0.655 ± 0.033 ng/mg, respectively. Data are expressed as the mean ± standard error of mean (n = 6).ATF = activating transcription factor 6, MG = methylglyoxal, SL = spironolactone, IRE1 = inositol-requiring 1, TNF-α = tumor necrosis factor-α, IL = interleukin.
#P < 0.05 compared to untreated cells; *P < 0.05 compared to cells treated with MG alone.
|
Effects of spironolactone on glyoxalase I activity and GSH levels in MG-treated MC3T3-E1 cells
MG is detoxified by the glyoxalase system. When 400 μM of MG was added to MC3T3-E1 cells, glyoxalase I activity decreased significantly. However, spironolactone treatment increased MG-induced reduction of glyoxalase I activity at all concentrations (Fig. 4A). Additionally, spironolactone treatment increased GSH levels in MG-treated MC3T3-E1 cells at all concentrations (Fig. 4B).
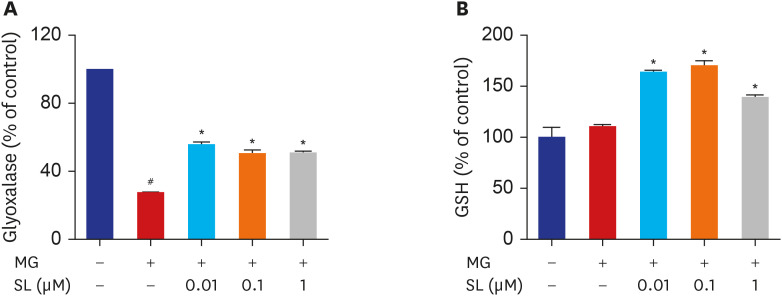 | Fig. 4Effects of SL on glyoxalase I activity and reduced GSH levels in MG-treated cells. Osteoblasts were pre-incubated with SL before treatment with 400 μM of MG for 48 hours. The control values for (A) glyoxalase I activity and (B) reduced GSH levels were 0.29 ± 0.001 ΔOD/min/mg and 72.03 ± 6.91 μg/mg, respectively. Data are expressed as the mean ± standard error of mean (n = 6).MG = methylglyoxal, SL = spironolactone, GSH = glutathione.
#P < 0.05 compared to untreated cells; *P < 0.05 compared to cells treated with MG alone.
|
Effects of spironolactone on oxidative stress in MG-treated MC3T3-E1 cells
ROS levels increased significantly in MG-treated MC3T3-E1 cells but decreased upon spironolactone treatment at all concentrations (Fig. 5A). Mitochondrial superoxide levels also increased significantly in MG-treated MC3T3-E1 cells but decreased upon spironolactone treatment after all concentrations (Fig. 5B). Additionally, NAO fluorescence decreased significantly in MG-treated MC3T3-E1 cells, which indicated MG induced cardiolipin peroxidation. However, spironolactone decreased MG-induced cardiolipin peroxidation after doses of 0.1 and 1 μM (Fig. 5C).
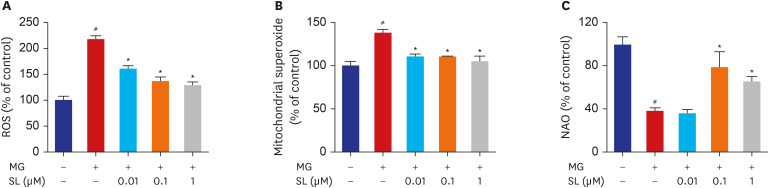 | Fig. 5Inhibitory effects of SL on MG-induced oxidative stress in MC3T3-E1 cells. Osteoblasts were pre-incubated with SL before treatment with 400 μM of MG for 48 hours. (A) Changes in ROS levels measured using the dichlorodihydrofluorescein fluorescence method. (B) Mitochondrial superoxide levels detected using the MitoSOX™ red mitochondrial superoxide indicator. (C) Cardiolipin oxidation measured using 5 µM NAO. All data are expressed as a percentage of the fluorescence emitted by bound NAO relative to untreated control cells. Note that a decrease in NAO binding is related to cardiolipin peroxidation. Data are expressed as the mean ± standard error of mean (n = 6).ROS = reactive oxygen species, MG = methylglyoxal, SL = spironolactone, NAO = 10-N-nonyl-acridin orange.
#P < 0.05 compared to untreated cells; *P < 0.05 compared to cells treated with MG alone.
|
Effects of spironolactone on mitochondrial function in MG-treated MC3T3-E1 cells
The MMP, ATP synthesis, and NO production levels decreased significantly in MG-treated MC3T3-E1 cells (Fig. 6). However, spironolactone treatment inhibited the MG-induced disruption of MMP after all concentrations (Fig. 6A). Similarly, spironolactone treatment restored the MG-induced inhibition of ATP synthesis after doses of 0.1 and 1 μM (Fig. 6B). Although the PGC-1α level was not affected by MG, the PGC-1α level increased significantly after all concentrations of spironolactone (Fig. 6C). Spironolactone treatment also restored the reduced production of NO in MG-treated MC3T3-E1 cells after doses of 0.01 and 0.1 μM (Fig. 6D).
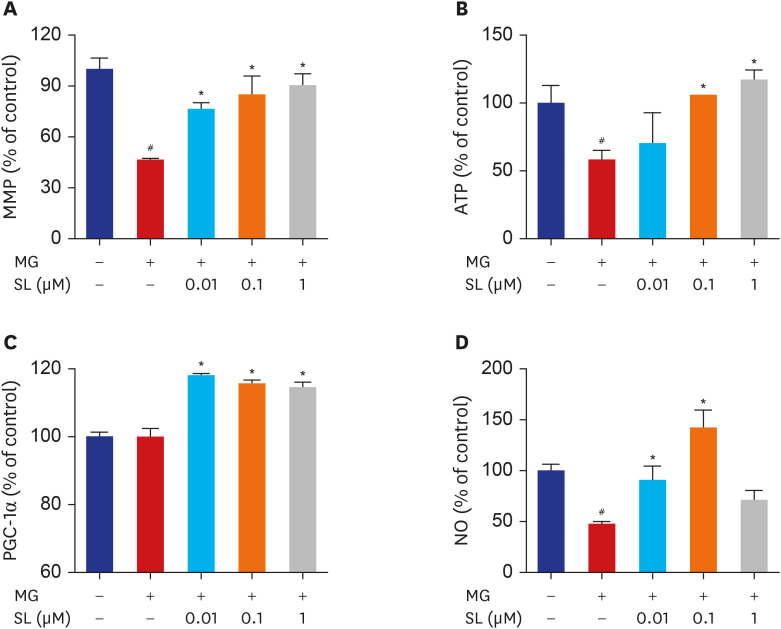 | Fig. 6Effects of SL on MG-induced mitochondrial dysfunction in osteoblastic MC3T3-E1 cells. Osteoblasts were pre-incubated with SL before treatment with 400 μM of MG for 48 hours. (A) Mitochondrial depolarization i.e., loss of MMP is represented by a decrease in the red/green fluorescence ratio; all data are expressed as a percentage of control values. The control values for (B) ATP levels and (C) PGC-1α levels were 1.496 ± 0.193 nmol/mg and 387.98 ± 5.39 ng/mg, respectively. All data for (D) NO are expressed as a mean relative percentage of fluorescence. Data are expressed as the mean ± standard error of mean (n = 6).MMP = mitochondrial membrane potential, MG = methylglyoxal, SL = spironolactone, ATP = adenosine triphosphate, PGC-1α = proliferator-activated receptor gamma coactivator 1α, NO = nitric oxide.
#P < 0.05 compared to untreated cells; *P < 0.05 compared to cells treated with MG alone.
|
Go to :
DISCUSSION
Our study demonstrated that spironolactone plays a role in preventing cytotoxicity and mitochondrial dysfunction induced by MG in osteoblastic MC3T3-E1 cells. More specifically, spironolactone reversed MG-induced inhibition of bone formation activity and mineralization in osteoblastic MC3T3-E1 cells, increased GSH levels and glyoxalase I activity and reduced MG-induced enhancements in ER stress, oxidative stress, and inflammatory cytokine levels. The present findings suggest that spironolactone acts in a greater capacity than only as an aldosterone receptor antagonist, which is beneficial for bone metabolism.
Excessive or prolonged ER stress can induce apoptosis through mitochondria-dependent or mitochondria-independent mechanisms and can be assessed based on the levels of three ER transmembrane proteins: IRE1, double-stranded RNA-dependent protein kinase-like ER kinase, and ATF6.25 Increased ER stress activates transcription factors to influence the expression of target genes. The present study showed that the IRE1 and ATF6 pathways were activated in MG-treated MC3T3-E1 cells and that spironolactone decreased ER stress. ROS are also effective inducers of apoptosis. MG can increase oxidative stress directly via increased ROS production or indirectly via the induction of AGE formation.26 In the present study, spironolactone significantly decreased the MG-induced generation of ROS. In order to collect further evidence regarding changes in oxidative stress existing in mitochondria, cardiolipin peroxidation and mitochondrial superoxide levels were assessed. The results revealed that spironolactone significantly reduced oxidative stress within mitochondria. Therefore, spironolactone's protective effects against osteoblast apoptosis may be due to the reduction of ER and oxidative stress.
Glyoxalase I is a rate-limiting enzyme able to exert efficient detoxification of MG, a highly reactive carbonyl and AGE precursor, forming D-lactate and inhibiting the formation of AGEs using GSH as a cofactor.27 The overexpression of glyoxalase I inhibits intracellular AGE formation in bovine endothelial cells,28 and glyoxalase I deficiencies are associated with increased concentrations of AGEs.29 MG forms an intermediate hemithioacetal adduct, followed by S-D-lactoyl-GSH by reacting with reduced GSH, catalyzed by glyoxalase I, then converted into D-lactate by glyoxalase II leading to the reformation of the consumed GSH.30 In our study, glyoxalase I was decreased and GSH is at a level similar to that of control after MG treatment. It means that MG would act as a glyoxalase I inhibitor and similar GSH level might be associated with compensatory change for reducing MG-induced AGE formation in osteoblasts.31 After spironolactone treatment, GSH levels and glyoxalase I activity were elevated. Therefore, spironolactone may decrease oxidative stress by suppressing the formation of AGEs induced by stimulating glyoxalase I activity. The present findings indicate that spironolactone regulates the oxidative and antioxidative stress systems. This is consistent with a previous study showing that spironolactone regulates the expressions of key genes involved in the oxidative and antioxidative stress systems.19
Mitochondria generate a majority of the ATP molecules required for cell metabolism and play a significant role in cell proliferation, differentiation, and apoptosis.32 Mitochondrial dysfunction results in insufficient cellular energy supplies, which, in turn, results in the additional accumulation of ROS.33 The present study showed that spironolactone treatment significantly upregulated the levels of markers of mitochondrial biogenesis. Thus, spironolactone can restore MG-induced mitochondrial dysfunction. Taken together, these findings indicated that spironolactone treatment restored mitochondrial function and suppressed AGE formation, which reduced ER stress and oxidative stress. Oxidative stress is a critical mediator of inflammation, with MG and AGEs promoting the release of pro-inflammatory cytokines such as IL-6, IL-8, and TNF-α.34 Increased levels of pro-inflammatory cytokines are associated with the onset of microvascular damage and other DM-like complications in rats.35 The present study demonstrated that spironolactone treatment significantly inhibited MG-induced increases in IL-6 and TNF-α production. Similarly, a previous study showed that spironolactone reduces cardiac inflammation in streptozotocin-induced diabetic rats.19 Therefore, the anti-inflammatory effects of spironolactone are likely to contribute to the improvement of impaired osteoblasts significantly.
Several studies have reported that spironolactone also exerts antioxidative effects in myocardial cells and endothelial cells.192036 However, the effects of spironolactone on bone metabolism require further investigation, and this is the first study that has investigated the protective effects of spironolactone on osteoblasts. A previous study found that aldosterone and aldosterone synthase levels increased in streptozotocin-induced diabetic rats and that these changes contributed to cardiac oxidative stress and remodeling. However, spironolactone reduces myocardial oxidative stress, inflammation, and fibrosis, improves pathological structures, and normalizes cardiac energy metabolism.1920 The present study found that spironolactone exerted protective effects on MC3T3-E1 osteoblastic cells. Although the present experiment has several limitations, these findings are meaningful as they confirmed the effects of spironolactone and provided a basis for future studies to evaluate spironolactone effects on bone metabolism.
The number of diabetic patients is rising worldwide, and as a result, DM-related complications are becoming a major societal problem. The accumulation of AGEs is the primary mechanism underlying chronic diabetic microvascular and macrovascular complications. AGE could also induce the apoptosis and dysfunction of osteoblasts and osteoblasts, which results in osteoporosis and fractures.37 For men over 50 years of age and postmenopausal women with DM with a long duration of illness and diabetic cardiomyopathy, spironolactone could positively affect bone health.
The present study has several limitations that should be noted. Firstly, as bone remodeling requires the coupling of bone formation and resorption by osteoblasts and osteoclasts, further studies are necessary to investigate the effects of spironolactone on osteoclasts. Secondly, genetic and/or proteomic research will be required to accurately identify the cytoprotective mechanisms underlying spironolactone's effects. Thirdly, well-designed in vivo studies should be conducted to complement the in vitro findings.
In conclusion, the present findings showed that spironolactone prevented MG-induced cytotoxicity via reductions in oxidative stress independent of aldosterone. The mechanisms underlying this reduction in oxidative stress can be explained by the ability of spironolactone to inhibit AGE formation, restore mitochondrial dysfunction, and exert anti-inflammatory effects.
Go to :
 XML Download