

 PDF
PDF Citation
 Print
Print


INTRODUCTION
The survival rate of very preterm (VP) infants (i.e., born at a gestational age of < 32 weeks) and very low birth weight (VLBW) infants (i.e., born with a birth weight of < 1,500 g) have increased since the introduction of exogenous surfactants in early 1990, and with improvements in the clinical use of mechanical ventilation.12 With improvements in neonatal intensive care unit (NICU) care practices, major disabilities such as cerebral palsy, intellectual disability, blindness, and deafness seem to have decreased among survivors.234 Nonetheless, VP or VLBW survivors are known to have worse cognitive and behavioral outcomes than term infants or those with normal birth weight.234 Furthermore, some studies have suggested that the prevalence of these subtle neurodevelopmental problems has recently increased, contrary to expectations.234A meta-analysis conducted by Bhutta et al.2 revealed that school-aged children born VP had significantly lower cognitive scores (weighted mean difference, 10.9; 95% confidence interval, 9.2–12.5) and exhibited more externalized and internalized behaviors with a twofold increased risk of attention-deficit/hyperactivity disorder (ADHD) than term-birth controls. Johnson3 reviewed cognitive and behavioral outcomes after VP birth and observed a gestational age-related gradient in the intelligence quotient (IQ) and increased risk of attentional and social problems in preterm children. Studies with diagnostic criteria such as mental retardation, ADHD, and depression may include only severe cases of preterm children. Considering borderline cognitive deficits and minor behavioral problems (e.g., attention deficit), a large proportion of preterm children are at an increased risk for poor school performance.34Executive function (EF) is a higher level of cognitive function that develops dramatically from 2 to 5 years of age.5 A meta-analysis of neurobehavioral outcomes showed poor EF, attention problems, and severe deficits in academic achievement among VP and VLBW children.4 Additionally, preterm children with low EF had a higher incidence of ADHD and unpreparedness in reading and math, which lagged them behind their term peers.45
Data on the school-age cognitive outcomes of infants born extremely preterm (EP, born before 30 weeks of gestation) or VP have mostly been obtained from studies conducted in Western countries.6 Even with notable improvements in the survival rates of EP or VP infants in Korea,7 their long-term neurocognitive outcomes remain unknown. Hence, the present study aimed 1) to evaluate the cognitive (including EF) and behavioral outcomes of school-aged children born preterm in Korea and 2) to analyze risk factors for poor cognitive outcomes in these children.
METHODS
Study design
This follow-up study included surviving extremely low birth weight (ELBW; born with a birth weight of < 1,000 g) or preterm infants born before 30 weeks of gestation (defined as EP infants in this study), who were admitted to the NICU at Seoul National University Children's Hospital (SNUCH) from January 2008 to December 2009. Tests were intended to be performed at 7–8 years of age. Additionally, controls born term with birth weight over 2.5 kg who had neither major congenital anomalies nor history of psychiatric diagnoses were recruited via an in-hospital announcement. The enrollment ratio was planned as 2:1 (EP group:control group). The minimum number for the EP and the control groups were calculated as 53 and 26, respectively, with an anticipated IQ in the control group of 100 ± 15; an IQ mean weighted difference, 10; α, 0.05; β, 0.2; power, 0.8; and an enrollment ratio 2:1.
Perinatal data
Perinatal factors in preterm children were prospectively reviewed. Common complications of prematurity, including respiratory distress syndrome, use of multiple surfactants, pharmacological or surgical treatment of patent ductus arteriosus, intraventricular hemorrhage (IVH; grade 3 or 4),8 periventricular leukomalacia (PVL), necrotizing enterocolitis (≥ stage 2),9 bronchopulmonary dysplasia,10 laser treatment of retinopathy of prematurity (ROP), and culture proven sepsis, were compared among EP infants.
Demographic data
Sociodemographic data, including the marital status of the mother, maternal and paternal education, family structure, number of siblings, parental occupation, and family income, were collected during the tests.
Outcome measures
Psychologists who were unaware of the perinatal findings or post-discharge details assessed the children.
Cognitive test
General intellectual ability was evaluated using the Korean Wechsler Intelligence Scale for Children-Fourth Edition.11 The Full-Scale IQ (FSIQ) was used to assess general intelligence, and the index scores of its four subdomains were evaluated for more specific cognitive information. The Verbal Comprehension Index was used as a measure of knowledge of word meanings and verbal reasoning abilities; the Perceptual Reasoning Index, as a measure of visuoconstructional skills and visual reasoning abilities; the Working Memory Index, as a measure of immediate and working memory; and the Processing Speed Index, as a measure of speed and accuracy of information processing. Each index score was standardized by age, with a mean of 100 and a standard deviation (SD) of 15. The test results of children with severe neurologic deficits (moderate-to-severe cerebral palsy, n = 5; bilateral deafness with cochlear implant, n = 1) were included in the study.
EF neuropsychological tests
Advanced Test of Attention (ATA)
The ATA is a computerized cognitive test that measures sustained and selective attention and impulsivity in children.12 The ATA comprises a visual attention test and an auditory attention test. The following four major variables are used: omission errors (failure to respond to targets), which serve as a measure of inattention; commission errors (erroneously responding to non-targets), which are considered a measure of impulsivity; response time for correct responses; and the SD of these response times (response time variability), which is regarded as a measure of attention consistency. A high T-score indicates inattention or impulsivity, whereas a T-score exceeding 65 (over 1.5 SD) is considered to be the “ADHD” range.
Stroop Color-Word Test
The Stroop test measures the inhibitory control of prepotent behavior and consists of three kinds of card sessions: word, color, and incongruent color-word.13 Each of 100 cards contains a stimulus, and the children must read them aloud as quickly as possible. The children are instructed to read the word in the first session, to read the color in which the word is printed in the second session, and to name the printed color instead of the printed word in the final session. The total time spent reading the cards is checked during this test. Interference control (i.e., inhibition of habitual response) was measured in this test, and the T-score for age was registered for data analysis.
Children's Color Trails Test (CCTT)
The CCTT measures alternating and sustained visual attention, sequencing, psychomotor speed, cognitive flexibility, planning, and inhibition-disinhibition.14 The CCTT comprises two parts (namely, CCTT1, and CCTT2), which both require a pencil and paper. CCTT1 requires the children to quickly and correctly sequence numbers even with two different background colors between odd and even numbers, whereas CCTT2 requires the children to connect circles in ascending order while alternating between two different background colors. The score reflects the time from initiation to task completion. The difference interference was calculated as the difference between CCTT2 and CCTT1 task completion raw scores. The T-score for age was registered for data analysis.
Wisconsin Card Sorting Test (WCST)
The WCST measures cognitive flexibility.15 The children have four starting cards with different colors, shapes, and numbers and one test card on the computer. The children subsequently receive feedback after categorizing the cards according to color, shape, or number. In this study, the computer version of the Heaton's WCST was utilized, and T-scores for the total error, perseverative error, non-perseverative error, perseverative response, and conceptual-level response were used for the analyses.
Behavioral test
Behavioral outcomes were evaluated using the Korean Child Behavior Checklist (K-CBCL). The K-CBCL comprises 119 items that should be answered by parents. These items are categorized into eight subscales (withdrawn/depressed, somatic complaints, anxiety/depression, social problems, thought problems, attention problems, rule-breaking behavior, aggressive behavior) and two broad scales (externalization and internalization). Higher scores indicate more problems, with T-scores ≥ 60 being considered as predictors of behavioral problems.16
The Korean ADHD Rating Scale (K-ARS) was used to screen ADHD risk.17 The ARS comprises a total of 18 items—specifically, 9 items related to inattention and 9 items related to hyperactivity/impulsivity. A parent should complete this test using a 4-point scale: 0, none; 1, mild; 2, moderate; and 3, severe. Higher scores indicate greater severity. Inattention scores, hyperactivity/impulsivity scores, and total scores were calculated.
Statistical analysis
All statistical analyses were performed using SPSS for Windows version 20.0 (IBM Corp., Armonk, NY, USA). Between-group comparisons were conducted using Student's t-tests and χ2 tests. Analysis of covariance was used to assess FSIQ scores after adjusting for socioeconomic factors. Multiple logistic regression analysis with stepwise selection was performed to solve the multicollinearity phenomenon in the analysis of independent risk factors for lower FSIQ scores. A P value < 0.050 was considered to indicate statistical significance.
RESULTS
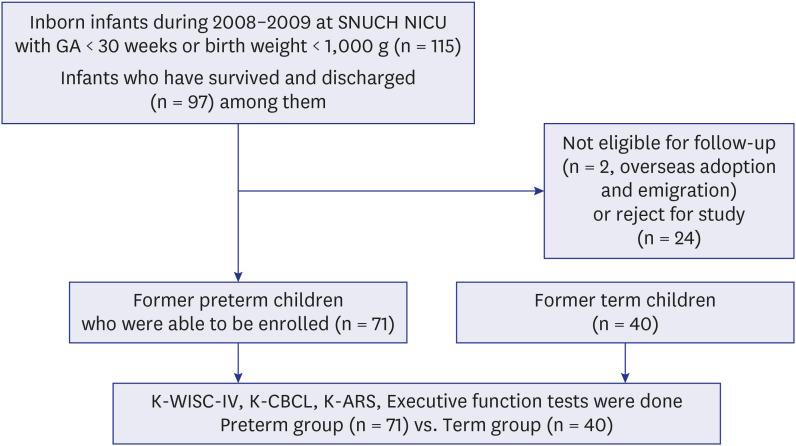
A total of 115 infants were admitted to the NICU at SNUCH during the study period, and 97 infants survived to discharge. However, 26 children were not enrolled owing to loss of contact or the parents' refusal to participate in the study. Finally, 71 preterm children were enrolled; thus, the follow-up rate was 73.2%. All children in both the EP (n = 71) and term control groups (n = 40) completed all tests (Fig. 1).
Fig.1
Flow chart of the study.
SNUCH = Seoul National University Children’s Hospital, NICU = neonatal intensive care unit, GA = gestational age, K-WISC-IV = Korean Wechsler intelligence scale for children–fourth edition, K-CBCL = Korean version of child behavior checklist, K-ARS = Korean version of attention-deficit/hyperactivity disorder rating scale.
Demographic characteristic
Considering the possibility of selection bias, perinatal factors were compared between the EP study group and unenrolled EP infants (n = 24). The enrolled EP infants had lower birth weights and higher maternal ages at birth than the unenrolled EP infants (P = 0.004 and P = 0.002, respectively). Nevertheless, perinatal morbidities were not different between the enrolled and unenrolled EP infants (Table 1).
Table 1
Perinatal characteristics of preterm infants
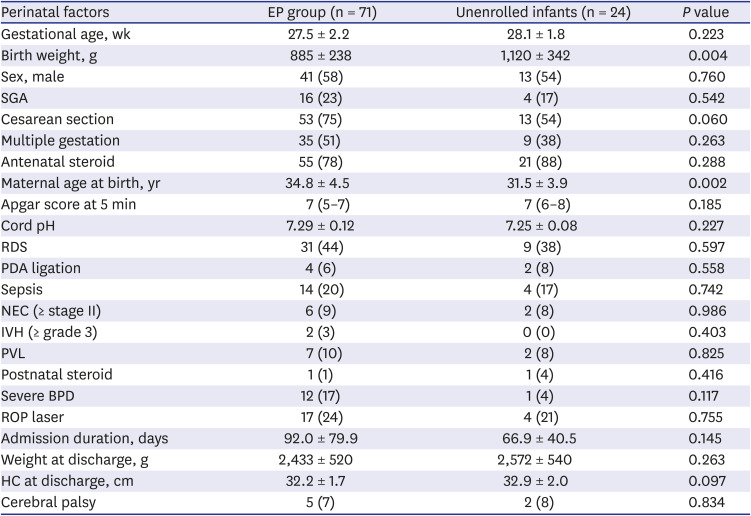
Data are shown as mean ± standard deviation or number (%).
EP = extremely preterm, SGA = small-for-gestational age, RDS = respiratory distress syndrome, PDA = patent ductus arteriosus, NEC = necrotizing enterocolitis, IVH = intraventricular hemorrhage, PVL = periventricular leukomalacia, BPD = bronchopulmonary dysplasia, ROP = retinopathy of prematurity, HC = head circumference.
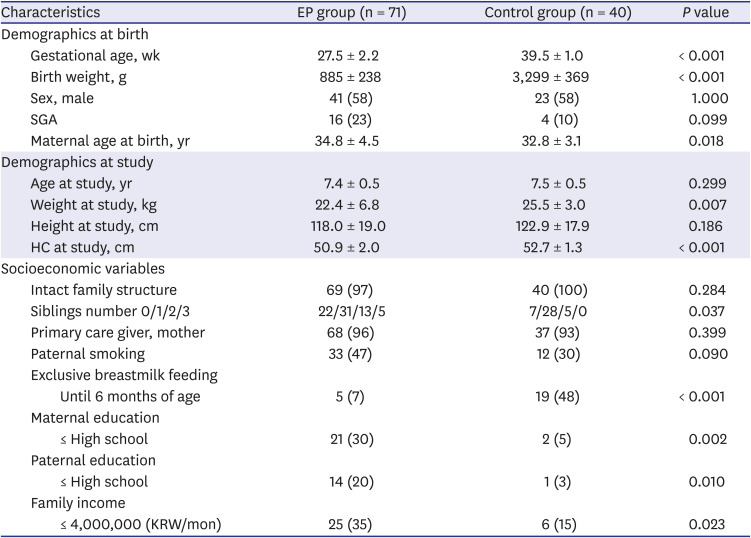
The mean gestational age and birth weight in the EP group were 27.5 ± 2.2 (23+5–32+6) weeks and 885 ± 238 (440–1,510) g, respectively. Maternal age at birth was significantly higher in the EP group (P = 0.018). At the time of examination, age did not differ between groups, whereas weight and head circumference were significantly lower in the EP group (P = 0.007 and P < 0.001, respectively). From a socioeconomic perspective, the EP group showed significantly lower maternal and paternal education levels (P = 0.002 and P = 0.010, respectively) and significantly lower family income level (P = 0.023). Exclusive breast feeding until 6 months of age was significantly more frequent in the term control group (P < 0.001; Table 2).
Table 2
Characteristics of studied children
Cognitive test/EF tests and behavioral outcomes
The mean FSIQ was significantly lower in the EP group than in the term control group (P < 0.001). A similar pattern was observed for each index score. Because socioeconomic factors such as the rate of exclusive breastmilk feeding, maternal and paternal education levels, and income levels were different between the two groups (Table 2), the FSIQ scores were compared after adjusting for significant socioeconomic factors. The adjusted mean FSIQ score remained significantly lower in the EP group than in the term control group (89.9 with a standard error of 1.93 vs. 105.7 with a standard error of 2.61; P < 0.001). In the EP group, 26 children had an FSIQ score below 85, and 9 children had an FSIQ score below 70, whereas only one child had an FSIQ score below 85 in the control group (Table 3). Among five children diagnosed with cerebral palsy in the EP group, one child exhibited an FSIQ score above 85, whereas the remaining children presented an FSIQ score below 70. Even after the exclusion of five neurologically impaired children, the mean FSIQ score of the EP group was still significantly lower than that of the term control group (P < 0.001).
Table 3
Cognitive and executive function outcomes
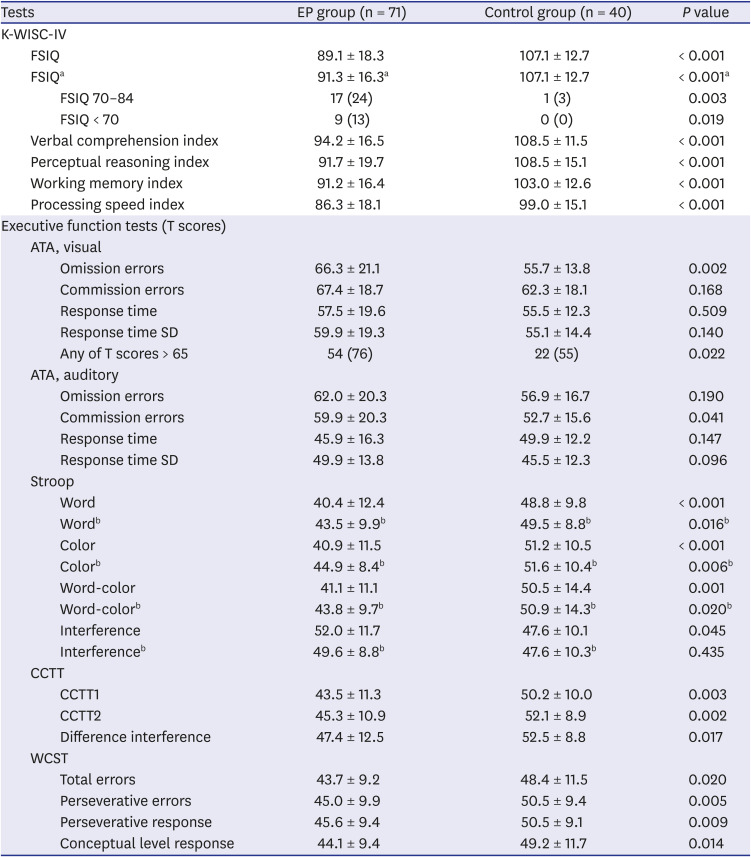
Data are shown as mean ± SD or number (%).
EP = extremely preterm, K-WISC-IV = Korean Wechsler intelligence scale for children-fourth edition, FSIQ = full-scale intelligence quotient, ATA = Advanced test of attention, SD = standard deviation, CCTT = Children's color trails test, WCST = Wisconsin card sorting test.
aAfter excluding five neurologically impaired children; bOnly including FSIQ ≥ 85 children.
In the visual ATA, the EP group exhibited significantly higher omission errors than the term control group (P = 0.002), and the number of children with T-scores exceeding 65 was significantly higher in the EP group than in the term control group (54 [76%] vs. 22 [55%]; P = 0.022). In the auditory ATA, the EP group exhibited significantly higher commission errors than the term control group (P = 0.041). In the Stroop test, the EP group performed significantly worse on all three card tests than the term control group (all P < 0.001); however, the interference score in the Stroop test was significantly higher in the EP group (P = 0.045). The T-scores for CCTT1 and CCTT2 were significantly lower in the EP group (P = 0.003 and P = 0.002, respectively), and the T-score for the difference in interference in the CCTT was also significantly lower in the EP group (P = 0.017). The T-scores for the total error, perseverative error, perseverative response, and conceptual-level response in the WCST were significantly lower in the EP group (P = 0.020, P = 0.005, P = 0.009, and P = 0.014, respectively; Table 3). When analyzing the EP group after exclusion of five neurologically impaired children, the trend and significance of differences in EF outcomes between the groups were the same as above.
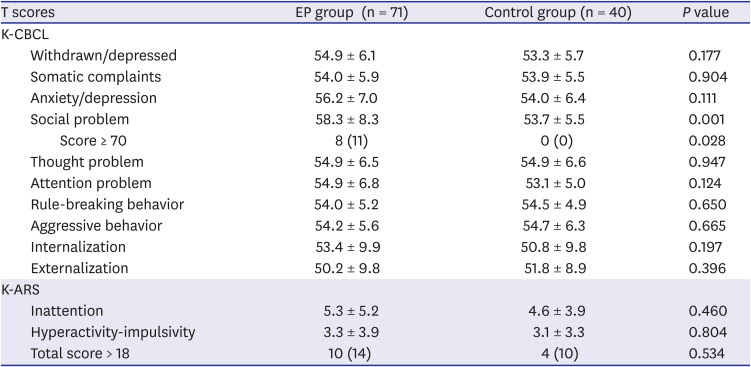
Except for the social problem domain, the K-CBCL scores were not different between the two groups (P = 0.001). After establishing the cutoff values for the T-score (≥ 70 for all domains except for internalization and externalization, which used ≥ 60), the two resultant groups showed no differences with respect to the number of abnormal T-scores, except for the social problem domain (8 [11%] vs. 0 [0%]; P = 0.028). Furthermore, the K-ARS scores did not differ between the EP and term control groups. The number of cases with a total score above 18 (the cutoff value for high ADHD risk) did not significantly differ between the EP and term control groups (10 [14%] vs. 4 [10%]; P = 0.534) (Table 4). When analyzing the EP group after exclusion of five neurologically impaired children, the trend and significance of differences in behavioral outcomes between the groups were the same as above.
Table 4
Behavioral outcomes
FSIQ-related factors in the preterm group
The EP group was divided into two subgroups using a cutoff value of 85 for the FSIQ, and subgroup analysis was performed to delineate perinatal and socioeconomic risk factors in EP children with an FSIQ below 85. The low FSIQ group had a higher incidence of small-for-gestational age infants, albeit without statistical significance (P = 0.070), and showed a significantly lower birth weight (P = 0.008) than the normal FSIQ group, with no difference in gestational age at birth. Additionally, the low FSIQ group significantly more frequently presented with sepsis and necrotizing enterocolitis (P = 0.005 and P = 0.037, respectively) and had a significantly longer duration of antibiotic use than the normal FSIQ group (P = 0.014). The rate of laser treatment for ROP was significantly higher in the low FSIQ group than in the normal FSIQ group (P = 0.002).
At NICU discharge, the weight, height, and head circumference Z-scores were significantly lower in the low FSIQ group than in the normal FSIQ group. Parental education level or family income level did not show any significant difference between the groups (P value of 0.051 for family income) (Table 5).
Table 5
Factors related to FSIQ in the preterm group (n = 71)
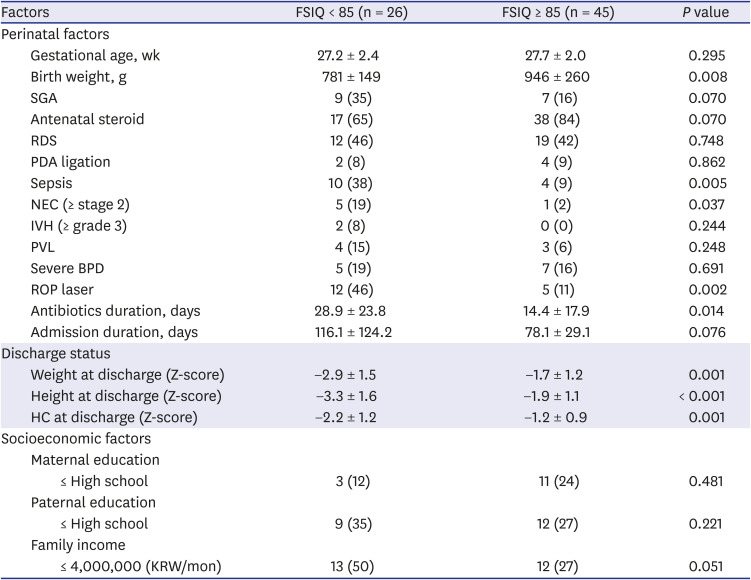
Data are shown as mean ± standard deviation or number (%).
FSIQ = full-scale intelligence quotient, SGA = small-for-gestational age, RDS = respiratory distress syndrome, PDA = patent ductus arteriosus, NEC = necrotizing enterocolitis, IVH = intraventricular hemorrhage, PVL = periventricular leukomalacia, BPD = bronchopulmonary dysplasia, ROP = retinopathy of prematurity, HC = head circumference, KRW = Korean Won.
Independent risk factors of low IQ in the preterm group
After adjusting for birth weight, multiple logistic regression analysis was performed to delineate independent risk factors for low FSIQ in the EP group. Following stepwise selection to solve multicollinearity, laser treatment for ROP and low discharge weight Z-score were identified as independent risk factors for low FSIQ in the EP cohort. EP children who received laser treatment for ROP had an 8.8-fold increased risk of a low FSIQ score, and a 1-point increase in discharge weight Z-score decreased the risk of a low FSIQ score by approximately half in this EP cohort (Table 6).

DISCUSSION
In the study cohort, EP children exhibited significantly lower FSIQ score and level of EF than their term peers, 37% of which had mild-to-severe cognitive problems at school age, compared to only one child with mild cognitive problems in the control group. Except for social immaturity, the behavioral problems of EP children were not different from those of their term peers. In this study cohort, independent risk factors for FSIQ score < 85 in EP children were the presence of severe ROP and low discharge weight Z-score.
This is the first Korean study on the outcomes of school-aged children born EP. Recent developments in perinatal medicine and neonatal intensive care have considerably improved the survival of preterm infants in Korea.7 Nonetheless, data from the Korean Neonatal Network, which is the national VLBW registry in Korea, indicated that approximately 60% of infants were followed up for 18–24 months (corrected age) and that only one-third of the infants who were followed up had undergone a formal developmental test.18 A report from a single Korean NICU showed that 17% of VLBW children aged 3 to 5 years had a below-average FSIQ score (< 85).19 However, there is limited information on the longer-term prognosis of this high-risk population.The cognitive outcomes in this study implicate a substantial social burden on preterm children. In this study, 13% and 24% of preterm children had an IQ < 70 and 70 ≤ IQ < 85, respectively; these results are comparable to the findings of the Victorian EP cohort study,20 which reported IQ < −2 SD and IQ −2 SD to −1 SD in 10–14% and 19–33% of children, respectively, at 8 years of age. Similar to our study, the EPIPAGE study,21 which included children born before 33 weeks of gestation, reported that 11% and 20% of children exhibited an IQ < 70 and 70≤ IQ < 85, respectively, at 5 years of age. Moreover, owing to the upward drift in the tendency of IQ scores over time, their term peers’ cognitive outcomes are important with respect to comparison. The FSIQ score was significantly lower, even in EP children with an IQ ≥ 85 (n = 45), than in term-birth controls with each index score showing a similar pattern. Furthermore, among the EP tests, EP children with an IQ ≥ 85 exhibited significantly lower Stroop test results than term-birth controls (data not shown). Therefore, IQ ≥ 85 in EP children does not guarantee a reassuring cognitive outcome.While IQ is not a proxy for learning potential, EF has been suggested to be a better indicator of academic success.22 In the study cohort, EP children exhibited significantly lower EF outcomes based on the Stroop test, CCTT, and WCST results than normal term-birth controls. Only the interference score in the Stroop test was higher in the EP group, which may reflect less disturbance in color selection due to reduced literacy in the EP group. The results indicate deficits in inhibition control, sequencing, psychomotor speed, and cognitive flexibility among preterm children. A previous meta-analysis of EF showed that the scores of VP children for verbal fluency, working memory, and cognitive flexibility were below the scores of term-birth controls by 0.3–0.7 SD.4 The Victorian Study Group had recently reported high rates of abnormal scores for working memory (up to 37%) and planning and organizing areas (up to 29%), although a parent-completed questionnaire was used.23 Arguments exist among researchers that poor EF in VP infants might reflect a delay rather than a deficit. Nevertheless, a large geographic cohort study involving EP and ELBW infants revealed that most children exhibit stable EF from 8 to 18 years of age.24 Additionally, studies in young adulthood have reported difficulties in selective attention, inhibitory control, cognitive flexibility, and working memory. Therefore, EF difficulties in preterm children are generally regarded as evident before they enter the classroom and persist throughout their lifespan.5
Increased inattention and internalizing behaviors have been documented in preterm children.4 In the study cohort, omission errors in the visual ATA, which represent attention components among the EF tests, were significantly greater in EP children. However, the K-CBCL and K-ARS results did not indicate significant inattention problems in EP children. The K-CBCL and K-ARS are parent-reported tests, whereas the ATA is a performance-based test; thus, the test method might have resulted in such discrepancies. Four EP children were on medication for ADHD diagnosis, and all scored over 19 in the K-ARS; in contrast, no children in the term control group were diagnosed with ADHD. Even when including children with an ADHD diagnosis, the results of the parent-reported tests did not indicate significant between-group differences. Social immaturity is a component of internalizing behaviors; together with other meta-analyses, the present study identified significant problems in social immaturity in the EP group.
Low cognitive function in preterm infants is a complex multifactorial issue. Both biological and environmental factors can influence the cognitive outcomes of preterm children. The EPIPAGE study showed that social factors such as low social status and lack of breastfeeding predicted both mild and severe cognitive deficiencies, whereas medical factors such as cerebral lesions predicted the most severe cognitive deficiencies.25 A systematic review pointed out that perinatal risk factors for the cognitive development of VP children seem to diminish over time as environmental factors become more evident; thus, parental education status influences the cognitive outcomes of preterm children.26 Nevertheless, after adjustments for birth weight, the presence of severe ROP and low discharge weight, which are early biological factors, were identified as independent risk factors for low cognitive outcomes of preterm children in this study cohort.
Severe ROP can be defined as ROP treated with laser photocoagulation. Several cohort studies have indicated the association of severe ROP with poor cognitive outcomes in preterm children.27282930 An unfavorable early biological injury promoting ROP may concurrently aggravate the developing brain. Severe ROP has been reported to be related to poor white-matter maturation, irrespective of PVL or IVH, and is independent of visual outcomes.31 Insulin-like growth factor-1 concentration has been suggested to be related to ROP and white-matter development, using the retina as a “window into the brain.”31
A low discharge weight Z-score, which mainly results from extrauterine growth restriction, is common among EP infants and may reflect various factors, including genetic factors, inadequate nutrition, morbidities affecting nutrient requirements, endocrine problems, and treatments.3233 Several studies have confirmed that low discharge weight in preterm infants is a risk factor for poor neurodevelopmental outcomes, which is similar to the results of our study. In particular, Franz et al.34 reported that the weight SD score at birth and an increase in the weight SD score from birth to discharge influenced the mental processing composite score among VLBW infants at approximately 6 years of age, whereas Belfort et al.35 showed that greater weight gain to term was related to better neurodevelopmental outcomes at a corrected age of 18 months among VP infants. The Neonatal Research Network of Japan analyzed weight growth velocity during NICU hospitalization as a predictive factor for neurodevelopmental impairment at 3 years of age.36
As IVH and PVL were not frequent in our study cohort, cerebral morbidity did not therefore appear to be a determinant of low cognitive outcomes. Additionally, majority of the study cohort had an intact family structure, and socioeconomic status and parental education levels were not remarkably different. These cohort characteristics seem to have diminished the environmental impact on cognitive outcomes in this study.
In our analysis, we focused on risk factors for low cognitive outcomes using the FSIQ cutoff value. EF outcomes were correlated with FSIQ scores in the study cohort; furthermore, after controlling for FSIQ score, each of the indices in the EP group was not significantly different between groups (data not shown). This is understandable, considering that the Wechsler Intelligence Scale for Children-Fourth Edition contains Working Memory Index and Processing Speed Index subscales, both of which are highly associated with EF, including working memory, cognitive flexibility, and attentional control. Nonetheless, we should bear in mind that an IQ test would not appropriately evaluate EF37 and controlling for IQ when assessing group differences in EF might result in overcorrected results.38 The present study has some limitations. First, this study was conducted at a single center and included relatively fewer patients than other large-scale follow-up studies, such as the Victorian, EPICure, and EPIPAGE studies. Second, because term-birth controls were voluntarily recruited at the time of this study, perinatal data were not longitudinally collected and socioeconomic status was not matched to the preterm cohort. Nonetheless, this cohort study also has several strengths. First, the follow-up rate was comparable to that reported by other large-scale studies. Second, this study included a contemporary term-control group, thereby ensuring that comparisons were not outdated.
In conclusion, low FSIQ and low EF were common among EP children, and 37% of them had mild-to-severe cognitive problems at school age. Except for social immaturity, the behavioral problems of children born preterm were not evident, as compared to those of their term peers. In this study cohort, independent risk factors for FSIQ < 85 among EP children were the presence of severe ROP and a low discharge weight Z-score. As the first Korean study with long-term follow-up that evaluated the cognitive and behavioral outcomes of school-aged children born EP, the findings of this study can be used as basic data by the international community. Further persistent efforts to manage the long-term outcomes of EP infants and research on EF interventions are required.
 XML Download