

 PDF
PDF Citation
 Print
Print


INTRODUCTION
Depression is one of the most common mental health disorders, with more than 264 million people suffering from it in the world.1 In 2017, depression was reported to be the 3rd leading cause of years lived with disability, following low back pain and headache.2 Furthermore, depression is expected to be the leading contributor to global disease burden by 2030.3
Depression has also been found to be a strong risk factor for suicide, which is a major public health concern in South Korea.1 According to the Organization for Economic Co-operation and Development (OECD) estimates, South Korea's suicide rate is more than double the average suicide rate of OECD countries.4 Thus, assessing the prevalence and associated sociodemographic factors of major depressive disorder (MDD) in the general population is important for health resource distribution and appropriate screening and treatment developments.
Notably, there has been an increasing interest in estimating whether changes in the prevalence of depression have occurred over time. In fact, several previous studies have indicated a gradual increase in depression5; however, a previous meta-analysis using age-adjusted estimates found no such changes in its prevalence.6 In other words, there is no consensus on whether the prevalence of depression has been increasing over time since it is difficult to assess trends over time by directly comparing general population data with different measures of depression, all of which lead to various results.7
Furthermore, previous studies have identified differences in the prevalence of depression according to sociodemographic factors (e.g., gender, income, education). Generally, its prevalence increases in adolescence, peaks in middle age, and declines in old age.8 Although, some studies have conversely shown that the prevalence of depression increases with age.9 Additionally, depression has been found to be more prevalent among women, people living alone, and unmarried people, and has been also associated with unemployment, lack of education, and low income.910
Despite these findings, there is little data on the trends of depression over time in these sociodemographic subgroups. Since the prevalence of depression is also in\\xef\\xac\\x82uenced by sociocultural contexts,11 it is necessary to study the epidemiology of MDD across countries with different sociocultural backgrounds.
Therefore, we aimed to investigate the temporal trend of MDD prevalence by each sociodemographic factor subgroup using large, nationwide general population samples in South Korea, obtained from surveys conducted in 2001, 2006, and 2011.
Go to : 
METHODS
Study design and sample
The Korean Epidemiologic Catchment Area (KECA) study is a nationally representative survey of mental health in the general population aged 18 years or older, which is conducted every five years since 2001. The present study was based on three KECA studies conducted in 2001, 2006, and 2011, known as the KECA-2001, KECA-Replication (KECA-R) and KECA-2011, respectively. In all three surveys, multistage stratified sampling was conducted across 12 catchment areas, wherein each included sample was independent of the other. From these surveys, a total of 18,807 participants (6,275 in KECA, 6,510 in KECA-R, and 6,022 in KECA-2011) replied to the face-to-face interview using the same structured diagnostic tool, i.e., the Korean version of the Composite International Diagnostic Interview (K-CIDI), which was validated by Cho et al.12 in accordance with the World Health Organization guidelines.
Assessment of sociodemographic factors
During interviews, we collected information on the sociodemographic factors and health-related lifestyles of each participant. Specifically, gender was divided into two groups (men and women), age into four groups (18–29, 30–44, 45–59, and 60 or more years), years of education into three groups (less than 10, 10–12, and more than 13 years), employment into two groups (employed and unemployed [including students and housewives]), partner status into two groups (living with partner and not living with partner), household income into two groups (above average and below average), residence into two groups (urban and rural), drinking behavior into two groups (normal and at-risk drinking), and smoking status into two groups (never-smoker and ever-smoker [including current smoker and ex-smoker]). Meanwhile, household income was classified based on the average monthly income per household for one year, as presented by the Statistics Korea (approximately, 2001, 2000 USD; 2006, 2400 USD; 2011, 3000 USD).131415 Additionally, regarding drinking behavior, the “at-risk drinking” group was classified according to the National Institute on Alcohol Abuse and Alcoholism guidelines (men, consuming 4 or more drinks on any day or 14 or more drinks per week; women and men over 65 years of age, consuming 3 or more drinks on any day or 7 or more drinks per week; women over 65 years of age, consuming 3 or more drinks per week), whereas all other drinking behaviors were classified as normal.16
Assessment of MDD
MDD during the past 12 months was assessed in accordance to the K-CIDI mood section, which is based on the Diagnostic and Statistical Manual of Mental Disorders, Fourth Edition (DSM-IV).12 First, the respondents were asked whether they had experienced either a depressed mood and/or a loss of interest during the past 12 months. Next, those who responded affirmatively to any of these items were asked additional questions to evaluate whether they met the MDD criteria. Respondents were required to answer questions on whether they had experienced the 25 depressive symptoms, including appetite change, sleep disturbance, psychomotor change, fatigue, guilty/worthlessness, concentration difficulty, and suicide.
Statistical analysis
In this study, we used survey-specific weights to adjust the sample to approximate the age and sex distributions, as defined by the Statistics Korea census for each year. We then compared the sociodemographic factors by year using χ2 tests; logistic regression analyses according to gender was performed to calculate the MDD 2006-to-2001 odds ratio (OR) and MDD 2011-to-2001 OR stratified by sociodemographic group. To eliminate the impact of other sociodemographic variables as potential confounding factors, we controlled these variables as covariates in the logistic regression analysis of each sociodemographic variable.
Moreover, we calculated the variance inflation factor (VIF) to evaluate multicollinearity among the predictor variables, finding no multicollinearity in the logistic regression analyses (overall VIF ≤ 2). Furthermore, we evaluated goodness-of-fit using the Hosmer-Lemeshow test, and a two-sided test at the level of 0.05 was used to assess statistical significance. We performed all statistical analyses in this study using the Statistical Package for Social Science program (version 25.0; IBM Co., Armonk, NY, USA).
Ethics statement
This study was conducted with the approval of the Institutional Review Board (IRB) of the Seoul National University College of Medicine (IRB No. for KECA, C-0602-041-168; KECA-R, C-0607-009-177; KECA-2011, C-1104-092-359). All subjects were informed about the study beforehand and gave written consent to participate.
Go to :
RESULTS
The study sample consisted of 18,658 respondents (6,206 in KECA, 6,466 in KECA-R, and 5,986 in KECA-2011) who completely undertook the full psychiatric diagnostic interview, including questions on MDD, sociodemographic factors, and health-related lifestyles. The sociodemographic characteristics of the respondents are further presented in Table 1. Overall, the respondent characteristics showed certain changes throughout 2001, 2006, and 2011. In particular, age distribution (there has been a shift towards older age), education (a proportion of people with 0–9 years of education showed an increasing and a subsequently decreasing trend), partner status (there has been a gradual increase in the number of people who do not live with their partners), household income (a proportion of the below-average household income group showed a decreasing and subsequently increasing trend), residence (a proportion of people living in the urban area showed an increasing and subsequently decreasing trend), drinking behavior (a proportion of the at-risk drinking group showed an increasing and subsequently decreasing trend), and smoking status (the number of never-smokers has gradually increased) all showed changes throughout the years. Furthermore, the 12-month MDD prevalence in 2001, 2006, and 2011 increased over time from 1.6%, 2.5%, to 3.1%, respectively. Notably, a 93.8% increase (from 1.6% to 3.1%) occurred in the 12-month prevalence of MDD from 2001 to 2011.
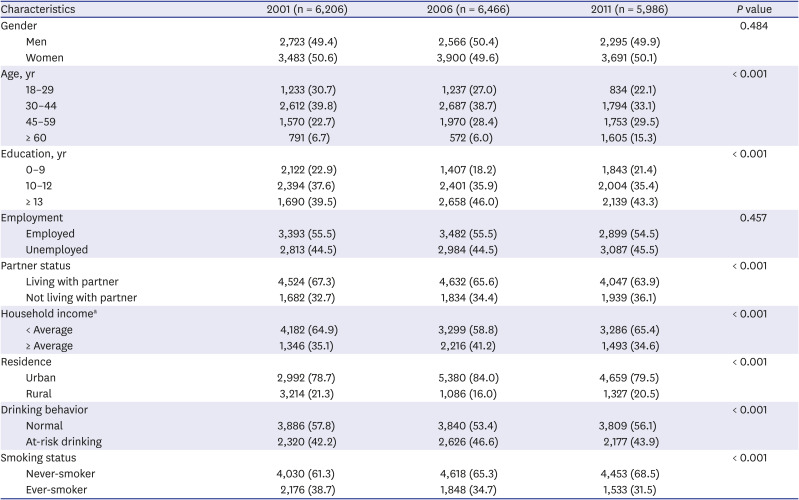
Table 1
Sociodemographic characteristics of the participants
Values are presented as number (%). Number: unweighted; %: weighted by age and sex to the population census for each year.
aData were missing because the respondent responded “unknown/refusal” (2001: 678 cases, 2006: 951 cases, 2011: 1,207 cases).
![]()
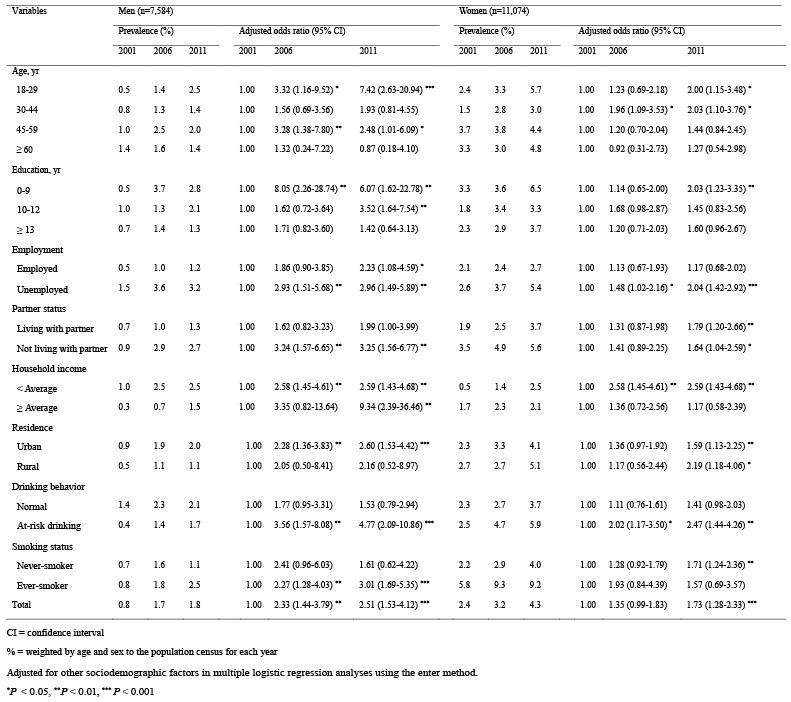
Following the analysis of sociodemographic characteristics, we analyzed the trend of MDD prevalence for sociodemographic factor subgroups according to gender. Among the men, from 2001 to 2006, and to 2011, the prevalence of MDD continued to increase significantly in the 18–29 years of age (2006: adjusted OR [AOR], 3.32; 2011: AOR, 7.42), at-risk drinking (2006: AOR, 3.56; 2011: AOR, 4.77), not living with a partner (2006: AOR, 3.24; 2011: AOR, 3.25), smoker (2006: AOR, 2.27; 2011: AOR, 3.01), unemployed (2006: AOR, 2.93; 2011: AOR, 2.96), urban residence (2006: AOR, 2.28; 2011: AOR, 2.60), and below-average household income groups (2006: AOR, 2.58; 2011: AOR, 2.59). In particular, the prevalence of MDD continued to increase significantly in the 18–29 years of age group, not living with a partner group, and smoker group in men, but not in women (Table 2).
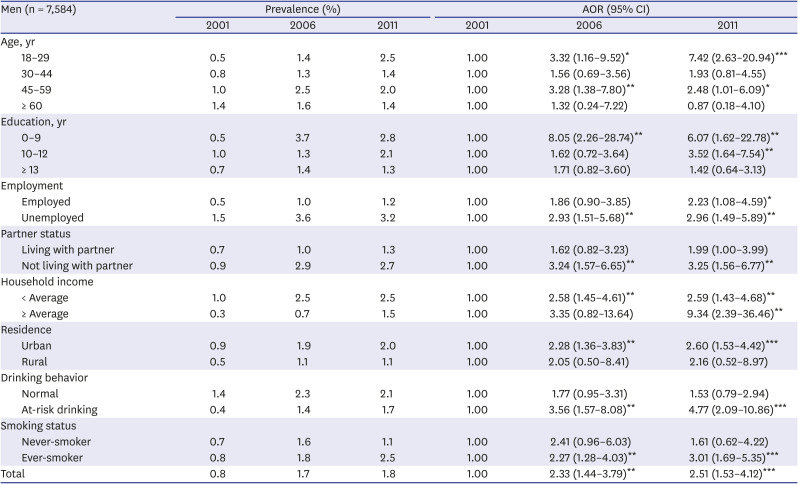
Table 2
Time trends in the 12-month prevalence of major depressive disorder for sociodemographic risk factors in mena,b
AOR = adjusted odds ratio, CI = confidence interval.
a%: weighted by age and sex to the population census for each year; bAdjusted for other sociodemographic factors in multiple logistic regression analyses using the enter method.
*P < 0.05; **P < 0.01; ***P < 0.001.
![]()
Meanwhile, among women, for the same aforementioned years, the prevalence of MDD continued to increase significantly in the below-average household income (2006: AOR, 2.58; 2011: AOR, 2.59), at-risk drinking (2006: AOR, 2.02; 2011: AOR, 2.47), unemployed (2006: AOR, 1.48; 2011: AOR, 2.04), and 30–44 years of age groups (2006: AOR, 1.96; 2011: AOR, 2.03). In other words, a significant increase in the prevalence of MDD was observed in subgroups related to economic factors (Table 3).
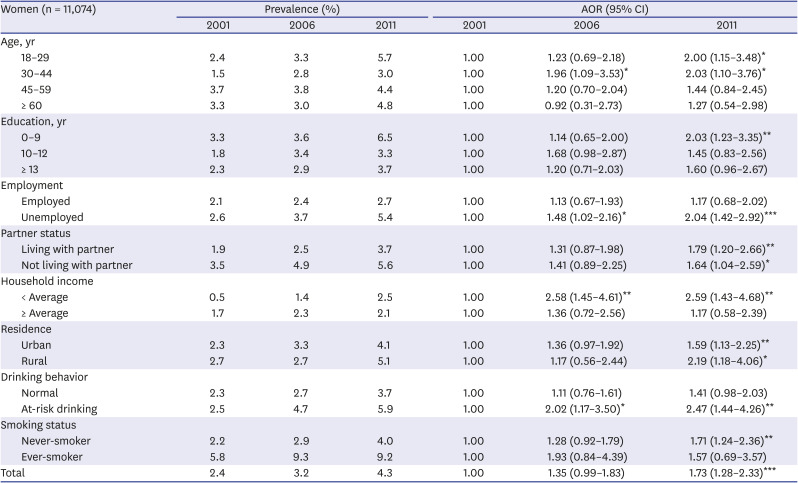
Table 3
Time trends in the 12-month prevalence of major depressive disorder for sociodemographic risk factors in womena,b
AOR = adjusted odds ratio, CI = confidence interval.
a%: weighted by age and sex to the population census for each year; bAdjusted for other sociodemographic factors in multiple logistic regression analyses using the enter method.
*P < 0.05; **P < 0.01; ***P < 0.001.
![]()
Go to :
DISCUSSION
The current study investigated the 12-month prevalence of MDD and its trend for each sociodemographic factor subgroup according to gender using a nationwide representative sample of respective adult general populations in 2001, 2006, and 2011. Results showed that the prevalence of MDD in the general population of South Korea increased steadily throughout 2001, 2006, and 2011, which differed according to sociodemographic factor subgroups based on gender. Among them, the increase in the prevalence of MDD was the greatest in the 18–29 years of age group, at-risk drinking group, and not living with a partner group in men, whereas the prevalence increase was greatest in the below-average household income group, at-risk drinking group, and unemployed group in women.
Notably, we found statistically significant differences in several sociodemographic factors between the 2001, 2006, and 2011 surveys. In particular, proportions of older adults and those who did not live with a partner were found to have gradually increased over 2001, 2006, and 2011. As average life expectancy increases and the birth rate declines, the proportion of older age in the total population of Korea is gradually increasing.17 In fact, the median age has been increasing to 32.3 years in 2001, 35.4 years in 2006, 38.5 years in 2011 and 44.3 years in 2021 according to Statistics Korea.18 The results of this study reflect this situation. In addition, the main reasons for the increase in the number of people who do not live with their partner has been attributed to the increase in unmarried and late marriages due to a change in the perception of marriage, and the increase in middle-aged people living alone due to economic conditions or the education of their children.19 Furthermore, the increase in the number of elderly people living alone due to bereavement or grey divorce may also be a cause.19
The 12-month prevalence of MDD was noted to be 1.6% in 2001, 2.5% in 2006, and 3.1% in 2011, which were all lower than those in the US, showing values of 6.5% in 2006 and 6.9% in 2011.20 These results are consistent with previous studies showing that the prevalence of depression was lower in Asian countries than in Western and Middle Eastern countries.21 However, studies that investigated the prevalence using a simple questionnaire, rather than a face-to-face interview, have reported that the prevalence of depressive symptoms was higher in South Korea than in the US or Europe,22 thus it was estimated that depressive disorder diagnosis using a questionnaire was greatly influenced by sociocultural characteristics.23 Particularly, it was found that Koreans have a higher threshold to respond as “having symptoms” in the DSM-IV diagnostic criteria questions for depressive disorder, tending to instead choose socially desirable answers as compared to Americans, which is why MDD was less likely to be observed in South Korea than in the US.24 This phenomenon was consistent with findings of a generally lower depression prevalence in Asian countries such as South Korea than in Western countries, when the Western DSM-IV diagnostic criteria were applied for depression assessment.23
These results are also in agreement with previous studies indicating a slight increase in depression over time.5 In our study, the prevalence of MDD increased by about 93.8% (1.6% vs. 3.1%) in the study population from 2001 to 2011, showing a seemingly faster MDD prevalence increase in South Korea than in the US.520 South Korea has experienced rapid sociocultural changes and economic growth over the past few decades, and competition has become rampant in these situations. These rapid changes have resulted in rising housing prices, employment stress, and high divorce rates, all of which are closely related to depression in South Korea.5
In the men of our study, the prevalence of MDD in the 18–29 years of age group steadily increased in 2001, 2006, and 2011, which was significantly greater than the increase in prevalence reported for other sociodemographic factors. In South Korea, university students have been reported to be under tremendous stress due to excessive competition, studies, and preparation for employment.25 Moreover, among the OECD countries, South Korea has the second highest university tuition fees, second only to the USA,26 thus expensive tuition fees have become a major issue. Furthermore, youth unemployment has been raised as a serious social problem worldwide. In South Korea, from 2001 to 2011, unemployment among those over 30 years of age averaged between 2% and 4%, whereas among those under 30 years of age averaged between 7% and 8%.27 These social environments could increase the psychological burden on young male adults, leading to the observed increase in MDD prevalence.
It has been established that not living with a partner can also affect the prevalence of MDD,910 and this study showed a corresponding increase in the prevalence of MDD in men who did not live with their partners. These high increments in prevalence may be attributed to the following reasons. First, there is the absence of social and emotional support provided by the partner, wherein those who do not live with a partner are prone to feeling emptiness and loneliness in society.28 Consequently, this long-lasting loneliness becomes more likely to lead to depression beyond social isolation.29 Second, it is difficult to reduce the stress associated with economic hardship since economic resources cannot be shared with their partners.28 In South Korea, an increasing number of men and women are living alone. According to the Statistics Korea, the number of single-person households has increased from 15.5% in 2000 to 27.2% in 2015, which has become the main household type and since has continued to increase.30 As such, the prevalence of MDD similarly appears to have increased as well, with increasing the number of people not living with their partners.
Meanwhile, in women for the same aforementioned years, the increase in the prevalence of MDD was the highest in the below-average household group, which could be attributed to the “feminization of poverty”, a serious global phenomenon gradually emerging in South Korea.31 Causes of poverty among women include family factors (e.g., inequality in the distribution of gender resources and division of labor within the family), problems in the labor market, and issues in social security systems.32 In South Korea, despite large gains in female educational attainment with changing family structures, labor market outcomes remain poor for women as seen in the following: 1) although the female labor force participation rate has been steadily increasing, it is still below the OECD average; 2) the gender pay gap in South Korea has remained the highest among the OECD countries since 2002.33 Moreover, women's participation in the labor market is characterized by the “M curve”, which decreases during marriage and childbirth and increases as their children grow up.33 Despite recent changes in South Korean policy, such as the development of childcare and parental leave, the effect of social policy reform remains limited as the workplace cultures still include socializing after work, long working hours, and a seniority-based payment system and promotion, all of which discriminate against women taking a maternity leave.33 As the feminization of poverty continues, it is estimated that the prevalence of MDD among below-income women has increased significantly in South Korea.
Unemployment was also associated with an increased prevalence of MDD among women, wherein the loss of one's job may lead to poor mental health through loss of status in the society and loss of structured time and activities with a collective purpose.34 Furthermore, financial strains accompanying job losses typically forces unemployed individuals to experience psychological distress.34 These individuals become more likely to have feelings of isolation, loss of self-esteem, and feelings of hopelessness.34 With the average life expectancy increasing steadily in South Korea, older generations with a livelihood in industrial sites are found to be working longer and retiring later as compared to previous years.35 Therefore, the need for new employment in South Korea has been declining. As a result, unemployed people in the younger age group may not have access to job-related benefits including social contact, time structure, and social status, all of which may contribute to an increased risk of depression. In addition, this societal change may pressure the older age group to engage in working activities despite their approaching retirement age, making it difficult for them to get financial support from their children.36 Thus, the prevalence of MDD may have increased significantly in the unemployed group over the 10-year period due to these reasons.
Regarding alcohol intake, the prevalence of MDD in the at-risk drinking group was found to be increased in both men and women. In South Korea, the overall rate of high-risk drinking among Korean adults was 17.6% (men, 25.5%; women, 7.6%), which increased as compared to the overall rate of 14.9% in 2005 (men, 23.2%; women, 4.6%).37 There are several possible explanations for the relationship between depression and alcohol.38 The first is that at-risk drinking could cause difficulties in employment or legal problem, which in turn makes it difficult to maintain a normal social life, thus leading to depression.38 Second, alcohol can cause metabolic changes that could induce depression. In other words, ethanol reduces methylenetetrahydrofolate reductase (MTHFR) production, in which, low folate levels due to decreased MTHFR could induce depression.38 Given these reasons, it is estimated that the prevalence of MDD in the at-risk drinking group has continued to increase as at-risk drinking in men and women increases.
Despite these findings, this study has several limitations. First, this study was cross-sectional in design. Thus, the causality between MDD and the sociodemographic factors could not be investigated, and only associations were assumed. Second, since the information on individual depressive symptoms and diagnosis were based on retrospective reports and were collected only from respondents, the results may have been influenced by information bias (i.e., recall bias, reporting bias). In particular, the prevalence of MDD is likely to be underreported due to the fear of disclosing a history of depression.39 Accordingly, it is necessary to conduct longitudinal studies using information collected through various resources, such as family, to confirm accurate causal relationships and to minimize information bias. Third, sampling was performed on the general population belonging to households, thus, institutionalized inpatients and homeless people were not included in this study. In addition, among all the questions asked, many participants responded with “unknown/refusal” in the question related to household income. Unlike the other variables, the household income item has been reported to be the most likely unresponded question for participants who do not want to disclose their income, as seen in previous studies.40 Therefore, further research is needed to minimize such responses to household income inquiries. Nevertheless, our study had the following strengths. To date and to the best of our knowledge, this is the first time MDD prevalence trends for subgroups of sociodemographic factors in the general adult population in South Korea have been investigated. Furthermore, we employed a validated structured interview tool, the K-CIDI, to assess MDD in this population.
In conclusion, even after controlling all sociodemographic variables, an increasing trend in the 12-month prevalence of MDD over time was observed. In particular, in terms of increasing MDD prevalence, men aged 18–29 years old and women in low-income households were found to be the most vulnerable to depression. This study may provide significant information for public policymakers to allocate sufficient health resources to vulnerable groups and for clinicians to develop appropriate screening and treatment strategies.
Go to :
 XML Download