

 PDF
PDF Citation
 Print
Print


INTRODUCTION
Noise pollution has emerged as a crucial environmental problem for humans since decades. In ancient Rome, rules were established in this regard as noise generated by iron wagon wheels disturbed stones on pavements, which interfered with sleep and caused irritation to the Romans.1 As such, excessive noise is a factor that seriously inflicted harm on human health and interfered with daily activities at school, work, and home and at leisure.123 Nevertheless, difficulties were observed in controlling environmental noise compared with other pollutants due to the lack of knowledge on the impacts of noise on humans, dose-response relationships, and defined standards regarding acceptable levels of noise.1234
Accordingly, numerous studies were conducted on the effect of noise on humans. Such studies reported that noise can lead to cardiovascular56 and psychophysiological effects, provoke annoyance, reduce performance, and change social behavior.78910 Furthermore, emotional distress,2 sleep disturbance,78911 psychosomatic disorders,1213 and even psychiatric hospital admission rates14 were known to be associated with noise exposure. Among various noises, residential noise pollution, in particular, was a stress factor that interferes with subjective well-being and threatens individual health. Residential noise pollution was directly and easily recognized and was related to other local threats, such as air pollution or lack of green space for recreational activities.1516
Similar to adults, noise is a major issue for children. Exposure to road traffic noise may be related to increased hyperactivity, added emotional symptoms in children,171819 and sleep problems. Tiesler et al.20 report that noise measured using day-evening-night sound level at the most exposed facade of a building is related to increased hyperactivity/inattention, whereas noise at the least exposed facade increased the relative odds on emotional symptoms. Lastly, the authors discuss that nocturnal noise is associated with all sleep problems.
For decades, literature has highlighted the significant association between autonomic nervous system (ANS) and mortality due to cardiovascular diseases, such as sudden cardiac death.2122 Moreover, previous studies revealed that individuals with high noise sensitivity (NS) are more likely to experience activation in the ANS consequent to physiological oversensitivity to environmental noise.2324 Heart rate variability (HRV) was represented as one of the most promising quantitative, noninvasive markers of autonomic activity, whereas variations in HRV were evaluated using a number of methods.212526 Moreover, HRV was associated with affective symptoms, such as depression, anxiety, and stress. In a previous study on Katrina survivors, respondents that reported high levels of post traumatic stress disorder and depression symptoms exhibited higher resting heart rates and lower parasympathetic baseline HRV activities than controls.27 Likewise, in another study on children, emotional symptoms such as anger, anxiety, and sadness were associated with the low root mean square of successive differences (RMSSD) and power in high-frequency range (HF), whereas among these symptoms, anxiety and anger primarily were associated with increased power in low-to-high frequency range (LF/HF) ratio.28
Detailed studies on the effect of noise on sleep disturbances or ANS activity in children are limited. Furthermore, studies that observe the effect of individual factors on sleep by measuring road traffic noise and aircraft noise separately are limited, whereas research that considers NS in children or conducts HRV for 24 hours in children is scarce.
To address these research gaps, the present study aimed to determine the effects of noise on the sleep scale and HRV in children according to residential road traffic noise, aircraft noise, and NS. A survey was conducted on a large number of children from various socioeconomic and demographic backgrounds to assess the impact of noise levels in two metropolitan cities (Seoul and Ulsan) and NS on health. Moreover, the study (a) employed specific assessment tools for sleep that are applicable to epidemiological studies instead of nonspecific health scales, (b) measured HRV for 24 hours to reduce bias, and (c) adjusted for the income level of each subject to minimize factors that may influence the results. The study hypothesized that high levels of noise and NS will be negatively associated with sleep scales and autonomous activities in children and that the influence of such noise-related variables will be dependent on socio-environmental factors.
METHODS
Study population
The study selected two elementary schools in Yangcheon-gu, Seoul, and two in Nam-gu, Ulsan. A total of 150 students and their parents from each school were enrolled in the study (n = 600). According to the noise map, one elementary school was classified to be with high noise levels, whereas one elementary school was designated to be with low noise levels for each city.
Students and parents from each school received and completed a questionnaire, and thereafter, returned the questionnaire to the school. All subjects agreed to participate and provided informed consent. Out of 600, 126 subjects were unable to complete the survey data. Thus, a total of 474 subjects were included in the analysis. In the case of aircraft noise, data were available only in Seoul, so we analyzed it with 199 subjects. And in the course of the analysis, an additional 10 out of 474 road traffic data were excluded due to missing data (9 did not respond to the monthly income, 1 did not respond to part of the children's sleep habits questionnaire [CSHQ]), and 5 subjects who did not respond monthly income were also excluded from the aircraft data. Finally, the effect of road traffic noise was analyzed with 464 subjects, and aircraft noise was analyzed with 194 subjects.
Demographics
Basic demographic information included age and gender. The parents also provided data on their residential environment, socioeconomic variables (e.g., monthly household income, marital status, level of education, and occupation), medical history, and other factors. Among the socioeconomic variables, monthly income was categorized as < 5 million Korean won (approximately 5,000 US dollars) or ≥ 5 million Korean won. Psychiatric history, which includes mental disorders, such as attention deficit hyperactivity disorder, specific learning disorders, communication disorders, intellectual disabilities, autism spectrum disorders, motor disorders, depression, and conduct disorders, was obtained by asking parents to fill the questionnaire and indicate the presence or absence of any of the above-mentioned conditions in their children. Furthermore, analysis included development-related variables, such as maternal illness during pregnancy (e.g., diabetes, hypertension, preeclampsia, and thyroid disease), maternal age at birth, premature birth, low weight at birth, and passive smoking.
NS
NS was assessed using a visual analog scale that was translated according to the International Organization for Standardization Technical Specification 15666:2003. It was assessed via single-item questionnaires, which were completed by parents. Items were rated using an 11-point Likert-type scale with scores of 0 and 10 indicating the lowest and highest sensitivity, respectively. The responses of children were measured and provided by their parents.
Considering previous studies that reported the importance of NS instead of noise itself, the current study stratified the results by NS. We divided the NS into two groups with a cutoff score of 5, which is the midpoint of the scale, and conducted an analysis between the two groups for CSHQ and HRV. For road traffic noise, subjects were divided into 145 and 318 for high and low NS, respectively, and HRV was measured for 29 and 63 in each group. And for aircraft noise, subjects were divided into 63 and 130 for high and low NS, respectively, and HRV was measured for 13 and 22 in each group.
Noise level
The study used the day-night average sound level (Ldn) of road traffic and aircraft noise as the indicator of noise level. Ldn described the cumulative noise exposure during an average day. Noise level measurements were conducted between 10 pm and 7 am, which were artificially increased by 10 dB before averaging. Since the 1970s, the US government agencies used Ldn as an indicator for assessing the impact of environmental noise.29 The level of road traffic noise at the exterior wall of a residential building was calculated via a noise prediction software (Cadna A, DataKustik, Germany) based on a noise map created by a research team in 2014. The software modeled the buildings, terrain, and roads of the study area; measured traffic volume, speed limitations, and ratio of large cars; and verified the differences between predicted and measured values. Furthermore, the study used the radar data of each aircraft movement on its specific flight path and converted data to emission lines. The radar data contained information on flight altitude, aircraft type, and speed.
The CSHQ
CSHQ was a retrospective, 45-item parent-reported questionnaire used in a number of studies that examined sleep behavior in young children.30 The items were related to the key domains of sleep that cover major clinical sleep complaints, such as bedtime resistance, sleep onset delay, sleep duration, sleep anxiety, night waking, parasomnias, sleep-disordered breathing, and daytime sleepiness. Each item was rated using a three-point scale with the following frequencies: “rarely” (if the sleep behavior occurred zero to one time/week), “sometimes” (two to four times/week), and “usually” (five to seven times/week). The parents of each subject were requested to recall sleep behaviors that occurred over a typical and recent week.
HRV
Each subject was attached with three-lead portable instruments on the anterior chest for 24 hours to record ECG. Later, the research staff visited schools and retrieved the devices. Based on the given ECG recordings, the study measured various parameters in time and frequency domains. For the time domain, heart rate at any point in time or intervals between successive normal complexes were determined.252631; RMSSD of successive normal-to-normal (NN) intervals, difference between adjacent NN intervals of 50 ms or more (NN50), NN50/total number of all NN and standard deviation of successive differences was measured. The normal beat-to-beat (NN) interval or instantaneous heart rate from atrioventricular nodular depolarization was determined by detecting each QRS waveform, which represents ventricular activation, in continuous ECG recordings.252631 The frequency domain (power spectral density) analysis described periodic vibrations of the heartbeat signal, which was segregated into various frequencies and vibrations in the atrioventricular rhythm of the heart to provide information on relative intensity (defined as change or power).252631 This power spectrum consisting of a frequency band of 0 to 0.5 (or 0.4) Hz was divided into four bands, namely, power in ultra-low-frequency range, power in very low-frequency-range, power in low-frequency range (LF), HF.26 Of these, we used LF and HF in this analysis.
Statistical analysis
The study compared the demographic characteristics, socioeconomic variables, and other factors that may influence the development of subjects in the high- and low-noise exposure groups. The study employed the t-test to compare between-group continuous variables and the χ2 test to compare categorical variables. Analysis of covariance was conducted to compare between-group CSHQ and HRV variables using monthly income as a covariate. Data were analyzed using IBM SPSS Statistics for Windows Version 24.0 (IBM, SPSS Inc., Chicago, IL, USA).
RESULTS
Demographic characteristics
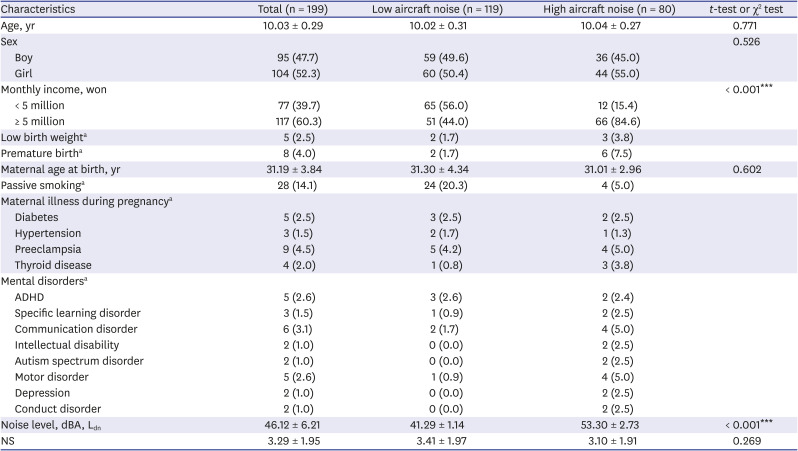
The mean age for all subjects was 10.01 ± 0.31 years (boys = 223 [47%]). According to road traffic noise, the average noise levels for the low- and high-noise exposure groups were 53.71 ± 10.20 and 68.74 ± 2.79 dB, respectively. This value was 56.03 ± 10.20 dB for the overall group (Table 1). Subjects with a history of low birth weight accounted for 4.0% of the total sample, which was significantly different by group. In the low-noise group, only eight subjects (2.2%) out of 358 (three were excluded due to incomplete data) had a history of low birth weight, whereas 11 out of 113 (9.7%) in the high-noise group had (χ2 < 0.001). Moreover, 5.1% of the subjects exhibited a history of premature birth with a significant difference between the low- and high-noise exposure groups. In the low noise group, 14 (3.9%) of 358 subjects had a history of premature birth, whereas 10 of 113 (8.8%) in the high-noise group were born prematurely (χ2 = 0.037). No significant differences were observed between the low- and high-noise groups with respect to other demographic, socioeconomic, birth-related, and medical and mental health status variables. The mean score for NS was 3.24 ± 1.95 (low-noise group: 3.29 ± 1.93; high-noise group: 3.05 ± 1.98). Table 2 presents the demographic characteristics according to aircraft noise. The average noise level for the two groups was 46.12 ± 6.21 dB with significant differences observed in monthly income.
Table 1
Demographic and socioeconomic variables of subjects according to road traffic noise
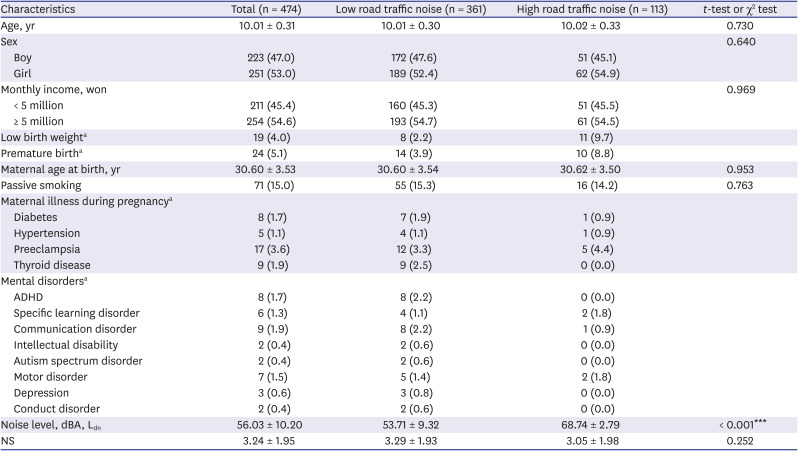
Table 2
Demographic and socioeconomic variables according to aircraft noise
CSHQ and HRV according to road traffic noise
The section presents the result of the comparison of students living in areas with high and low noise levels based on road traffic noise. No significant difference was observed in the total scores for CSHQ (low-Ldn group: 45.39 ± 6.34; high-Ldn group: 44.45 ± 5.35; P = 0.164) and for the subscale (Tables 3 and 4). For HRV, the LF (low-Ldn group: 2,017.46 ± 1,403.13; high-Ldn group: 1,446.09 ± 1,191.34; P = 0.070) and total power (low-Ldn group: 9,991.05 ± 7,206.79; high-Ldn group: 6,935.26 ± 5,260.25; P = 0.052) for children in the high-noise group were low but statistically nonsignificant. In other words, no difference exists in the frequency and power domains based on residential noise.
Table 3
Summary of primary children's sleep habits questionnaire according to road traffic noise
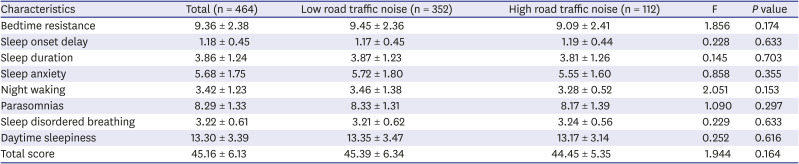
Table 4
Summary of primary heart rate variability according to road traffic noise
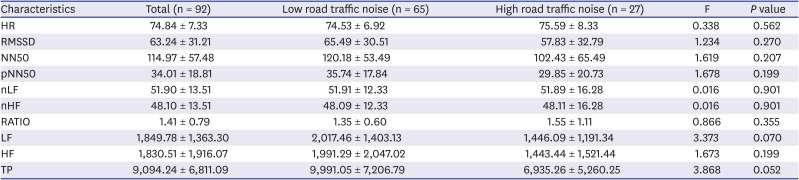
Data are shown as mean ± standard deviation.
HR = heart rate, RMSSD = root mean square of successive difference of successive normal-to-normal, NN50 = difference between adjacent normal-to-normal intervals of 50 ms or more, pNN50 = NN50/total number of all normal-to-normal, nLF = low-frequency power in normalized units, nHF = high-frequency power in normalized units, RATIO = LF/HF ratio, LF = power in low-frequency range, HF = power in high-frequency range, TP = total power.
CSHQ and HRV according to aircraft noise
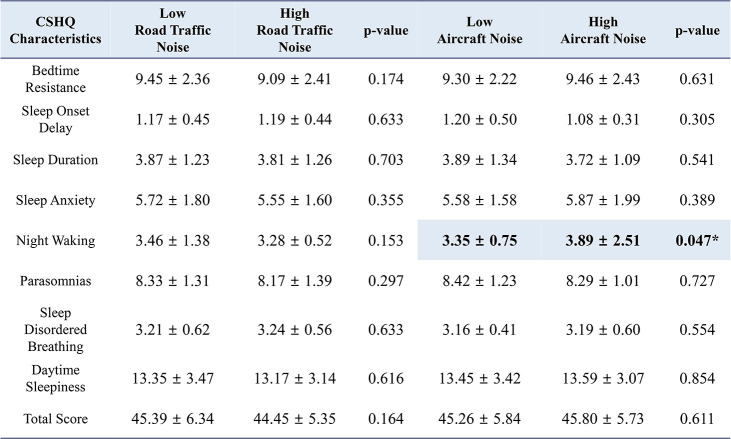
Children in the high-noise group produced higher scores for night waking in CSHQ compared with the low-noise group (high-Ldn group: 3.89 ± 2.51; low-Ldn group: 3.35 ± 0.75; P = 0.047; Tables 5 and 6). Conversely, no significant difference was found for HRV.
Table 5
Summary of primary children's sleep habits questionnaire according to aircraft noise
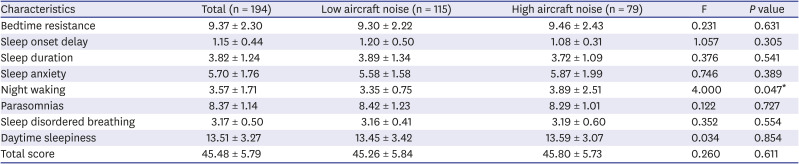
Table 6
Summary of primary heart rate variability according to aircraft noise
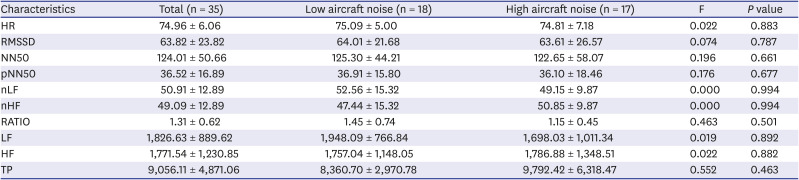
Data are shown as mean ± standard deviation.
HR = heart rate, RMSSD = root mean square of successive difference of successive normal-to-normal, NN50 = difference between adjacent normal-to-normal intervals of 50 ms or more, pNN50 = NN50/total number of all normal-to-normal, nLF = low-frequency power in normalized units, nHF = high-frequency power in normalized units, RATIO = LF/HF ratio, LF = power in low-frequency range, HF = power in high-frequency range, TP = total power.
CSHQ and HRV according to NS
Among the CSHQ items, the high-NS group displayed higher scores for sleep anxiety (low-NS group: 5.53 ± 1.67; high-NS group: 6.00 ± 1.89; P = 0.008) and parasomnias (low-NS group: 8.20 ± 1.36; high-NS group: 8.51 ± 1.23; P = 0.021) (Supplementary Tables 1 and 2). Meanwhile, no significant results were noted in terms of HRV.
HRV according to CSHQ
The study divided the children into two groups based on their CSHQ scores and analyzed the HRV results (Table 7). As a result, the group with high-CSHQ scores indicated lower HF (low-CSHQ group: 2,468.84 ± 2,899.83; high-CSHQ group: 1,551.24 ± 1,199.51; P = 0.030) and lower scores for RMSSD, which was statistically nonsignificant (low-CSHQ group: 71.95 ± 42.72; high-CSHQ group: 59.43 ± 24.02; P = 0.070).
Table 7
Summary of heart rate variability according to CSHQ
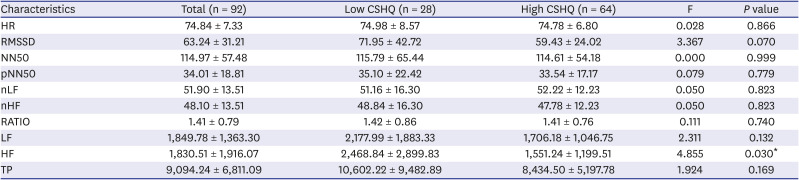
Data are shown as mean ± standard deviation.
CSHQ = children's sleep habits questionnaire, HR = heart rate, RMSSD = root mean square of successive difference of successive normal-to-normal, NN50 = difference between adjacent normal-to-normal intervals of 50 ms or more, pNN50 = NN50/total number of all normal-to-normal, nLF = low-frequency power in normalized units, nHF = high-frequency power in normalized units, RATIO = LF/HF ratio, LF = power in low-frequency range, HF = power in high-frequency range, TP = total power.
*P < 0.05.
CSHQ and HRV according to noise level and as stratified by NS
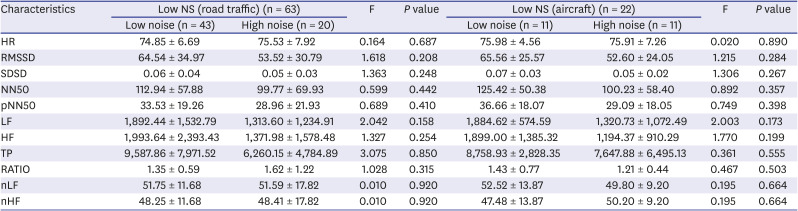
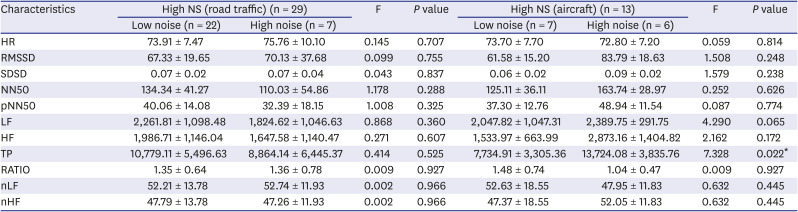
When stratified for NS, no significant results were obtained for the low- and high-NS groups in terms of CSHQ according to road traffic noise (Tables 8-11). However, according to aircraft noise, the degree of bedtime resistance in the high-NS group was higher at the high noise level than at the low noise level (low noise level: 9.51 ± 2.11; high noise level: 10.14 ± 2.77; P = 0.049). In the low-NS group, the scores for night waking was higher at the high noise level but statistically nonsignificant (low noise level: 3.30 ± 0.64; high noise level: 3.96 ± 2.92; P = 0.062). In terms of HRV, the value for the frequency domain was generally low in the high-noise group at low NS but nonsignificant (P ≥ 0.05).
Table 8
Summary of children's sleep habits questionnaire according to noise level and as stratified by NS (low NS)
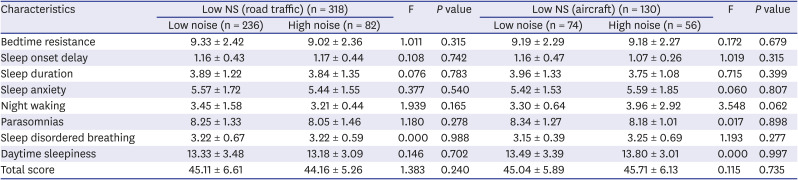
Table 9
Summary of heart rate variability according to noise level and as stratified by NS (low NS)
Data are shown as mean ± standard deviation.
NS = noise sensitivity, HR = heart rate, RMSSD = root mean square of successive difference of successive normal-to-normal, SDSD = standard deviation of successive differences, NN50 = difference between adjacent normal-to-normal intervals of 50 ms or more, pNN50 = NN50/total number of all normal-to-normal, LF = power in low-frequency range, HF = power in high-frequency range, TP = total power, RATIO = LF/HF ratio, nLF = low-frequency power in normalized units, nHF = high-frequency power in normalized units.
Table 10
Summary of children's sleep habits questionnaire according to noise level, stratified by NS (high NS)
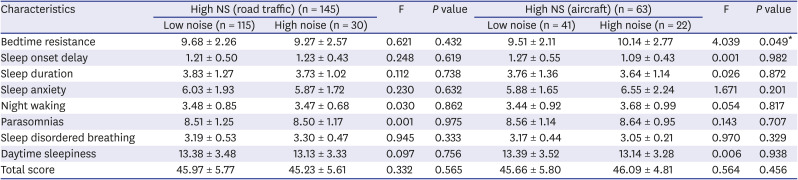
Table 11
Summary of heart rate variability according to noise level, stratified by NS (high NS)
Data are shown as mean ± standard deviation.
NS = noise sensitivity, HR = heart rate, RMSSD = root mean square of successive difference of successive normal-to-normal, SDSD = standard deviation of successive differences, NN50 = difference between adjacent normal-to-normal intervals of 50 ms or more, pNN50 = NN50/total number of all normal-to-normal, LF = power in low-frequency range, HF = power in high-frequency range, TP = total power, RATIO = LF/HF ratio, nLF = low-frequency power in normalized units, nHF = high-frequency power in normalized units.
*P < 0.05.
DISCUSSION
The large-scale epidemiological study investigated the associations between noise-related variables, such as road traffic noise, aircraft noise, and NS, and the sleep scale and autonomic activity in children, which were measured using the CSHQ and HRV. Furthermore, the study adjusted for the effect of income level. Road traffic noise (based on 65 dB) exerted no significant effect on the sleep scale and 24-hour HRV in children, whereas aircraft noise (based on 45 dB) exhibited an effect on night waking (P = 0.047) according to the CSHQ. In addition, NS was found to be negatively associated with sleep anxiety and parasomnias in children.
Several studies reported that road traffic noise is negatively linked with the mental health and learning ability of children and adolescents, particularly those in low-income groups.32 However, the current study observed no correlation between road traffic noise and sleep in children, which is in contrast with the result of Tiesler et al.20 The reasons for the current results are as follows. First, the effect size of road traffic noise was small among various factors that are related to sleep in children. Second, parental evaluation was used to generate the report on children's sleep patterns. Third, long-term continuous exposure may be necessary to fully observe the effect of noise on sleep in children. Fourth, individual adaptation to the physical environment of noise may occur.3334 Finally, the study does not rule out that a difference exists between the actual and perceived noises of individuals.35
Previous studies reported on the psychological effects of aircraft noise. For example, Basner et al.36 conducted a pilot study on an area near to the Philadelphia International Airport. The authors found that those living nearby, within the vicinity of the airport, reported poorer sleep quality and health than the control group. When queried about sleep quality during the past month, participants reported their sleep as less refreshing, leading to increased difficulty in falling asleep, and lacking sufficient sleep compared with those living in the control region. In addition, those living in the airport region tended to rate their health as worse, expected their health to become worse, and stated that their health was not comparable to participants in the control region. However, when asked in the morning about the previous night's sleep, a difference in evaluation was noted between the control and airport study regions. However, this difference is nonsignificant between groups. In 2001, Haines et al.37 conducted a follow-up study and concluded that chronic exposure to aircraft noise is associated with high levels of annoyance, perceived stress, poor reading comprehension, and less sustained attention. Moreover, Bullinger et al.38 investigated the psychological health of children using a standardized quality of life scale and demonstrated a significantly worse total quality of life after 18 months of exposure to aircraft noise. In this regard, the current study confirmed the effect of aircraft noise on night waking in children.
Aircraft noise is highly intermittent as opposed to the continuity of road traffic noise. Thus, the noise situation is characterized by maximum sound pressure levels that clearly stand out from background noise.39 In addition, the current study deduced that although the actual decibel level of aircraft noise was less than that of road traffic noise, aircraft noise has significant relationship with night waking in children, which is likely an effect of the characteristics of noise instead of the absolute volume of noise. Other studies reported that impulse noise (i.e., intermittent noise), such as aircraft noise, induces more severe annoyance than road traffic noise, maintains equal volume (continuous noise), and causes sleep disturbance even at 45 dB or less.40 Thus, situations with aircraft noise are characterized by single dominant events, which could lead to its difference from road traffic noise.39 Therefore, these two primary sources of traffic noise differ in their impact on sleep. Brink et al.41 investigated the cross-sectional association between nighttime road, rail, and aircraft noise exposure, and the probability of high levels of sleep disturbance. The association was strongest for aircraft noise, whereas it was weakest for road traffic noise. Moreover, Douglas and Murphy42 investigated source-based subjective responses to sleep disturbance from transportation noise, where aircraft noise was found to be the most disturbing followed by road and rail noises.
The present study found that road traffic noise and aircraft noise were not associated with HRV. Sim et al.43 examined traffic and speech noise and found that the relationship between traffic noise and HRV was not significant. The LF/HF ratio, which reflects ANS activity, became more stable. However, the change was statistically nonsignificant. Kraus et al.44 examined the association between individual daytime noise exposure and HRV and reported that concurrent increases of 5 dB in Leq < 65 dB were associated with increases in HR and LF/HF ratio power and decreases in LF and HF power. Associations with cardiac function were less pronounced for noise ≥ 65 dB.44 In the current study, children with sleep difficulties indicated a low proportion of HF in HRV, which is consistent with those for adults with sleep difficulties (low-CSHQ group: 2,468.84 ± 2,899.83; high-CSHQ group: 1,551.24 ± 1,199.51; P = 0.030; Table 7). However, establishing any meaningful result in relation to HRV is difficult, which may be due to the small number of children who underwent ECG measurement. Therefore, further research is required.
Children who are highly noise-sensitive displayed high scores for bedtime resistance (low aircraft noise group: 9.51 ± 2.11; high aircraft noise group: 10.14 ± 2.77) when living in areas with high levels of aircraft noise (although the effect of road traffic noise was unclear) (P = 0.049; Tables 10 and 11). A previous study reported that NS, instead of noise itself, increases this susceptibility, which moderates the reactions of individuals to noise and is associated with elevated susceptibility to nonauditory effects.23 It is demonstrated that children with high NS displayed high proportions of psychopathological symptoms, such as depression and insomnia.23 In other words, the effects may differ according to the character of an individual, such as NS, and the characteristic (or combination) of environmental noise (i.e., road traffic, aircraft, and railway). However, conversely, changes in NS may have occurred as a result of the child's mental disorder preceded, or negative results of sleep quality may have been obtained regardless of NS. Therefore, additional research is needed to clarify the precedence relationship in this regard as well.
The strengths of the current study are as follows. First, the study is a large-scale epidemiologic one that focuses on the effects of noise on sleep in children according to source. Especially, studies that compare the nonauditory effects of noise on children by categorizing their sources (i.e., road traffic noise and aircraft noise) are limited. Second, according to noise level, the 24-hour HRV of 92 children was used to measure the direct noise-related scale instead of using non-direct methods, such as questionnaires or psychological tests. Third, previous studies used subjective noise estimates or outdated noise maps, whereas the current study measured noise levels more accurately by creating noise maps using direct measurements.
The study has its limitations. First, other factors that disturb sleeping patterns, such as noises from television, radios, and computers, and inter-floor noise were overlooked. And, the length of residence was not researched in this study, but the health effects of noise may be affected by the length of residence. Therefore, bias due to these factors is possible. Second, the results may not be used to assess micro-arousal in children as the parents filled out the CSHQ. Therefore, the results were produced only through subjective evaluation of the parents about their children. Third, although quantitatively comparing the mental problems of children and adolescents between the high- and low-noise groups is possible, the study could not determine the actual prevalence of the disease. The reason for this notion is that the difference in the CSHQ scores between the two groups does not imply a disease in children. Fourth, children and adolescents who require special education or children with behavioral problems who find difficulty in adjusting to general schools were likely excluded as the sample composed of students enrolled in the general classes of the elementary/middle schools. As a result, evaluating the association of moderate or severe intellectual, learning, and behavior disabilities to noise is difficult. In addition, the summation was not implemented in the analysis phase, so there may be cases that correspond to both each high road traffic noise group and high aircraft group. Therefore, it cannot be excluded that the noise level overlaps each other, resulting in a synergistic effect. Finally, the possibility of error cannot be ruled out due to the small sample size subjected to ECG measurement. And confounding effects may have occurred in HRV results if subjects are taking drugs, but in this study, we could not correct for this because subjects were not investigated whether or not they were taking drugs. Therefore, future studies should conduct a comprehensive correction for sleep-related variance after taking account of these limitations.
In conclusion, this study is epidemiological in nature and investigates the nonauditory effects of noise on sleep in children. The results indicate that road traffic noise was not significantly related to the outcome variable, whereas aircraft noise was related to night waking in children during sleep. In addition, the negative effects of noise on sleep anxiety and parasomnias are observed in individuals with high levels of NS. Similarly, after stratifying according to NS, the effects of road traffic noise and aircraft noise differed, which may be due to the characteristics of the two sources of noise.
 XML Download