

 PDF
PDF Citation
 Print
Print


INTRODUCTION
Health problems caused by particulate matter (PM) are important societal issues. Particles smaller than 50 μm are referred to as total suspended particles (TSPs), and PM is referred to as very small particles. Particles smaller than 10 μm and 2.5 μm are referred to as PM10 and PM2.5, respectively.1 In 2013, the World Health Organization's International Agency for Research on Cancer designated PM as a group 1 carcinogen.2
The correlations of PM with various diseases, including cognitive-behavioral disorders, respiratory diseases, cardiovascular diseases, and ocular diseases, have been reported in many studies.34567 In particular, exposure to air pollutants during pregnancy is associated with the development of congenital anomalies, low birth weight, stillbirth, and neonatal respiratory diseases.891011 A recent study has shown links between PM2.5 exposure and the development of congenital cardiovascular anomalies.12 Further, exposure to PM2.5 before and early in pregnancy is reported to increase the risk for congenital hypospadias.13
Some Korean studies have examined the relationship between PM exposure concentration during pregnancy and low birth weight. However, very few have examined the relationship between PM exposure and congenital anomalies. Moreover, there is a complete lack of studies studying the relationship between PM exposure and congenital anomalies in the field of pediatric surgery.1415 South Korea began measuring PM2.5 concentrations in five metropolitan areas in 2013, with nationwide measurement and reporting of PM2.5 concentration forecasts beginning in 2015.1 As of October 2020, PM2.5 was being measured at 558 monitoring stations nationwide, with a growing number of stations.16 Before 2015, PM2.5 was measured at only a few stations in Korea, representing a wide area. Therefore, computing maternal exposure to PM2.5 based on these measurements would inevitably introduce substantial errors.
Thus, it is prudent to shed light on the relationship between PM2.5 exposure and congenital anomalies based on PM2.5 concentration data from 2015 onwards. Therefore, this study aimed to investigate the correlation between the PM2.5 exposure concentration during pregnancy and the incidence of congenital anomalies from 2015 onwards.
Go to : 
METHODS
Subjects
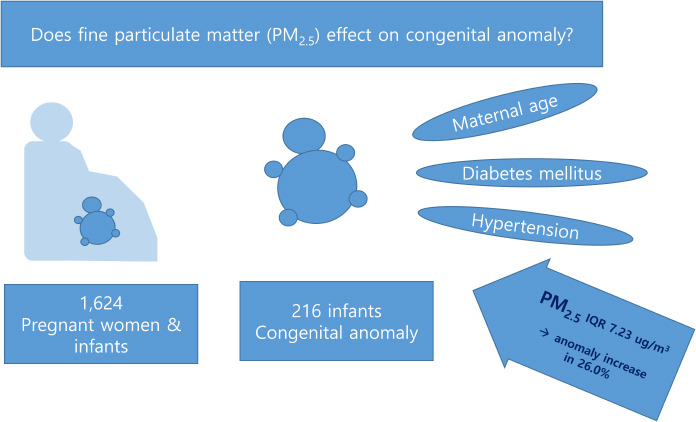
All the deliveries at Keimyung University Dongsan Medical Center between July 2016 and June 2019 (36 months) were considered. Mothers and infants with registered addresses in Daegu Metropolitan City were selected, assuming that a mother and her infant shared the same address. Cases of stillbirths, multifetal births, mothers transferred from a different region hospital, and infants born elsewhere and transferred to our hospital were excluded. In total, 1,624 mother-infant dyads born at ≥ 35 weeks of gestation were enrolled in the study.
Collection of clinical data
The electronic medical records (EMRs) of mothers and infants were retrospectively analyzed. Information about maternal age, delivery date, gestation period, diabetes mellitus (DM), hypertension, parity, mother's address, infant's sex, birth weight, 1-and 5-minute Apgar scores, the presence of congenital anomaly, and diagnosis, was collected. Patients' diagnosis codes and diagnoses recorded in the admission and discharge records were reviewed. Information about congenital anomalies was obtained by reviewing radiologic records. Congenital anomalies were classified into nervous, cardiovascular, gastrointestinal, urogenital, musculoskeletal, facial, and other anomalies. Addresses were anonymized by conversion to the mean monthly PM2.5 exposure concentration. Gestation was calculated based on the delivery day. Mean PM2.5 concentrations were calculated for the pregnancy period and by month. The day of delivery was not used in the analysis. Only non-personally identifiable variables were used in the analysis.
Computation of the pregnancy period
The pregnancy period was divided into months and trimesters based on the delivery date and clinically estimated gestation period. The month of the first day of pregnancy was set as the reference month (month one of pregnancy). The month of delivery was set as the final month of pregnancy.
Analysis of PM2.5 concentration at the mother's address
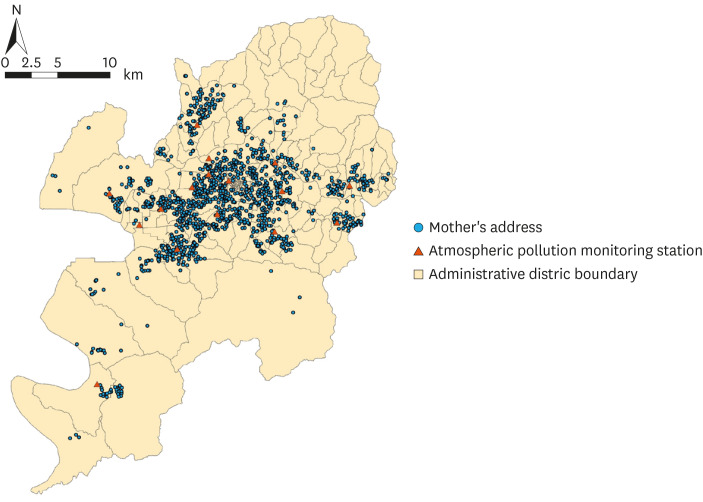
The mean monthly PM2.5 concentration during pregnancy was calculated based on each mother's address. AirKorea of the Korea Environment Corporation (http://www.airkorea.or.kr) provides six real-time atmospheric contamination indices, including PM2.5. Currently, PM2.5 is measured at 558 monitoring stations in 164 cities and districts nationwide. In this study, we used the monthly atmospheric and environmental reports provided by AirKorea to obtain data measured at stations within Daegu Metropolitan City during the analysis period (July 2015–June 2019). There were eight monitoring stations in Daegu Metropolitan City when we began our analysis. However, the number of stations increased to 16 by the end of the analysis period (June 2019). Therefore, data were obtained from 8 to 16 stations depending on the time point. Fig. 1 shows the locations of the 16 PM2.5 stations in Daegu Metropolitan City and the residences of the 1,624 mothers enrolled in this study.
In this study, the inverse distance weighting (IDW) technique was used, and the equation is shown below.17 IDW is widely used in computing PM10 or PM2.5 concentrations.1718
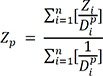
Zp: Interpolated value
Zi: Value measured from n observed values near Z
p: Power to explain weighted function
Dpi: distance between i and p
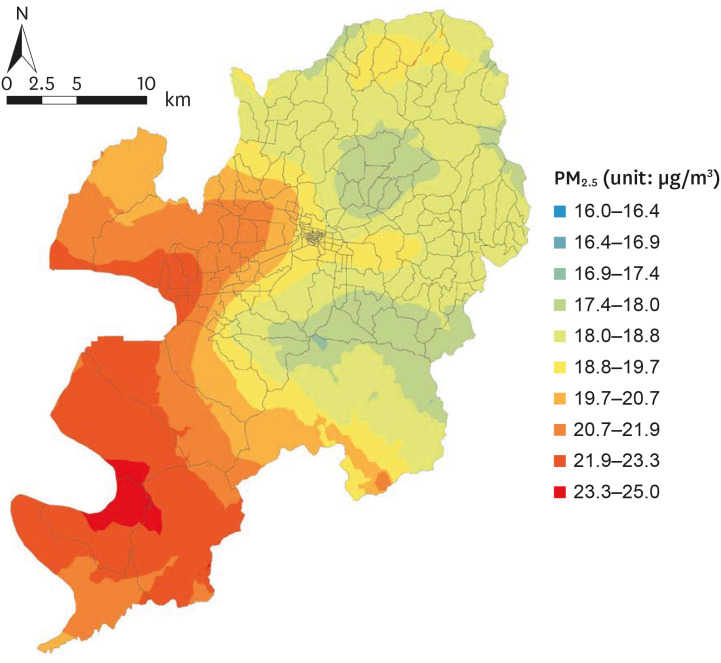
We developed a PM2.5 map for Daegu Metropolitan City for a 48-month period beginning one year before the delivery date (from July 2015 to June 2019) using the IDW technique. Fig. 2 is an example of a PM2.5 map of the Daegu Metropolitan City for June 2019. Mothers' (n = 1,624) monthly exposures to PM2.5 during pregnancy (month one of pregnancy to delivery) were then computed based on the monthly PM2.5 map. Spatial interpolation using the IDW technique was performed using ArcGIS 10.6 (ESRI, Redlands, CA, USA).
Statistical analysis
Statistical analysis was performed using IBM Corp. Released 2019. IBM SPSS Statistics for Windows, Version 26.0. Armonk, NY: IBM. Normality was tested with the Kolmogorov-Smirnov test. The means of quantitative variables were compared using independent t-tests. Qualitative variables were compared using the χ2 test. The predictors of congenital anomalies were analyzed using binomial logistic regression. Statistical significance was set at P value < 0.05.
Ethic statement
This study was approved by the institutional review board of Keimyung University Dongsan Medical Center (IRB No. 2020-09-045) and the requirement for informed consent was waived.
Go to :
RESULTS
There were 216 (13.3%) neonates born with congenital anomaly with respect to pediatric surgery in this study.
1. Demographic characteristics and classification of congenital anomalies
Table 1 shows the demographic characteristics of the mothers and their infants. Congenital anomalies were classified according to type in Table 2.
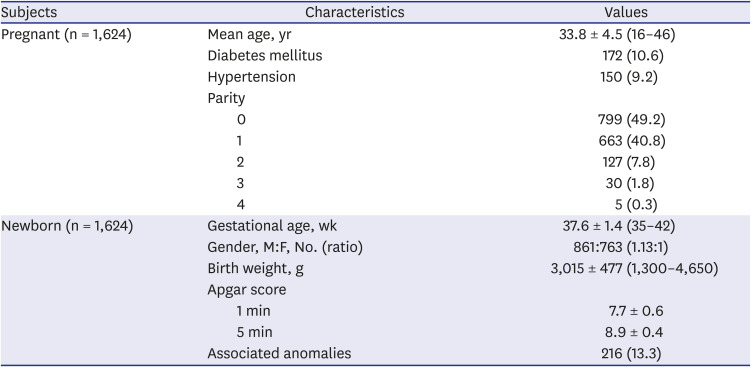
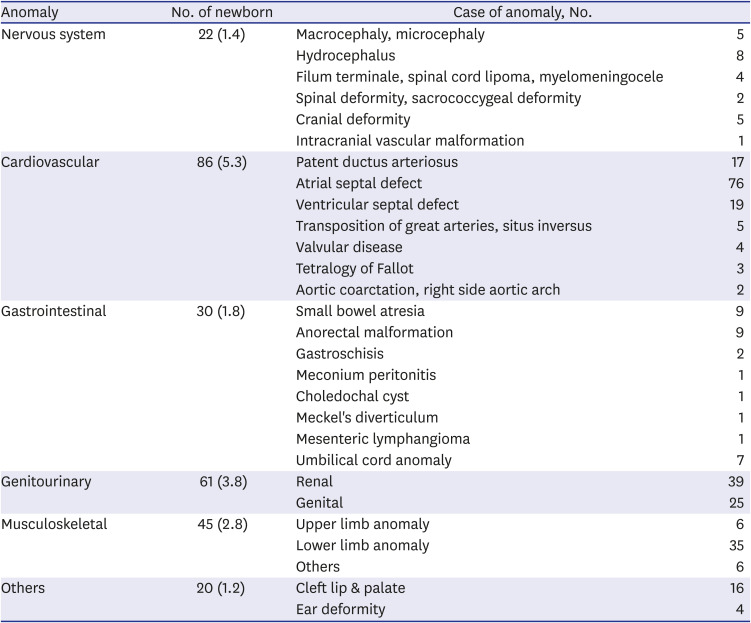
Table 1
Demographic characteristics of subjects
![]()
Table 2
Classification of associated anomalies in newborns
![]()
2. Differences in demographic characteristics between the congenital and non-congenital anomaly groups
Table 3 shows the differences in maternal ages, gestational ages, prevalence of maternal DM and hypertension, parity, birth weights, gender, and Apgar scores between the congenital and non-congenital anomaly groups.
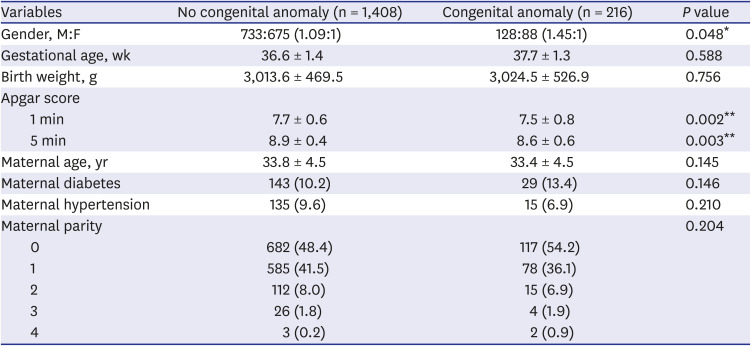
Table 3
Clinical differences according to the association with anomaly in newborns
Values are presented as patient number (%) or mean ± standard deviation.
*P < 0.05, **P < 0.01, ***P < 0.001.
![]()
3. Correlation between the incidence of congenital anomalies and PM2.5
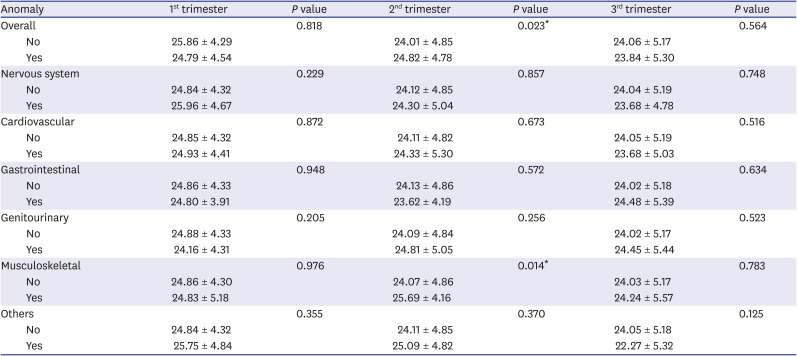
There was a significant association between the incidence of congenital anomalies in the second trimester (P = 0.023) with mean PM2.5 exposure of 24.01 µg/m3 and 24.82 µg/m3 in the non-congenital and congenital anomaly groups (Table 4). On the other hand, there was no significant difference in the incidence of congenital anomalies according to PM2.5 exposure in the first or third trimesters. The mean PM2.5 exposure in months three to eight was higher in the congenital anomaly group. Further, the incidence of congenital anomalies significantly differed statistically according to PM2.5 exposure in months five and six (Fig. 3A).
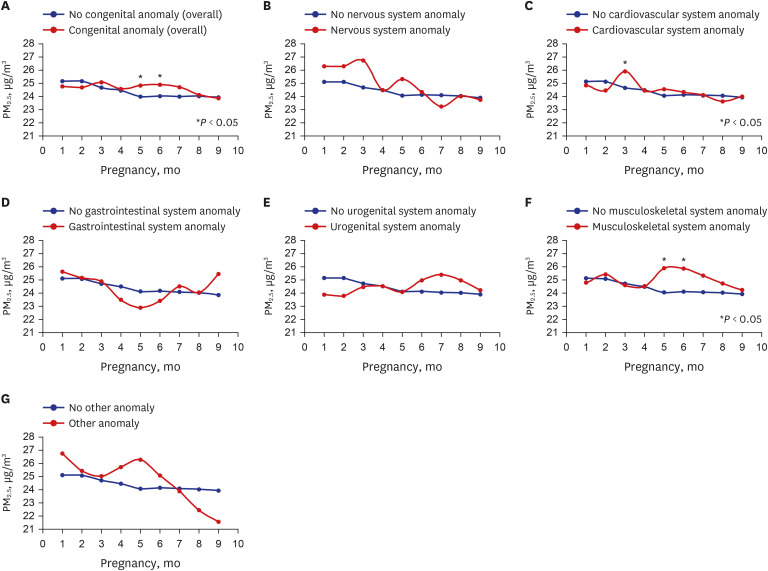 | Fig. 3Correlation between congenital anomalies and PM2.5 concentration (congenital anomaly by type). Correlation between (A) congenital anomaly and prenatal monthly PM2.5 exposure. (B) nervous system anomaly and prenatal monthly PM2.5 exposure. (C) cardiovascular anomaly and prenatal monthly PM2.5 exposure. (D) gastrointestinal anomaly and prenatal monthly PM2.5 exposure. (E) urogenital anomaly and prenatal monthly PM2.5 exposure. (F) musculoskeletal anomaly and prenatal monthly PM2.5 exposure. (G) other anomalies and prenatal monthly PM2.5 exposure.PM2.5 = particulate matter ≤ 2.5 μm.
|
Table 4
Comparison of mean PM2.5 concentration (µg/m3) by trimester according to the association with congenital anomaly
Values are presented as patient number (%) or mean ± standard deviation.
*P < 0.05, **P < 0.01, ***P < 0.001.
![]()
For specific types of congenital anomalies, there was no significant difference in the presence of nervous system anomalies associated with PM2.5 exposure by trimester (Table 4). The mean monthly PM2.5 exposure in months one to six was higher in the nervous system anomaly group though not statistically significantly (Fig. 3B). There was no significant difference in the presence of cardiovascular anomalies associated with PM2.5 exposure by trimester (Table 4). The monthly mean PM2.5 exposure in months three to seven was higher in the cardiovascular anomaly group, with a significant difference in PM2.5 exposure in month three between the two groups (Fig. 3C). There was no significant difference in the presence of gastrointestinal anomalies associated with PM2.5 exposure by trimester (Table 4). There were no statistically significant differences in the monthly PM2.5 exposure in all months between the two groups. However, the mean PM2.5 exposure in months one–three was higher in the gastrointestinal anomaly group (Fig. 3D). No significant difference was observed in the presence of urogenital anomalies associated with PM2.5 exposure by trimester (Table 4). In terms of monthly PM2.5 exposure, there were no statistically significant differences in PM2.5 exposure in all months between the two groups. However, the mean PM2.5 exposure was higher in months six–nine in the urogenital anomaly group (Fig. 3E). We analyzed the difference in the presence of musculoskeletal anomalies associated with PM2.5 exposure by trimester. We found that the presence of musculoskeletal anomalies significantly differed according to the second trimester PM2.5 exposure (P = 0.014) (Table 4). The PM2.5 exposures in the second trimester were 24.07 µg/m3 and 25.69 µg/m3 in the non-musculoskeletal and musculoskeletal anomaly groups, respectively, with a higher exposure in the musculoskeletal anomaly group. The monthly mean PM2.5 exposure level was generally higher in the musculoskeletal anomaly group in months two–nine. The difference in PM2.5 exposure in months five and six was statistically significant between the two groups (Fig. 3F). The association of PM2.5 exposure by trimester with the presence of other anomalies was not significantly different statistically (Table 4). The monthly mean PM2.5 exposure was higher in months one to six in the “other anomalies” group, though not statistically significant (Fig. 3G).
4. Effects of PM2.5 exposure by trimester on the incidence of congenital anomalies
We analyzed the effects of PM2.5 exposure on the incidence of congenital anomalies. Multivariable binomial logistic regression was performed to examine the effects of PM2.5 exposure by trimester after adjusting for maternal factors (age, DM, hypertension, parity) (Table 5).
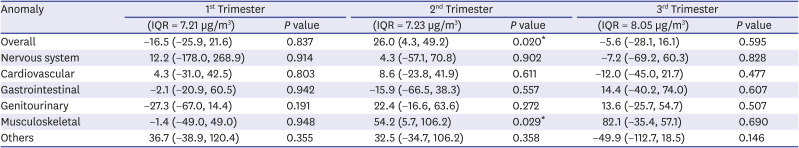
Table 5
Effects of PM2.5 by trimester on congenital anomalies by percentage per IQR increases of PM2.5 after adjusting from maternal factors (age, diabetes mellitus, hypertension, parity)
IQR = interquartile range, PM2.5 = particulate matter ≤ 2.5 μm.
*P < 0.05, **P < 0.01, ***P < 0.001.
![]()
The effects of second trimester PM2.5 exposure on the development of congenital anomalies were significant (P = 0.020). Overall congenital anomaly development increased by 26.0% (95% CI of 4.3% and 49.2%) per 7.23 µg/m3 increase of PM2.5 interquartile range (IQR) in the second trimester. The effects of second trimester PM2.5 exposure on the development of musculoskeletal anomalies were significant (P = 0.029). Musculoskeletal anomaly development increased by 54.2% (95% CI of 5.7% and 106.2%) per 7.23 µg/m3 increase of PM2.5 IQR in the second trimester.
Go to :
DISCUSSION
According to our results, overall congenital anomalies were significantly associated with second trimester PM2.5 exposure concentration. Most body organs develop between weeks three-eight after conception,19 this being a sensitive and high risk period concerning exposure to various teratogens, such as drugs, alcohol, and cigarettes, without being aware of their pregnancy. However, our results show that second trimester PM2.5 exposure can also increase the odds for congenital anomalies. These findings suggest that external factors may also induce anomalies even after the period of major organ development. A recent Korean study reported that PM2.5 exposure in the second trimester, in addition to the first trimester, also contributes to the development of cardiovascular, musculoskeletal, and urogenital anomalies.15
Compared with previous studies, our study had a relatively smaller sample size limited to a single region. Therefore, the absence of statistically different first trimester PM2.5 concentrations between the congenital and non-congenital anomaly groups should be carefully interpreted. It should not be interpreted simply as the absence of an effect of PM2.5 exposure in the first trimester on the onset of congenital anomalies. Although statistically insignificant, the nervous, cardiovascular, gastrointestinal, musculoskeletal, and other congenital anomaly groups tended to have higher PM2.5 exposure levels in the first trimester. Further research is required on this finding. Moreover, although statistically insignificant, the congenital anomaly group tended to show higher monthly PM2.5 exposure throughout the pregnancy (from 3rd to 8th month of pregnancy). This suggests that continuous exposure to high PM2.5 concentrations during pregnancy predicts congenital anomaly development.
Four weeks after conception, upper limb buds sprout followed by lower limb buds. The limbs develop in the distal direction from the trunk. Exposure to a teratogen during this period can result in amelia.20 Musculoskeletal anomalies can be induced not only by factors present in this sensitive period but also by the intrauterine environment or external factors post-conception. Club foot often occurs with syndactylia and can also be induced when the legs are placed in an abnormal position in the uterus. Our results showed that the second trimester PM2.5 exposure concentration was associated with musculoskeletal malformations. This suggests that malformations can be induced by the intrauterine environment or external factors after organ development.
In this study, we assumed that the PM2.5 concentration at the mother's registered address is the PM2.5 concentration to which the mother was exposed. The mothers' addresses were obtained from their medical records, and we could not verify whether the mothers had moved during their pregnancy. If they had moved during pregnancy, the PM2.5 concentration of their residence would also differ. Further, it is possible that mothers did not stay within their residence throughout the day. Thus, the places in which they spent much of their time should also be taken into consideration. If more time would be spent at the workplace, it would be necessary to consider the PM2.5 concentration near that workplace instead of that at the residence.
Previous study used the PM2.5 concentration measured from an atmospheric pollution monitoring station closest to the woman's address.8 However, this measurement included a considerably broad area; thus, it cannot be viewed as accurate PM2.5 or PM concentrations at the woman's address. In the present study, we computed PM2.5 concentrations at the mothers' addresses through spatial interpolation by dividing the entire Daegu region into 30 m × 30 m districts, thus substantially increasing the value accuracy. Moreover, previous studies often used disease classification codes when collecting data about congenital anomalies.2122 However, the present study included data on specific types of congenital anomalies for 1,624 infants by having clinicians cross review EMRs and radiologic findings, in addition to disease classification codes. This also enhanced the accuracy of the data. Furthermore, by computing monthly PM2.5 exposure, we were also able to perform a more thorough study compared to past studies that used mean PM2.5 concentrations by trimester or for the entire pregnancy.10
Previous studies have reported that exposure to atmospheric pollutants (PM1, PM2.5, PM10) for the first three years of life increased the incidence of autism spectrum disorders.23 Further, exposure to PM2.5 in the third trimester has been shown to increase the odds ratios (OR) for autism spectrum disorders.24 While only a handful of studies have shed light on the correlation between nervous system malformations and PM2.5, several studies have reported significant effects of PM2.5 concentration on the cognitive-behavioral disorder, Alzheimer's disease, and autism. We hope for more active studies on the relationship between nervous and neurological functions and PM2.5 concentrations.
In this study, the association between congenital cardiovascular anomalies and PM2.5 concentration was not significant. A previous animal study using rat models observed that prenatal PM2.5 exposure alters cardiac cells, thus affecting heart development.25 Besides, exposure to ultrafine particles smaller than 0.1 μm in women at weeks two–eight of gestation increased the OR for ventricular septal defect.12 Exposure to a higher PM2.5 concentration early in pregnancy further increased the OR for cardiovascular anomalies, such as atrial septal defect, endocardial defect, and pulmonary valve stenosis.1226 Our findings that the PM2.5 concentration in month three of pregnancy was higher in the cardiovascular anomaly group, corroborate these results. Thus, further in-depth studies on the relationship between the onset of cardiovascular anomalies and PM2.5 concentrations, as well as other atmospheric pollutants, are crucial.
Although statistically insignificant, the gastrointestinal anomaly group had a higher PM2.5 concentration early in pregnancy. The urogenital anomaly group had a high PM2.5 concentration from month six of pregnancy. Gastrointestinal anomalies encompass anomalies of various organs. Moreover, the sensitive period or substances that induce anomalies are presumed to differ with regard to the development of each organ. A typical cause of gastrointestinal anomalies is maternal smoking during pregnancy. Cigarette smoke is known to induce vasoconstriction and result in small intestine obstruction and gastroschisis.2728 Although we did not include maternal smoking as an anomaly-inducing factor in this study, subsequent studies should examine the relationship between smoking and congenital anomalies. Moreover, considering the high PM2.5 exposure early in pregnancy, the relationship between PM2.5 concentration and specific types of gastrointestinal anomalies should also be examined. The urogenital system is derived from the intermediate mesoderm. The morphologic features of the urological and reproductive systems appear at approximately four and seven weeks, respectively, post-conception. Early prenatal exposure to atmospheric pollutants is known to increase the incidence of congenital hypospadias.1329 Testicular descent is triggered by the gubernaculum with the effect of the testicular hormone, insulin-like 3, between weeks 8 and 15 of pregnancy. The testicles continue to move to the scrotum past the inguinal canal between weeks 25 and 35 of pregnancy.30 This prolonged developmental process of the urogenital system may be significantly at risk according to our results.
Even after adjusting for maternal factors, such as age, DM, and hypertension, that may affect the onset of congenital anomalies, there were significant effects of PM2.5 concentration on the incidence of congenital anomalies. The onset of congenital anomalies is multifactorial, and a substantial part can be attributed to the so-called divinity (an unknown area). However, some factors have been identified in previous studies. PM2.5 is a recently highlighted environmental problem, and this study investigated the effects of this environmental issue on the onset of congenital anomalies. However, we only enrolled mother-infant dyads from tertiary hospitals, where high-risk pregnant women are mostly referred. Therefore, our study is vulnerable to selection bias; thus, it does not represent the entire maternal and infant population. Subsequent studies should expand the scope of their samples, as this would ensure findings representative of the entire maternal or infant population of a region or country. Furthermore, we did not investigate factors such as maternal smoking history, drinking history, comorbidities, marital status, and education level. Subsequent studies should complement the findings of our study by considering the effects of these factors on congenital anomalies.
In conclusion, this study suggests that exposure to high PM2.5 concentration during pregnancy may be associated with the development of congenital anomalies in surgical respects. Moreover, each type of congenital anomaly generally had a high PM2.5 exposure concentration in the first trimester. Overall congenital anomalies and musculoskeletal anomalies were associated with increased PM2.5 concentration in the second trimester of pregnancy. This study discovered some significant clues regarding the effects of PM2.5 on the development of congenital anomalies. The findings of this study can serve as evidence for developing recommendations about PM2.5 exposure for pregnant women. Moreover, the findings will be useful for subsequent studies on the correlation of each type of anomaly or a specific anomaly with PM2.5.
Go to :
 XML Download