

 PDF
PDF Citation
 Print
Print


INTRODUCTION
Elderly hip fracture patients are well recognized owing to the serious socioeconomic burden and have high mortality rates and severe comorbidities.12 Factors related to postoperative mortality after hip fracture have been reported, such as male sex, high American Academy of Anesthesiology grade, older age, residence in an institution, comorbidities such as ischemic heart disease, malignancy and diabetes, and dementia.345
Dementia is one of the major factors that increases hip fracture risk and is one of the major cognitive impairment-related diseases along with delirium and Parkinson's disease.6 Recently, dementia has raised concerns because its incidence is increasing in many countries with aging global population.78910 In 2000, the number of dementia patients worldwide reached 25.5 million and the prevalence of dementia is expected to increase by 14–28% per decade.11 Dementia is not an urgent disease such as angina, pulmonary embolism, and pneumonia, thus, there is not much access to mortality data after hip fracture. In addition, studies on the effect of dementia on mortality after hip fracture have reported different results, and there are no reports on the postoperative mortality according to the severity of dementia.612
The aim of this study was to assess the prevalence of dementia as an underlying disease in elderly patients with hip fractures, to investigate the effect of dementia on postoperative mortality after hip fracture surgery, and to analyze the difference in postoperative mortality according to severity of dementia with or without anti-dementia medication through subgroup analysis.
Go to : 
METHODS
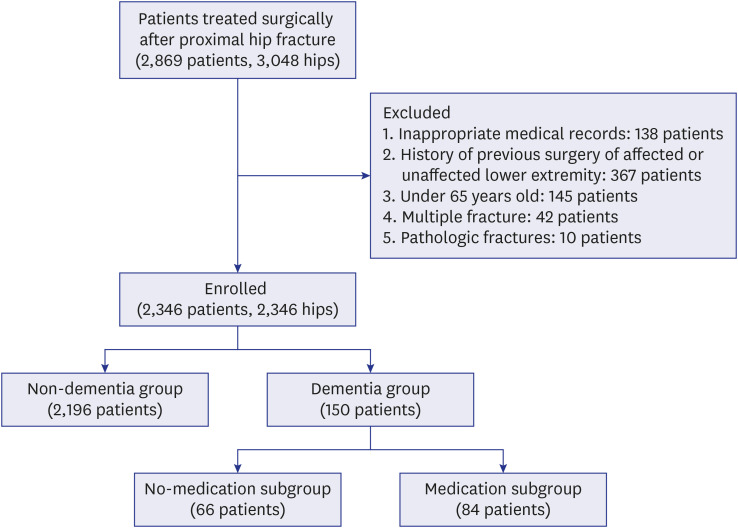
This retrospective study selected 2,869 (3,048 hips) patients who were diagnosed with unilateral intertrochanteric or femoral neck fractures and underwent surgery at one of two hospitals between January 2004 and December 2018. The exclusion criteria were as follows: 1) inappropriate medical records: 138 patients, 2) past surgery history of ipsilateral or contralateral lower extremity: 367 patients, 3) under 65 years old: 145 patients, 4) patients with multiple fractures: 42 patients, and 5) pathologic fractures: 10 patients (Fig. 1). The remaining 2,346 patients (2,346 hips) were classified into the non-dementia group (2,196 patients) and the dementia group (150 patients). The dementia group consisted of patients who were diagnosed by a psychiatrist and were undergoing follow-up. The severity of dementia was classified according to the use of anti-dementia medication.13 In subgroup analysis, 191 patients in the dementia group were classified into no-medication (66 patients) and medication (84 patients) subgroups.
Demographic data, including age, sex, diagnosis (intertrochanteric or femoral neck fracture), right/left, medical comorbidities on the basis of the modified Charlson's comorbidity index (CCI),14 time of surgical delay (from trauma to operation), surgery type (arthroplasty or internal fixation), anesthesia type (spinal or general), presence of intensive care unit (ICU) admission, and 30-day, 60-day, 3-month, 6-month, and 1-year mortality rates, were obtained by radiological findings and reviewing medical records.
Routine follow-up visits were scheduled at 6, 12 weeks, 6, 9, and 12 months; and every year thereafter. Patients who were unable to undergo follow-up evaluations were interviewed via telephone. Clinical information was collected by two nurses and an orthopedic surgeon. Mortality was determined by interviewing patients' families and/or using hospital records. A search for death certificates at the National Statistical Office was performed in patients who were lost to follow-up.
Statistical analysis
The 30-day, 60-day, 3-month, 6-month, and 1-year cumulative crude mortality rates were analyzed and compared between the non-dementia and dementia group.
Age, sex, fracture type, anesthesia type, duration of surgical delay, CCI, presence of ICU admission, presence of dementia, and dementia severity were assessed to determine the relationship with mortality. We used the chi-square test for categorical variables and Student's t-test for numerical variables. Statistical significance was set at P < 0.05. A univariate regression test was performed using age, sex, anesthesia type, medical comorbidities based on the CCI, surgery type, presence of dementia, and dementia severity, as these variables had P values < 0.10. Multivariate regression analysis was performed to identify independent risk factors associated with mortality. Statistical analysis was conducted using IBM SPSS Statistics (version 20.0, IBM, Chicago, IL, USA).
Ethics statement
The design and protocol of this study were approved by the Institutional Review Board (IRB) of Daejeon Eulji Medical Center (EMC-IRB No. 2020-01-005). The requirement of written informed consent was waived owing to the retrospective nature of the study.
Go to :
RESULTS
Of the 2,346 patients with hip fractures, 150 (6.4%) patients were diagnosed with dementia. The 30-day, 60-day, 3-month, 6-month, and 1-year postoperative cumulative mortality rates were 1.8%, 3.8%, 5.6%, 8.9%, and 13.6%, respectively, in the non-dementia group, and 2%, 7.3%, 14%, 19.3%, and 24%, respectively, in the dementia group (Table 1, Fig. 2). The dementia group was older (P = 0.010), had a higher proportion of women (P = 0.034), worse CCI (P < 0.001), and higher prevalence of general anesthesia (P = 0.001).
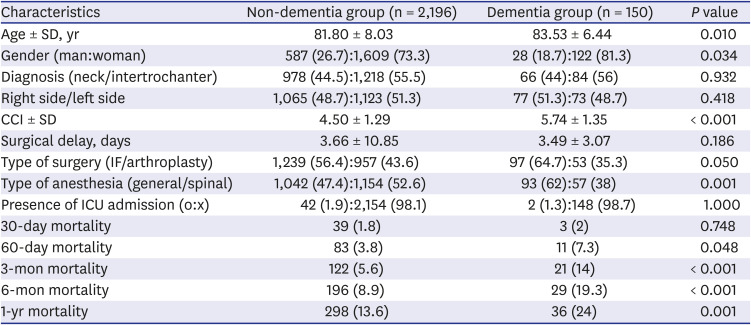
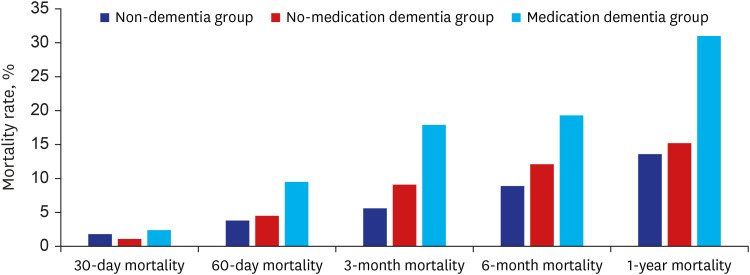
Table 1
Summary of characteristics between non-dementia and dementia groups
Data are presented as mean ± SD or number (%).
SD = standard deviation, CCI = Charlson comorbidity index, IF = internal fixation, ICU = intensive care unit.
![]()
To analyze the risk factors for the 30-day, 60-day, 3-month, 6-month, and 1-year mortality in elderly patients with hip fractures, multivariable logistic regression was performed (Table 2). Age (odds ratio [OR], 1.08; 95% confidence interval [CI], 1.03–1.12; P < 0.001) was identified as a factor that affected the 30-day mortality, and age (OR, 1.07; 95% CI, 1.04–1.10; P < 0.001), sex (OR, 2.64; 95% CI, 1.71–4.07; P < 0.001), CCI (OR, 1.28; 95% CI, 1.10–1.48; P = 0.001), and dementia (OR, 1.68; 95% CI, 1.34–2.35; P < 0.001) were identified as factors that affected the 60-day mortality. The factors that affected the 3-month mortality were age (OR, 1.08; 95% CI, 1.05–1.10; P < 0.001), sex (OR, 2.19; 95% CI, 1.51–3.16; P < 0.001), CCI (OR, 1.25; 95% CI, 1.10–1.42; P = 0.001), and dementia (OR, 1.48; 95% CI, 1.28–1.81; P = 0.006). The factors that affected the 6-month mortality were age (OR, 1.07; 95% CI, 1.05–1.09; P < 0.001), sex (OR, 2.25; 95% CI, 1.66–3.04; P < 0.001), CCI (OR, 1.28; 95% CI, 1.16–1.42; P < 0.001), and dementia (OR, 1.54; 95% CI, 1.34–1.86; P = 0.009). The factors that affected the 1-year mortality were age (OR, 1.06; 95% CI, 1.02–1.08; P < 0.001), sex (OR, 2.68; 95% CI, 2.07–3.47; P < 0.001), CCI (OR, 1.34; 95% CI, 1.23–1.47; P < 0.001), and dementia (OR, 1.70; 95% CI, 1.46–1.08; P = 0.016).
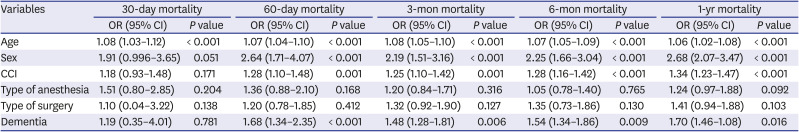
Table 2
Risk factors affecting postoperative mortality in elderly hip fracture patients
![]()
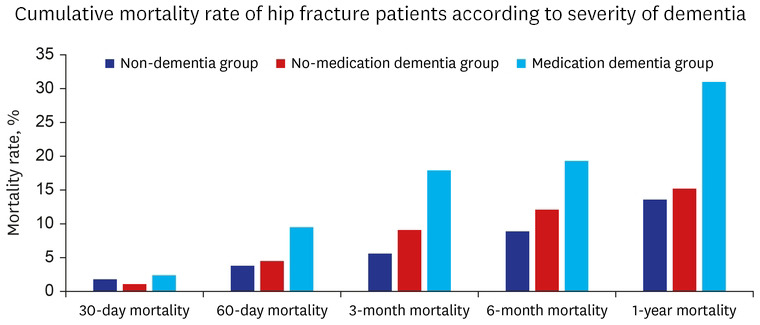
In the subgroup analysis, among the 150 patients with dementia, the 30-day and 60-day, 3-month, 6-month, and 1-year postoperative cumulative mortality rates were 1.1%, 4.5%, 9.1%, 12.1%, and 15.2%, respectively, in the no-medication subgroup (66 patients), and 2.4%, 9.5%, 17.9%, 19.3%, and 31%, respectively, in the medication subgroup (84 patients) (Table 3, Fig. 2).
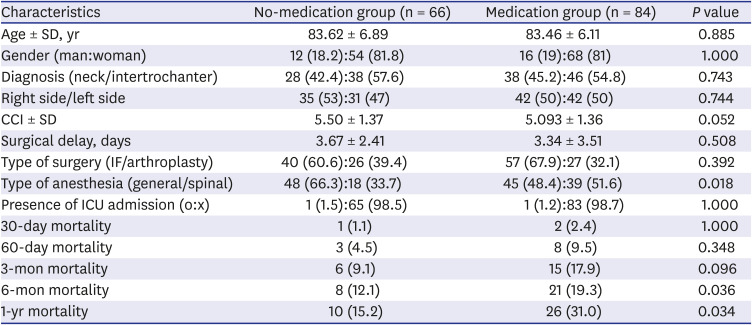
Table 3
Summary of characteristics of dementia patients in the no-medication group and medication group
Data are presented as mean ± SD or number (%).
SD = standard deviation, CCI = Charlson comorbidity index, IF = internal fixation, ICU = intensive care unit.
![]()
To analyze the risk factors for the 30-day mortality in elderly dementia patients after hip fracture, adjusted multivariable analysis was conducted. The severity of dementia influenced the 6-month mortality (OR, 1.41; 95% CI, 1.70–2.01; P = s0.018) and 1-year mortality (OR, 1.30; 95% CI, 1.17–1.90; P = 0.027) (Table 4).
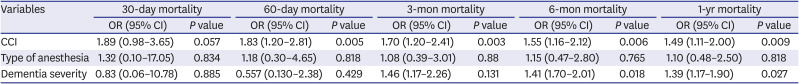
Table 4
Risk factors affecting postoperative mortality in dementia patients with hip fractures
![]()
Go to :
DISCUSSION
Dementia is strongly associated with osteoporosis and osteoporotic fracture.15 In addition, cognitive impairment in dementia patients increases the risk of hip fracture.16 The principal findings of this study are that the prevalence of dementia in elderly patients with hip fractures is 6.39%. The factors that affected the 1-year mortality in elderly patients with hip fracture were age (OR, 1.06; 95% CI, 1.02–1.08; P < 0.001), sex (OR, 2.68; 95% CI, 2.07–3.47; P < 0.001), CCI (OR, 1.34; 95% CI, 1.23–1.47; P < 0.001), and dementia (OR, 1.70; 95% CI, 1.46–1.08; P = 0.016). In the subgroup analysis, the severity of dementia increased the mortality rate within 6 months and 1 year postoperatively.
In a retrospective study of the Taiwan National Health Insurance Research Database, Lai et al.17 investigated the incidence of dementia according to surgery type in geriatric hip fractures and found that the prevalence of dementia was 5.24% in the internal fixation group and 5.29% in the hemiarthroplasty group. Ruggiero et al.18 analyzed the effect of delirium on mortality rates after surgery for a hip fracture and reported that 19.8% of patients had dementia as an underlying preoperative disease. In a retrospective cohort study in the Netherlands, 30% of 566 hip fracture patients over 70 years of age had dementia. In our study, the prevalence of dementia in elderly with hip fractures was 6.39%. The difference in prevalence of dementia in elderly hip fractures might be related to differences in demographic characteristics including age, sex proportion, comordibidy, and race.19
Most studies have consistently reported that dementia increases both long-term mortality and short-term mortality. In the study conducted by Lai et al.17, 8080 patients with dementia and 145,543 patients without dementia were enrolled. Dementia increased the 1-year (OR, 1.06; 95% CI, 1.00–1.13) and 2-year (OR, 1.10; 95% CI, 1.05–1.16) postoperative mortality risks in elderly patients with hip fractures. Bai et al.6 analyzed the postoperative mortality of dementia patients after a hip fracture in a meta-analysis of 18 cohort studies and reported that dementia increased the risk of mortality after hip fracture compared with that in non-dementia patients by 1.57, 1.97, and 1.77 times with respect to the 30-day, 6-month, and 1-year, mortality, respectively. In this study, the 60-day, 3-month, 6-month, and 1-year postoperative cumulative mortality rates in the dementia group were significantly higher than those in the non-dementia group. However, there was no difference in the 30-day mortality between the two groups. This might be related to dementia having a protective effect on in hospital mortality.17
In this study, the factors strongly related to the long-term mortality rate of dementia patients compared with non-dementia patients were age, sex, CCI and dementia. In particular, CCI was also associated with early mortality within 60 and 90 days postoperatively. We believed that pulmonary and cardiac comorbidities were the main factors contributing to the high mortality rate in the early postoperative period. Fansa et al.20 and Mitchell et al.21 reported that the main cause of this result was pulmonary and cardiac comorbidities. Delgado et al.22 investigated the influence of cognitive impairment on mortality of patients over 65 years with hip fractures and reported that dementia is a risk factor for pulmonary infections, urinary tract infection and sepsis. Barceló et al.23 assessed the causes of death in patients who died up to 2 years after hip fracture and found that circulatory system diseases and pneumonia were the most common causes of death. They also reported that decompression of chronic illness caused by hip fractures and the hip fracture itself were associated with death.
Our study had several limitations. First, the severity of dementia was only assessed by history of anti-dementia medication and this study did not consider the type of medication for dementia. Second, this retrospective study might have selection bias. However, we tried to minimize this bias in patient selection by using data from an electronic medical record and calculating the mortality rate based on a search for death certificates at the National Statistical Office. Third, the causes for death after hip fracture, such as medical comorbidities, were not considered. Thus, we used the CCI to minimize the effect of bias due to different medical comorbidities.
In elderly hip fracture patients, the comparison between patients with and without dementia showed that dementia was an independent risk factor of mortality at a minimum of 1-year of follow-up, and the severity of dementia in hip fracture patients was a risk factor for mortality within postoperative 6 months and 1 year postoperatively.
Go to :
 XML Download