Journal List > Nutr Res Pract > v.15(5) > 1147490

Razalli, Cheah, Mohammad, and Abdul Manaf: Plate waste study among hospitalised patients receiving texture-modified diet

Abstract

BACKGROUND/OBJECTIVES

While plate waste has been widely investigated in hospitals, there have been minimal studies specific to the texture-modified diet (TMD). This study aims to determine the percentage of plate waste among patients prescribed with TMD and its contributory factors.

SUBJECTS/METHODS

This was a single-centre study conducted in the university hospital on three types of TMD (blended diet, mixed porridge, minced diet) during lunch and dinner meals. Weighing method and visual estimation method assisted by digital photograph were adopted in this study. Face to face interview was carried out to investigate on 1) the food/food service quality factors in terms of patients' satisfaction level towards sensorial quality of food and food services provided and 2) the clinical/external factors including appetite, the provision of oral nutrition support, time taking the diet, the need for feeding assistance and the length of hospital stay.

RESULTS

The mean percentage of overall plate waste of 95 patients receiving TMD was high (47.5%). Blended diet was identified as the most wasted diet (65%) followed by minced diet (56%) and mixed porridge (35%). Satisfaction level among patients was moderate. Patients on TMD in general had higher satisfaction level on the aspect of food service as compared to food quality. Substantial association between sensorial qualities of food and plate waste were varied according to individual TMD type. A multiple linear regression showed that only the satisfaction level toward the aspects of appearance and variety of foods were the predictors of TMD plate waste (R2 = 0.254, P < 0.05).

CONCLUSIONS

A significant relationship between the percentage of plate waste and the overall satisfaction level of patients receiving TMD suggests that vigorous strategies are needed to reduce the food waste of TMD which will lead to a better nutritional status and clinical outcomes among the patients.

INTRODUCTION

One of the world's food system challenges concerns food waste. Globally, it is estimated that approximately one-third of food produced is wasted or lost each year. This equals to almost 1.3 billion tons of food wasted yearly, from food production to food consumption [1]. Food waste originate from different sources including household, food service facilities and commercial activities such as organising events, conferences, seminars and others. Of all the sources, food service is well recognised as a large generator of food waste and hospital food service provision is one of the contributors of this waste.
Among the total waste produced in hospitals, almost 50% from them are waste from food [2]. Food waste from hospital food service can be divided into kitchen waste and plate waste and mostly research on food waste in hospitals are primarily based on individual plate waste mainly because of its direct influence on patient nutritional outcomes. Plate waste as in the hospital setting refers to the remaining served food which are left and not eaten by patients [3456]. A recent review of the global hospital food waste conducted in 2018 concluded that, hospital plate waste were measured from 6% to 65%, but more commonly between 15% and 35% with a median individual plate waste of 31% [7]. In Southeast Asia, around 33% of food is wasted in the region [8]. It was also estimated that plate waste in hospital can add up to 30% from food costs [9].
Every food service organisation aims to prepare, distribute and serve safe food. Safe food is determined by its nutritional quality, balance, palatability and temperature [10]. Therefore, all hospital food services must have a good management system in optimising patients' food and nutrient intake, increase patients' satisfaction towards food service and to achieve better quality outcomes, reduction in cost and revenue generation. Plate waste assessment is important to be conducted as an indicator of food service operation efficiency [11] as well as signifying nutritional adequacy among hospitalised patients [612]. It is widely accepted that the food/food service quality is the main contributing factor to hospital plate waste. Numerous published studies have established the relationship between patient satisfaction on the sensory quality of food in terms of appearance, taste, texture, temperature as the major factor affecting the rate of hospital plate waste [131415]. Besides food quality, patients' satisfaction towards the quality of food service was also linked to hospital plate waste. Other clinical/external factors such as patients' appetite, the provision of oral nutrition support (ONS), time taking the diet, the need for a feeding assistance and the length of hospital stay have also been reported to influence the level of plate waste in hospitals [16171819].
Texture-modified diet (TMD) is referred to foods with soft texture, where foods have been modified to appropriate texture and consistency which can be more easily chewed and managed by patients who are being prescribed with this diet. Food texture can be altered through physical or chemical modification [202122]. The modified texture food in general should be soft, moist, elastic, smooth, and easy to swallow [23]. Up to 80% of patients taking this type of diet are those with dysphagia especially among the elderly people [24]. Appropriate modification of food texture is important to minimise the incidence of aspiration pneumonia and to increase patients' food intake, subsequently leading to a better nutritional status [25]. Other indications requiring the prescription of TMD include dentition problem, pre/post-surgery requirement, the need for a feeding assistance, cognitive issues and refusal to eat [24262728].
Various terminologies and labels are applied on food textures around the world in the provision of TMD [2229]. Recently in 2016, the International Dysphagia Diet Standardization Initiative (IDDSI) produced framework as a global initiative to implement the use of a standardised textures terminology worldwide [30]. According to IDDSI, modifications in food texture are classified into level 4 to level 7; level 4—pureed, requiring no chewing at all; level 5—minced and moist, requiring minimal chewing; level 6—soft and bite‐sized, requiring chewing; and level 7—regular foods, with various textures. However, many countries and even individual healthcare facilities or hospitals have already developed their own standard for diet texture modification and they are still used in the preparation of TMD [29].
While studies on hospital plate waste and patients' satisfaction have been conducted extensively at the global scale on regular diet, studies focusing particularly on TMD are still lacking. Several studies conducted on hospitalised patients and long-term care facility residents receiving TMD previously were focusing mainly on the nutritional value of TMD consumed by studied participants [31323334]. Literature review search on the percentage of TMD plate waste specifically is almost non-existence unlike plate waste studies on regular texture diet. In addition, studies on the contributing factors to TMD plate waste were scarce. Therefore, the aim of this study is to determine the rate of TMD plate waste and the factors affecting it in a Malaysian urban university hospital.

SUBJECTS AND METHODS

Study design

A cross-sectional study was conducted among 95 patients aged 18 years old and above who received TMD in the medical ward in the university hospital. Ethical approval was obtained from the Research Ethics Committee, Universiti Kebangsaan Malaysia (UKMPPI/111/8/JEP-2019-051). Information sheets of the study were distributed, and the signed consent were obtained from all the subjects prior to this study. Data collection for this study was carried out from 14th March 2019 to 4th May 2019.

Sampling and subjects

There are three types of TMD offered by the hospital's kitchen; minced diet, mixed porridge and blended diet which were included in this study involving lunch and dinner meals. The following is a brief description of each diet type involved in this study based on the hospital diet manual developed by the Ministry of Health Malaysia [28].
  • -Blended/ blenderised diet: balanced diet consists of rice/rice porridge, cooked vegetables and protein sources are soft and not spicy, and blended. Vegetables without skin and seeds are used. Strained fruit juice is suitable for this diet.

  • -Minced diet: consists of rice porridge, protein dish and vegetables are cooked until soft and not spicy. Proteins and vegetables are chopped separately. Fish or chicken should be boneless and finely chopped or minced. Soft fruits are served. This diet is also served with soup/gravy.

  • -Mixed porridge diet: mixed porridge is a rice porridge cooked with protein source and vegetables, added with small amount of oil and not spicy. Boneless protein sources such as fish, chicken and vegetables need to be thinly sliced and cooked until soft and moist.

Subjects were selected using a convenience sampling from the Department of Dietetics and Food Services by using the hospital's in-house patient information system known as the Caring Hospital Enterprise System. The inclusion criteria were adult patients aged 18 years old and above who receive TMD orally, either normal (non-nutrient restricted) or therapeutic (nutrient restricted) TMD such as diabetic diet, low sodium diet, low fat diet or the combination, and able to communicate in English or Bahasa Malaysia. Exclusion criteria included those who were on tube or parenteral feeding, have mental problems or disorders and diagnosed with dementia.

Data collection

A structured questionnaire was distributed to the subjects to obtain required information for this study following obtaining a signed consent. The questionnaire consisted of five sections which are the sociodemographic information of the respondents, anthropometry, food intake, clinical information and quality of the food services.
Data collection about the sociodemographic information was conducted through interviews and by perusing subjects' medical record. Nutritional status was assessed using anthropometry measurement including height, weight, mid upper arm circumference, calf circumference, and knee height.
For bedridden subjects, the formula by Shahar et al. [35] was used to estimate the height and equations by Ross Laboratories [36] were used to calculate weight. Next, body mass index (BMI) was calculated using the formula weight (kg)/height (m2) and the subjects were classified according to BMI category based on the classification by the World Health Organization 2013. For the clinical part, information on signs and symptoms of the disease, appetite, consumption of ONS and whether subjects were taking outside food were collected from the subjects.
Two methods were employed to assess the amount of plate waste; weighing [8] and visual estimation. For weighing method, a digital food weighing scale (Tanita KD 160WH) with weight capacity of 2 kg and weight graduation of 1 g was used. A standard weight of TMD on tray was initially measured and recorded. The remaining weight of the TMD was measured again and compared with the standard weight to obtain the percentage of plate waste. Weighing method involved collecting all food waste from each patient and separating them into four food components for minced diet; starch, protein, vegetables and fruit/dessert; and three components for mixed porridge; starch, protein and fruit/dessert, before weighing them accordingly. Small pieces of vegetables become too soft and mushy in the mixed porridge hence food separation for this type of TMD was limited to only three components. The separation of food components was not carried out for blended diet due to infeasibility. The following formula was used to determine the rate of plate waste;
Rateofplatewaste(%)=Amountofwaste(g)Standardweight(g)×100%nrp-15-655-e001.jpg
The Visual Comstock Scale, a visual estimation of the waste expressed on a 6-point scale developed by Comstock et al. [3] was used to approximately measure the proportion of food left. Food waste is separated into different food components similar to the weighing method and were observed and recorded in different values ranging from 0%, 25%, 50%, 75%, 90%, 100% (all consumed to none consumed). Digital photography was also used to record the food waste, which can minimise errors and allow precise estimates of portion sizes at a later time.
The contributing factors to plate waste such as patients' satisfaction towards the food quality and food service (food/food service quality factors), together with clinical/external factors such as appetite, the need for assistance during feeding, the duration of taking the diet, intake of ONS were investigated in this study based on the factors previously reported to be associated with plate waste by previous studies [13141516171819].
The level of patient satisfaction was measured using the service quality (SERVQUAL) questionnaire that was adapted and validated by Joung et al. [37]. This study used the Bahasa Malaysia version that has been previously translated and validated [38]. It consists of two parts; part A is the satisfaction of patients on the quality of food provided and part B concerns patients' satisfaction on the quality of food services. The satisfaction level is divided into two main domains which are food quality and food services. There are nine items under the domain of food quality (appearance, taste, texture, vegetables, chicken/meat/fish, temperature, variety of foods, portion size, variety of choices of menu) whereas there are main items under the domain of food service (attire, smiling, manner, punctuality, helpfulness) whereby the two items of punctuality and helpfulness were used to determine responsiveness, one of the subdomain under the domain of food service. The scoring criteria used in this questionnaire was a 5-point scale (1-very dissatisfied, 2-dissatisfied, 3-moderate, 4-satisfied, 5-very satisfied).

Statistical analysis

Data were analysed using IBM SPSS Statistics version 23.0 at a significant level of 0.05. Descriptive analysis was used to determine the socio-demography, anthropometry profile of subjects, percentage of plate waste for three type of TMD on lunch and dinner by using weighing method and visual estimation method, as well as the satisfaction scores according to different criteria of satisfaction domains. Mean and standard deviations were computed for type of TMD and satisfaction scores. To assess the level of agreement between the two methods in estimating plate waste, the Bland-Altman plot analysis was conducted. Additionally, data collected were also subjected to the non-parametric Spearman's correlation. Spearman's correlation was also used to determine the relationship between percentage of total plate waste and factors affecting it since the data were not normally distributed. Furthermore, this test was also applied to determine the relationship between total percentage of plate waste and satisfaction levels of patients taking TMD. Multiple linear regression analysis was employed to measure the association between the total percentage of plate waste and continuous contributing factors that have significant correlation with plate waste.

RESULTS

Socio-demographic and anthropometry profile of subjects

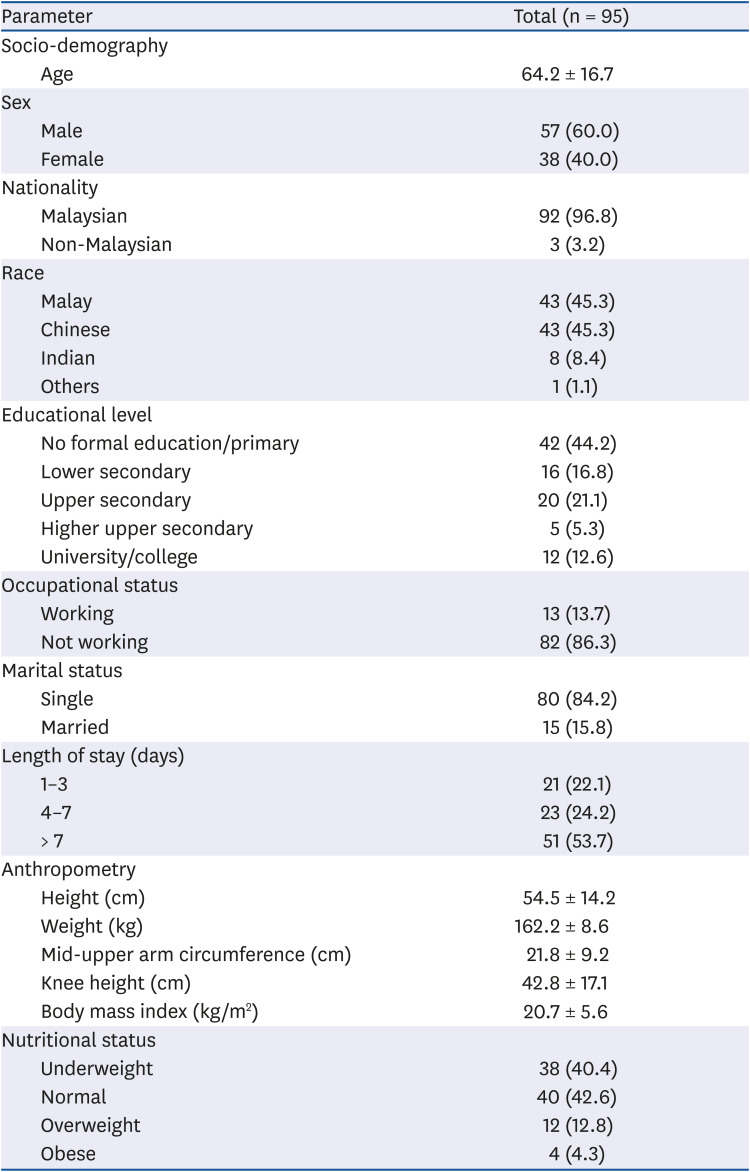
Out of 106 patients consuming TMD screened, only 95 patients were recruited. 11 subjects were excluded because of their clinical conditions such as having infectious disease or cognitive problems, being unconscious and nil by mouth which did not fulfil the inclusion criteria. The socio-demography profile of patients is shown in Table 1. The mean age for 95 patients was 64.2 years old with more males (60%) compared to females (40%) that were involved in this study. For the length of stay, more than half of the patients have stayed more than 7 days (53.7%). For anthropometry data, the mean BMI for patients was 20.7 kg/m2 which fell under the category of normal. Assessment of patients' nutritional status based on BMI revealed that 42.6% of subjects were classified as having normal weight followed by being underweight (40.4%), overweight (12.8%) and obese (4.3%). From the total of 95 patients involved in this study, 66 (69.5%) patients were on normal (non-nutrient restricted) TMD while the remaining 29 (30.5%) patients received therapeutic (nutrient restricted) TMD.
Table 1

Socio-demographic and anthropometry profile of subjects

nrp-15-655-i001
Parameter Total (n = 95)
Socio-demography
Age 64.2 ± 16.7
Sex
Male 57 (60.0)
Female 38 (40.0)
Nationality
Malaysian 92 (96.8)
Non-Malaysian 3 (3.2)
Race
Malay 43 (45.3)
Chinese 43 (45.3)
Indian 8 (8.4)
Others 1 (1.1)
Educational level
No formal education/primary 42 (44.2)
Lower secondary 16 (16.8)
Upper secondary 20 (21.1)
Higher upper secondary 5 (5.3)
University/college 12 (12.6)
Occupational status
Working 13 (13.7)
Not working 82 (86.3)
Marital status
Single 80 (84.2)
Married 15 (15.8)
Length of stay (days)
1–3 21 (22.1)
4–7 23 (24.2)
> 7 51 (53.7)
Anthropometry
Height (cm) 54.5 ± 14.2
Weight (kg) 162.2 ± 8.6
Mid-upper arm circumference (cm) 21.8 ± 9.2
Knee height (cm) 42.8 ± 17.1
Body mass index (kg/m2) 20.7 ± 5.6
Nutritional status
Underweight 38 (40.4)
Normal 40 (42.6)
Overweight 12 (12.8)
Obese 4 (4.3)
Data are shown as mean ± SD or number (%).

Percentage of plate waste contributed by TMD

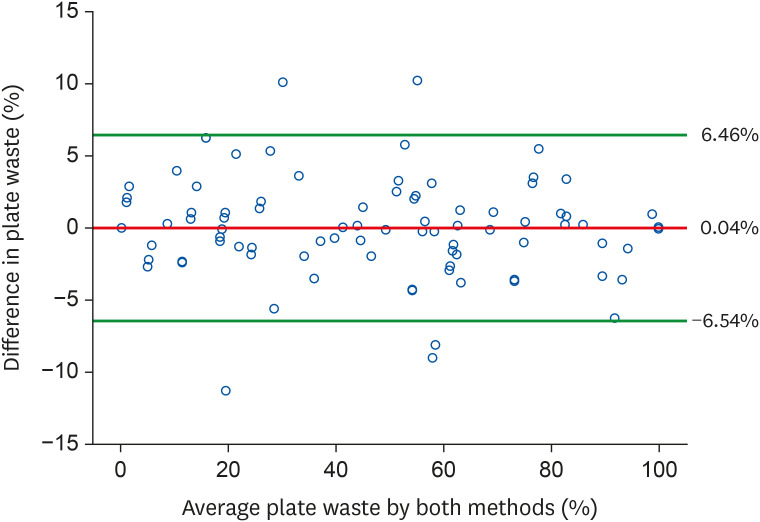
According to Table 2, overall, the mean plate waste for TMD as assessed by using weighing method was 47.5%, with wastage occurring mostly during lunch time (49.2%) compared to dinner time (45.9%). Minced diet, mixed porridge and blended diet during lunch time were wasted at 57.9%, 36.3%, and 68.8% respectively whilst the mean plate waste for dinner time were 55.5%, 33.9%, and 63.3% respectively. Similar trend was observed using Comstock visual estimation method. Using this method, the plate waste for lunch was 49.4% which was also higher than the 45.7% plate waste for dinner. Based on the Bland-Altman plot analysis, there was no proportional bias between the total percentage of plate waste measured using weighing method and visual estimation method (P = 0.418, P > 0.05). The mean difference was 0.04% with the limits of agreement range from −6.54% to 6.46% (Fig. 1). In addition, strong, positive correlation between the plate waste data from both methods was obtained from the Spearman's correlation test (r = 0.992, P < 0.001).
Table 2

Percentage of plate waste for three type of texture-modified diet at lunch and dinner by using weighing method and visual estimation method

nrp-15-655-i002
Methods Weighing method Visual estimation method
Lunch (n = 95) Dinner (n = 95) Lunch (n = 95) Dinner (n = 95)
Type of diet
Minced diet 57.9 ± 27.6 55.5 ± 33.5 58.1 ± 28.1 55.9 ± 33.4
Mixed porridge 36.3 ± 36.6 33.9 ± 34.4 36.3 ± 36.3 34.2 ± 35.0
Blended diet 68.8 ± 33.3 63.3 ± 35.3 69.6 ± 33.4 61.9 ± 36.6
Total 49.2 ± 37.0 45.9 ± 36.7 49.4 ± 37.1 45.7 ± 37.1
Overall 47.5 ± 31.3 47.6 ± 31.6
Data are shown as mean ± SD.
Fig. 1

Bland-Altman plot of the comparison between average plate waste and difference in plate waste data, comparing weighing measurement and visual estimation based on individual plate waste.

nrp-15-655-g001
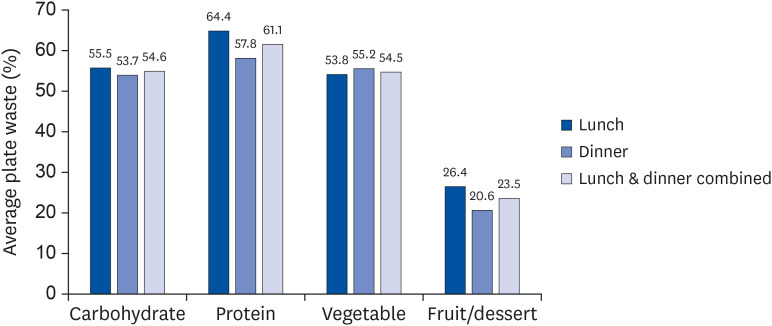
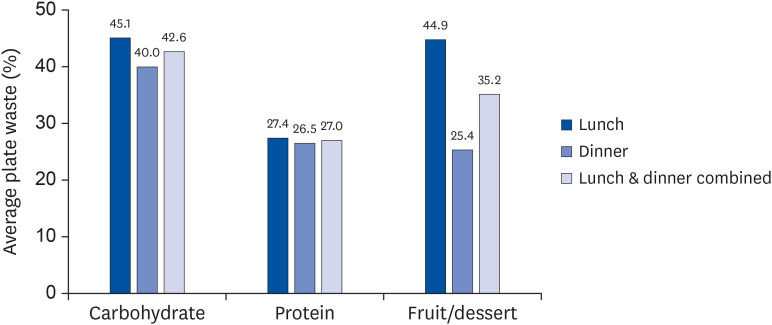
The mean amount of TMD plate waste by food components were also investigated for minced diet and mixed porridge. For minced diet (Fig. 2), plate waste was highest for protein (61.1% combined for lunch and dinner, 64.4% and 57.8% for lunch and dinner respectively) and lowest for fruit/dessert (23.5% combined for lunch and dinner, 26.4% and 20.6% for lunch and dinner respectively). Carbohydrate and vegetable had quite similar amount of average waste at 54.6% and 54.5% respectively, combined for lunch and dinner meals. In contrast, for mixed porridge (Fig. 3), carbohydrate was the highest food component wasted (42.6% combined for lunch and dinner, 45.1% and 40.0% for lunch and dinner respectively) followed by fruit/dessert at 35.2% of average waste combined for lunch and dinner meals. It was noted that fruit was wasted 1.8 times higher at lunch (44.9%) compared to dinner (25.4%). Protein was wasted lowest for mixed porridge (27.0% combined for lunch and dinner, 27.4% and 26.5% for lunch and dinner respectively).
Fig. 2

Average plate waste of minced diet according to food groups based on weighing method.

nrp-15-655-g002
Fig. 3

Average plate waste of mixed porridge according to food groups based on weighing method.

nrp-15-655-g003

Levels of patients' satisfaction with food quality and food service

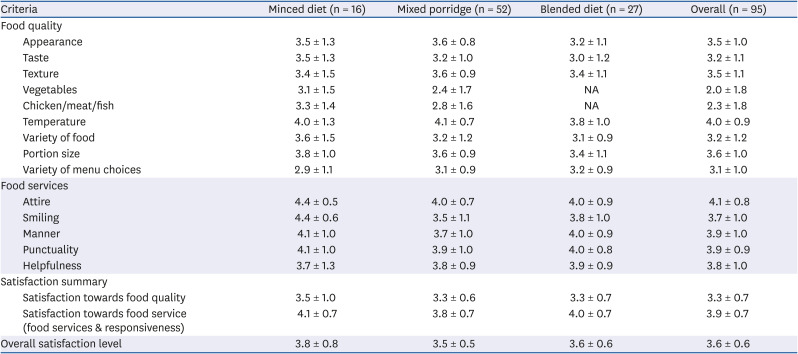
With respect to satisfaction level (Table 3), the mean overall satisfaction score from two main domains (food quality and food service) was 3.6 ± 0.6 (moderate satisfaction). Patients on TMD on the whole had higher satisfaction level (3.9 ± 0.7) in the aspect of food service as compared to food quality (3.3 ± 0.7). The highest mean satisfaction score of food quality was towards the aspect of temperature (4.0 ± 0.9), rated by patients as satisfied followed by portion size (3.6 ± 1.0). The highest satisfaction score for food services was attire (4.1 ± 0.8) followed by manner of caterers (3.9 ± 1.0) and punctuality (3.9 ± 0.9).
Table 3

Satisfaction scores according to different criteria of satisfaction domains

nrp-15-655-i003
Criteria Minced diet (n = 16) Mixed porridge (n = 52) Blended diet (n = 27) Overall (n = 95)
Food quality
Appearance 3.5 ± 1.3 3.6 ± 0.8 3.2 ± 1.1 3.5 ± 1.0
Taste 3.5 ± 1.3 3.2 ± 1.0 3.0 ± 1.2 3.2 ± 1.1
Texture 3.4 ± 1.5 3.6 ± 0.9 3.4 ± 1.1 3.5 ± 1.1
Vegetables 3.1 ± 1.5 2.4 ± 1.7 NA 2.0 ± 1.8
Chicken/meat/fish 3.3 ± 1.4 2.8 ± 1.6 NA 2.3 ± 1.8
Temperature 4.0 ± 1.3 4.1 ± 0.7 3.8 ± 1.0 4.0 ± 0.9
Variety of food 3.6 ± 1.5 3.2 ± 1.2 3.1 ± 0.9 3.2 ± 1.2
Portion size 3.8 ± 1.0 3.6 ± 0.9 3.4 ± 1.1 3.6 ± 1.0
Variety of menu choices 2.9 ± 1.1 3.1 ± 0.9 3.2 ± 0.9 3.1 ± 1.0
Food services
Attire 4.4 ± 0.5 4.0 ± 0.7 4.0 ± 0.9 4.1 ± 0.8
Smiling 4.4 ± 0.6 3.5 ± 1.1 3.8 ± 1.0 3.7 ± 1.0
Manner 4.1 ± 1.0 3.7 ± 1.0 4.0 ± 0.9 3.9 ± 1.0
Punctuality 4.1 ± 1.0 3.9 ± 1.0 4.0 ± 0.8 3.9 ± 0.9
Helpfulness 3.7 ± 1.3 3.8 ± 0.9 3.9 ± 0.9 3.8 ± 1.0
Satisfaction summary
Satisfaction towards food quality 3.5 ± 1.0 3.3 ± 0.6 3.3 ± 0.7 3.3 ± 0.7
Satisfaction towards food service (food services & responsiveness) 4.1 ± 0.7 3.8 ± 0.7 4.0 ± 0.7 3.9 ± 0.7
Overall satisfaction level 3.8 ± 0.8 3.5 ± 0.5 3.6 ± 0.6 3.6 ± 0.6
Data are shown as mean ± SD.
NA, not applicable.
Satisfaction scores were also analysed according to diet types. All three TMD diets studied; minced diet, mixed porridge and blended diet had a higher mean score on the aspect of food service (4.1 ± 0.7, 3.8 ± 0.7, and 4.0 ± 0.7) compared to food quality. Patients receiving minced diet, mixed porridge and blended diet all rated the quality of food as moderate. Among the three diets, minced diet had the highest mean score of 3.5 ± 1.0 while mixed porridge and blended diet each had a similar mean score of 3.3 ± 0.6. For all three diet types, the aspect of food temperature had the highest score (4.0 ± 1.3, 4.1 ± 0.7, and 3.8 ± 1.0). However, the aspect of food quality that received the lowest score varied among the three TMD studied. Minced diet had the lowest score for the variety of menu choices (2.9 ± 1.1), vegetables for mixed porridge (2.4 ± 1.7) and the variety of food for blended diet (3.1 ± 0.9).

Correlation between the overall plate waste of TMD and the contributing factors

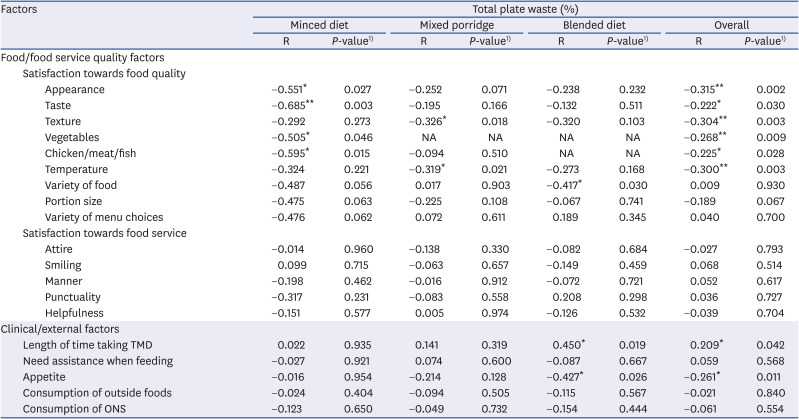
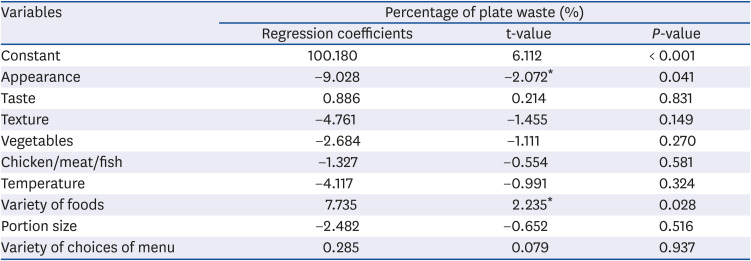
Table 4 shows the correlation between the contributing factors and the total plate waste for patients receiving TMD. Spearman's rho indicated the presence of a moderate negative correlation between food appearance (r = −0.551, P < 0.05), food taste (r= −0.685, P < 0.01), vegetables (r = −0.505, P < 0.05) and chicken/meat/fish (r= −0.595, P < 0.05) with plate waste for minced diet. For mixed porridge, there was a weak negative correlation between food texture (r = −0.326, P < 0.05) and temperature (r = −0.319, P < 0.05) with plate waste. However, for blended diet, a moderate positive correlation was found between the length of time taking the diet (r = 0.450, P < 0.05) and plate waste while there was a moderate negative correlation between appetite (r = −0.427, P < 0.05) and food variety (r = −0.417, P < 0.05) with plate waste. Combining all the three diets together, the percentage of TMD plate waste had a weak correlation with factors such as the length of time taking TMD in a positive manner (r = 0.209, P < 0.05) and appetite (r = −0.261, P < 0.05), in a negative manner. TMD plate waste altogether also had a negative correlation only with domain of food quality including appearance of food provided (r = −0.315, P < 0.01), taste (r = −0.222, P < 0.05), texture (r = −0.304, P < 0.01), vegetables (r = −0.268, P < 0.01), chicken/meat/fish (r = −0.225, P < 0.05), and temperature (r = −0.300, P < 0.01). In addition, there was no significant correlation between individual plate waste with length of stay (P = 0.096) and nutritional status based on BMI (P = 0.089). Multiple Linear Regression analysis found that only food appearance and food variety were independently associated with the percentage of total plate waste (R2 = 0.254, P < 0.05) as shown in Table 5.
Table 4

Correlation analysis of total texture-modified diet plate waste and the contributing factors

nrp-15-655-i004
Factors Total plate waste (%)
Minced diet Mixed porridge Blended diet Overall
R P-value1) R P-value1) R P-value1) R P-value1)
Food/food service quality factors
Satisfaction towards food quality
Appearance −0.551* 0.027 −0.252 0.071 −0.238 0.232 −0.315** 0.002
Taste −0.685** 0.003 −0.195 0.166 −0.132 0.511 −0.222* 0.030
Texture −0.292 0.273 −0.326* 0.018 −0.320 0.103 −0.304** 0.003
Vegetables −0.505* 0.046 NA NA NA NA −0.268** 0.009
Chicken/meat/fish −0.595* 0.015 −0.094 0.510 NA NA −0.225* 0.028
Temperature −0.324 0.221 −0.319* 0.021 −0.273 0.168 −0.300** 0.003
Variety of food −0.487 0.056 0.017 0.903 −0.417* 0.030 0.009 0.930
Portion size −0.475 0.063 −0.225 0.108 −0.067 0.741 −0.189 0.067
Variety of menu choices −0.476 0.062 0.072 0.611 0.189 0.345 0.040 0.700
Satisfaction towards food service
Attire −0.014 0.960 −0.138 0.330 −0.082 0.684 −0.027 0.793
Smiling 0.099 0.715 −0.063 0.657 −0.149 0.459 0.068 0.514
Manner −0.198 0.462 −0.016 0.912 −0.072 0.721 0.052 0.617
Punctuality −0.317 0.231 −0.083 0.558 0.208 0.298 0.036 0.727
Helpfulness −0.151 0.577 0.005 0.974 −0.126 0.532 −0.039 0.704
Clinical/external factors
Length of time taking TMD 0.022 0.935 0.141 0.319 0.450* 0.019 0.209* 0.042
Need assistance when feeding −0.027 0.921 0.074 0.600 −0.087 0.667 0.059 0.568
Appetite −0.016 0.954 −0.214 0.128 −0.427* 0.026 −0.261* 0.011
Consumption of outside foods −0.024 0.404 −0.094 0.505 −0.115 0.567 −0.021 0.840
Consumption of ONS −0.123 0.650 −0.049 0.732 −0.154 0.444 −0.061 0.554
TMD, texture-modified diet; ONS, oral nutrition support; NA, not applicable.
1)Analysed using Spearman Correlation test.
*Significant at P < 0.05, **Significant at P < 0.01.
Table 5

Multiple linear regression analysis of texture-modified diet plate waste and the continuous variables that were significantly correlated with the total plate waste

nrp-15-655-i005
Variables Percentage of plate waste (%)
Regression coefficients t-value P-value
Constant 100.180 6.112 < 0.001
Appearance −9.028 −2.072* 0.041
Taste 0.886 0.214 0.831
Texture −4.761 −1.455 0.149
Vegetables −2.684 −1.111 0.270
Chicken/meat/fish −1.327 −0.554 0.581
Temperature −4.117 −0.991 0.324
Variety of foods 7.735 2.235* 0.028
Portion size −2.482 −0.652 0.516
Variety of choices of menu 0.285 0.079 0.937
Statistical model R2 = 0.254.
*Significant at P < 0.05.

DISCUSSION

Little is known about the rate of TMD plate waste in hospital setting. Thus, this study aimed to determine the percentage of TMD plate waste and its associating factors on three types of TMD offered by the studied hospital's kitchen; minced diet, mixed porridge and blended diet involving mostly elderly patients. Plate waste was measured by weighing method and visual estimation assisted by digital photographs. In this study, a strong correlation and high agreement were found between the two methods suggesting that both methods are comparable in determining plate waste. While some studies had a similar observation [39], few other studies found that visual estimation tends to overestimate or underestimate plate waste compared to using the weighing method [4041]. A systematic review by Anasako and Akamatsu [42] concluded that the visual estimation method is appropriate to be used provided that the portion sizes of meal served are uniform within individual facilities.
Overall, the average total plate waste of TMD involving lunch and dinner meals in this study was 47.5%. This rate of plate waste is considered high since according to Edwards and Nash [43], plate waste of more than 30% in the hospital setting is categorised as high. The rate of TMD plate waste found from this study (47.5%) is much higher when compared to the median plate waste rate (31%) in hospitals globally [7]. Comparing with other plate waste studies on regular diet, the total plate waste for TMD in the present study was higher than the overall plate waste yield across wards for regular diet (35%) in Portugese [44] and also among surgery and rehabilitation patients receiving regular diet in the United Kingdom (6%–42%) [16]. This was also much higher than the reported average plate waste in the Southeast Asia region (33%). Despite that, comparison made between several local studies in Malaysian was varied. A hospital plate waste study carried out by Zakiah et al. [9] among patients on regular diet obtained a comparable rate with overall mean plate waste of 42.6% while a more recent study involving several public hospitals in East Malaysia by Aminuddin et al. [45] reported a slightly lower average plate waste of 36%. However, percentage comparison between the results obtained from this study and other TMD studies could not be made since published works on the rate of TMD plate waste are rare if not none. Studies on TMD plate waste were more commonly reported as nutritional values determining the average calorie (in kcal) and protein intake (in gram) by the subjects [31323334]. To the best of the author's knowledge, this study is the first published work on the percentage of TMD plate waste among hospitalised adult patients.
It was also found that percentage of TMD plate waste was higher during lunch compared to dinner. This could be due to patients still feeling full following a breakfast meal. Several studies had reported less plate waste during breakfast compared to other main meals [612] but this assumption could not be generalised in this study since breakfast meal was not studied. Additionally, percentage of plate waste based on different types of TMD was also explored. Among the three TMD studied, blended diet was found to have the highest plate waste (65%) followed by minced diet (56%) while mixed porridge had the lowest plate waste (35%). It is very worrying to observe that blended diet had a very high plate waste, more than twice as high as the median hospital plate waste reported worldwide [7]. This implies that blended diet or also called as pureed diet elsewhere warrant the most attention with special strategies among other types of TMD served in hospital followed by minced diet. While earlier studies comparing the plate waste or intake between inpatients receiving blended diet and minced diet is rarely available, a study by Nowson et al. [46] in residential care establishments in Australia also reported a lower intake of calorie and protein among residents on blended diet compared to those on minced diet. Among the three TMD studied, mixed porridge had the least plate waste which suggest that it is mainly attributable to mixed porridge being a familiar food with original texture. A one dish-meal of a thick rice porridge cooked with fish/meat and vegetables is a common dish consumed in many Asian countries [47] including Malaysia. Although it fits under the modified texture diet category because of its soft texture in nature, many patients would generally consume this type of diet more as the texture is original for them as opposed to minced diet and blended diet in which alteration in food consistency is more obvious.
Plate waste measurement by food components was also conducted for minced diet and mixed porridge. Protein was wasted the highest for minced diet and this was in agreement with the observation in an earlier local study by Shahar et al. [48] among elderly inpatients at the same hospital which found that protein dish was wasted the most compared to other food components. Protein was better consumed for mixed porridge which could be attributed to the softer texture of protein cooked together with vegetables and rice in the form of porridge compared to separate chopped protein dish for minced diet. Although the protein dish for minced diet is always served with soup or gravy, it is important for the kitchen staff to ensure that the protein dish is cooked until soft and tender before being minced. Preparation of minced diet should not only focus on the right size of the protein/vegetable/fruit to minimise the effort of chewing but also to make sure that each food component served is moist enough to be consumed by patients. In this study, fruit/dessert component was wasted the least for both minced diet and mixed porridge. Similar trend was observed in other studies both locally and worldwide of which conclusion can be made that regardless of diet texture, regular or modified, fruits and desserts are the food items most enjoyed by hospitalised patients [949].
Contributing factors to TMD plate waste with regards to food and food service quality were investigated in this study by conducting a patient satisfaction survey. Patient satisfaction is a useful indicator to measure the quality of meal provision in hospital setting and is often associated with plate waste. Patients' satisfaction towards food served to them is claimed to lead to zero plate waste [49]. In this study, overall, patients' satisfaction level was found to be moderate. Comparing the two major domains surveyed, patients receiving TMD were less satisfied with the food quality rather than the food service. As for the food quality domain, several sensory qualities of food were found to be significantly associated with TMD plate waste. In our opinion, it is more useful to discuss any significant association by individual diet type rather than in general. Minced diet plate waste was shown to have a moderate correlation with the satisfaction towards food appearance and taste, vegetables and chicken/meat/fish served. Minced diet is normally directly served onto a compartmentalised plate by food items making them look less attractive. The presentation of minced diet could be further enhanced by using moulds to reshape the minced food items as what has been reported previously to be successful in increasing the intake of institutionalised elders receiving minced diet [33]. The use of colourful garnish could also motivate patients to consume the diet. As mentioned above, in the preparation of minced diet, the protein source and also vegetables need to be well cooked until soft and moist texture is achieved rather than boiling the protein source and blanching the vegetables before mincing them to later be served with soup or gravy. Proteins and vegetables are better cooked in the gravy or soup before being strained and chopped to the appropriate size. This would also enhance the taste of minced diet.
Plate waste was the lowest for mixed porridge diet in this study and it was found to be weakly correlated with patients' satisfaction towards food texture and temperature. While the correlation is weak, it is still important to reflect on what could be done to improve the rate of plate waste for mixed porridge since 35% of average plate waste is still considered high [43]. In general, it is crucial for the kitchen staff to prepare TMD with a consistent texture or consistency. While it is somehow more easily achieved for minced diet, kitchen staff preparing mixed porridge should be sure that the consistency is not too thick as that would lead to difficulty to be swallowed or too runny as that will not only less favoured by patients but will also decrease the calorie density of the mixed porridge. This can be done by following a standard recipe. As for the food temperature, it is worth to highlight that among other aspects of food sensory, highest score was given to the temperature of food served for all three TMD studied. This is due to the use of Ready to Serve (RTS) trolley for meal transportation in the studied hospital. RTS trolley could ensure that hot foods (carbohydrate, protein and vegetable items) are served hot while fruits and desserts are served cold to the patients. However, the weak correlation between food temperature and plate waste could be due to the time the patients consume the served meal. While RTS trolley ensures that diets are served at a desirable temperature, it is also important to encourage TMD patients to consume their meal as soon as it is being served to prevent the food from getting cold especially in the air conditioned environment of the ward. Mixed porridge will thicken as it gets cold and this could also explain the correlation between both temperature and texture with the plate waste.
For blended diet, the high plate waste was found to be moderately associated with patients' satisfaction towards the variety of food. Since blended diet had the most alteration in texture, it is crucial to offer food variation to increase food intake. High plate waste is often associated with blended or purees diet because the mechanical alteration makes it look less attractive as it resembles baby food [50]. It has been a practice in the studied hospital to offer blended diet by blenderising mixed porridge leading to decreased consumption by patients over time due to limited food variation. Blended or pureed diet could be served as individual items like a regular diet, only that the texture is altered to achieve a puree form. Patients could also appreciate the taste of each food item more when a menu such like a regular diet is followed. Further, food moulds should be used to reform the pureed food items which could increase the intake of pureed diet as previously conducted successfully by Germain et al. [33] among institutionalised care residents.
Although several studies pointed out that quality of food service was a factor contributing to plate waste [1617], in this study, patients were satisfied with the quality of food service provided and no significant association was found between TMD plate waste and patients' satisfaction towards food service. Even though patients are more concerned on food quality rather than food service, a poor service might worsen the motivation for patients to consume hospital diets. A flexible, good quality and responsive food service process in hospital food delivery was found associated with the reduction of hospital plate waste [51].
Among the clinical/external contributing factors surveyed, only for blended diet where appetite and time taking the diet was found to be moderately correlated with plate waste. This is expected and has been observed in many other plate waste studies although not specific on TMD. A study among hospitalised patients in Switzerland found that 50% of the patients reported to experience less appetite during their hospitalisation affecting their consumption of hospital meals. Besides, change of smell and taste is common in older inpatients as part of aging process which also have a direct influence on the appetite and enjoyment of foods [52]. It was highlighted from this study that patients receiving TMD especially those on blended diet might need longer time to minimise plate waste. Many hospital caterers encouraged patients to eat at food service time but many patients were unable to finish the meals provided on time and at the same time the workload of the food service staff did not allow them to wait until patients finish their meals [16]. It is timely for hospital food service providers to really consider expanding the meal serving time or at the very least to allow late plate collection for patients on TMD especially those receiving blended diet. This strategy would probably help reducing the amount of money being wasted due to hospital food waste that could have an impact on economy. Several nations have identified the economic loss related to hospital food waste and this should be followed by many other countries. According to Cereda and Pedrolli [53], in the year 2000, food waste from British hospitals contributed to the total amount of 28 million Pounds whilst hospitals in Portugal in general throw away 0.5% of the Portuguese health budget as food waste with an estimation of 3.9 Euros for food waste has been rising from each hospitalised patient per day [44].
Clinical/external factors such as the need of assistance during feeding, consumption of ONS and consumption of outside foods were not found to be associated with TMD plate waste in this study unlike what has been reported by other studies [654]. Additionally, the length of hospital stay and nutritional status according to BMI were also not associated with TMD plate waste. This was in contrast with the study by Kandiah et al. [18] and Simzari et al. [12] whereby the length of hospital stay and hospital malnutrition were associated with plate waste respectively.
Overall, appearance of diet and variety of foods were found as predictors of TMD plate waste in this study. This suggests that in the provision of TMD to hospitalised patients, it is very crucial to offer TMD that are visually appealing as well as to offer various types of food to cater for different eating habit and individual preference as an important approach to reduce plate waste among patients prescribed with meals that need modification in texture. In return, this will not only benefit the hospital to maintain the operation within cost but could also improve nutritional adequacy leading to better clinical outcomes among inpatients as supported by Leandro-Merhi et al. [55].
There were some limitations in this study such as data collection on plate waste was just involving foods served but not beverages, and also limited to just lunch and dinner meals. However, this study has successfully provided plate waste data on TMD together with its associating factors that is known to be least studied in the hospital food service setting. Future research should involve all meal times and to include more institutions in order to add on to the initial data that this research has. It is also suggested that future research on TMD to also be expanded to include study on the implementation and patient acceptance of thickened fluids and beverages.
In conclusion, blended diet was identified as the most wasted diet followed by minced diet among the three types of TMD studied. Reciprocal relationship occurred between percentage of TMD plate waste and the overall satisfaction level of patients receiving TMD suggests that actions are needed to improve the satisfaction level of patients. While in general, effort from the hospital food service providers should be focused more on improving the appearance and food variety of TMD, it is also important to conduct in house TMD plate waste assessment regularly to identify the factors that could hinder patients from optimally consuming their meals. Each hospital has its own unique types of TMD which warrants also a unique approach to combat plate waste. Furthermore, patient education on the importance of consuming the right textured diet should be implemented to increase awareness and acceptance among patients at the ward level. Additionally, the hospital management must play their role by encouraging and giving full support to their respective food service provider especially on the use of food mould and other technologies whenever possible in the provision of texture modified meals.

ACKNOWLEDGMENTS

We would like to thank all the subjects and their caregivers who participated in this study. Special thanks to all the staff involved in the Department of Dietetics and Food Services UKM Medical Centre for giving us support when this study was carried out.

Notes

Funding: This project was partially supported by internal grant from Universiti Kebangsaan Malaysia (GGPM-2018-050).

Conflict of Interest: The authors declare no potential conflicts of interests.

Author Contributions:

  • Conceptualization: Razalli NH, Abdul Manaf Z.

  • Formal analysis: Cheah CF, Mohammad NMA.

  • Investigation: Cheah CF, Mohammad NMA.

  • Methodology: Razalli NH, Abdul Manaf Z.

  • Supervision: Razalli NH, Abdul Manaf Z.

  • Validation: Razalli NH.

  • Writing - original draft: Cheah CF, Mohammad NMA, Razalli NH.

  • Writing - review & editing: Razalli NH.

References

1. Gustavsson J, Cederberg C, Sonesson U, Van Otterdijk R, Meybeck A. Global Food Losses and Food Waste. Rome: Food and Agriculture Organization of the United Nations;2011.
2. Goonan S, Mirosa M, Spence H. Getting a taste for food waste: a mixed methods ethnographic study into hospital food waste before patient consumption conducted at three New Zealand foodservice facilities. J Acad Nutr Diet. 2014; 114:63–71. PMID: 24231365.
crossref
3. Comstock EM, St Pierre RG, Mackiernan YD. Measuring individual plate waste in school lunches. Visual estimation and children's ratings vs. actual weighing of plate waste. J Am Diet Assoc. 1981; 79:290–296. PMID: 7264115.
4. Yang Z, Koh SK, Ng WC, Lim RCJ, Tan HTW, Tong YW, Dai Y, Chong C, Wang CH. Potential application of gasification to recycle food waste and rehabilitate acidic soil from secondary forests on degraded land in Southeast Asia. J Environ Manage. 2016; 172:40–48. PMID: 26921564.
crossref
5. Alam MM, Sujauddin M, Iqbal GMA, Huda SMS. Report: healthcare waste characterization in Chittagong Medical College Hospital, Bangladesh. Waste Manag Res. 2008; 26:291–296. PMID: 18649578.
crossref
6. Williams P, Walton K. Plate Waste in Hospitals and Strategies for Change. Amsterdam: Elsevier;2011.
7. Alshqaqeeq F, Twomey JM, Overcash MR. Food waste in hospitals. Int J Healthc Technol Manag. 2018; 17:186–196.
8. Ofei KT, Holst M, Rasmussen HH, Mikkelsen BE. How practice contributes to trolley food waste. A qualitative study among staff involved in serving meals to hospital patients. Appetite. 2014; 83:49–56. PMID: 25108237.
crossref
9. Zakiah L, Saimy I, Hamid MA. Plate waste among hospital inpatients. Malays J Public Health Med. 2005; 5:19–24.
10. Edwards JS, Hartwell HJ. Hospital food service: a comparative analysis of systems and introducing the ‘Steamplicity’ concept. J Hum Nutr Diet. 2006; 19:421–430. PMID: 17105539.
crossref
11. Gomes GS, Jorge MN. Rest-ingestion and waste index assessment at a commercial meal production unit in Ipatinga-MG. Nutri Gerais. 2012; 6:857–868.
12. Simzari K, Vahabzadeh D, Nouri Saeidlou S, Khoshbin S, Bektas Y. Food intake, plate waste and its association with malnutrition in hospitalized patients. Nutr Hosp. 2017; 34:1376–1381. PMID: 29280654.
crossref
13. Sahin B, Demir C, Aycicek H, Cihangiroglu N. Evaluation of factors affecting the food consumption levels of inpatients in a Turkish armed forces training hospital. Food Qual Prefer. 2007; 18:555–559.
crossref
14. Sahin B, Demir C, Celik Y, Teke AK. Factors affecting satisfaction level with the food services in a military hospital. J Med Syst. 2006; 30:381–387. PMID: 17069001.
crossref
15. Valero Díaz A, Caracuel García A. Evaluation of factors affecting plate waste of inpatients in different healthcare settings. Nutr Hosp. 2013; 28:419–427. PMID: 23822694.
16. Sonnino R, McWilliam S. Food waste, catering practices and public procurement: a case study of hospital food systems in Wales. Food Policy. 2011; 36:823–829.
crossref
17. Stanga Z, Zurflüh Y, Roselli M, Sterchi AB, Tanner B, Knecht G. Hospital food: a survey of patients' perceptions. Clin Nutr. 2003; 22:241–246. PMID: 12765662.
crossref
18. Kandiah J, Stinnett L, Lutton D. Visual plate waste in hospitalized patients: length of stay and diet order. J Am Diet Assoc. 2006; 106:1663–1666. PMID: 17000200.
crossref
19. Walton K, Williams P, Tapsell L. What do stakeholders consider the key issues affecting the quality of foodservice provision for long-stay patients? J Foodserv. 2006; 17:212–225.
crossref
20. Royal College of Speech and Language Therapists. Communicating Quality 3: RCSLT's Guidance on Best Practice in Service Organisation and Provision. 2nd ed. London: Royal College of Speech and Language Therapists;2006.
21. Aguilera JM, Park DJ. Texture-modified foods for the elderly: status, technology and opportunities. Trends Food Sci Technol. 2016; 57:156–164.
crossref
22. Cichero JA, Steele C, Duivestein J, Clavé P, Chen J, Kayashita J, Dantas R, Lecko C, Speyer R, Lam P, Murray J. The need for international terminology and definitions for texture-modified foods and thickened liquids used in dysphagia management: foundations of a global initiative. Curr Phys Med Rehabil Rep. 2013; 1:280–291. PMID: 24392282.
crossref
23. Yoshioka K, Yamamoto A, Matsushima Y, Hachisuka K, Ikeuchi Y. Effects of high pressure on the textural and sensory properties of minced fish meat gels for the dysphagia diet. Food Nutr Sci. 2016; 7:732–742.
24. Wright L, Cotter D, Hickson M, Frost G. Comparison of energy and protein intakes of older people consuming a texture modified diet with a normal hospital diet. J Hum Nutr Diet. 2005; 18:213–219. PMID: 15882384.
crossref
25. Puruhita N, Armeidani R, Kusumadewi A. Modifikasi tekstur makanan dan minuman pasien disfagia. Med Hosp. 2016; 3:207–212.
crossref
26. Goes VF, Mello-Carpes PB, de Oliveira LO, Hack J, Magro M, Bonini JS. Evaluation of dysphagia risk, nutritional status and caloric intake in elderly patients with Alzheimer's. Rev Lat Am Enfermagem. 2014; 22:317–324. PMID: 26107841.
crossref
27. Martino R, Foley N, Bhogal S, Diamant N, Speechley M, Teasell R. Dysphagia after stroke: incidence, diagnosis, and pulmonary complications. Stroke. 2005; 36:2756–2763. PMID: 16269630.
28. Ministry of Health Malaysia. Manual Diet Hospital. Kuala Lumpur: Dietetics and Food Service Unit, Ministry of Health Malaysia;2016.
29. Cichero JA, Lam P, Steele CM, Hanson B, Chen J, Dantas RO, Duivestein J, Kayashita J, Lecko C, Murray J, Pillay M, Riquelme L, Stanschus S. Development of international terminology and definitions for texture-modified foods and thickened fluids used in dysphagia management: the IDDSI framework. Dysphagia. 2017; 32:293–314. PMID: 27913916.
crossref
30. IDDSI. International Dysphagia Diet Standardization Initiative [Internet]. place unknown: IDDSI;2016. cited 2019 August 3. Available from:https://iddsi.org.
31. Massoulard A, Bonnabau H, Gindre-Poulvelarie L, Baptistev A, Preux PM, Villemonteix C, Javerliat V, Fraysse JL, Desport JC. Analysis of the food consumption of 87 elderly nursing home residents, depending on food texture. J Nutr Health Aging. 2011; 15:192–195. PMID: 21369666.
crossref
32. Bannerman E, McDermott K. Dietary and fluid intakes of older adults in care homes requiring a texture modified diet: the role of snacks. J Am Med Dir Assoc. 2011; 12:234–239. PMID: 21333927.
crossref
33. Germain I, Dufresne T, Gray-Donald K. A novel dysphagia diet improves the nutrient intake of institutionalized elders. J Am Diet Assoc. 2006; 106:1614–1623. PMID: 17000194.
crossref
34. Dahl WJ, Whiting SJ, Tyler RT. Protein content of puréed diets: implications for planning. Can J Diet Pract Res. 2007; 68:99–102. PMID: 17553196.
crossref
35. Shahar S, Pooy NS. Predictive equations for estimation of stature in Malaysian elderly people. Asia Pac J Clin Nutr. 2003; 12:80–84. PMID: 12737015.
36. Ross Laboratories. The Ross Knee Height Caliper. The IP com Prior Art Database. Columbus (OH): Ross Laboratories;2002.
37. Joung HW, Kim HS, Yuan JJ, Huffman L. Service quality, satisfaction, and behavioral intention in home delivered meals program. Nutr Res Pract. 2011; 5:163–168. PMID: 21556231.
crossref
38. Khalib MKN, Manaf ZA, Shahar S, Ludin AFM. Delivery of healthy lunch to worksites: a two weeks pilot study in a sample of working adults in Selangor, Malaysia. Malays J Nutr. 2018; 24:575–585.
39. Amano N, Nakamura T. Accuracy of the visual estimation method as a predictor of food intake in Alzheimer's patients provided with different types of food. Clin Nutr ESPEN. 2018; 23:122–128. PMID: 29460787.
crossref
40. Bjornsdottir R, Oskarsdottir ES, Thordardottir FR, Ramel A, Thorsdottir I, Gunnarsdottir I. Validation of a plate diagram sheet for estimation of energy and protein intake in hospitalized patients. Clin Nutr. 2013; 32:746–751. PMID: 23305605.
crossref
41. Holdt CS, Sitter K, Gates GE. Comparison of plate waste estimation measures in a pediatric hospital. Food Res Int. 1993; 7:81–91.
crossref
42. Anasako Y, Akamatsu R. A systematic review of the reliability and validity of the visual estimation method to measure plate waste in food service facilities. Jpn J Nutr Diet. 2014; 72:181–192.
crossref
43. Edwards J, Nash A. Catering services. Measuring the wasteline. Health Serv J. 1997; 107:26–27.
44. Dias-Ferreira C, Santos T, Oliveira V. Hospital food waste and environmental and economic indicators--a Portuguese case study. Waste Manag. 2015; 46:146–154. PMID: 26427934.
45. Aminuddin NF, Vijayakumaran RK, Abdul Razak S. Patient satisfaction with hospital foodservice and its impact on plate waste in public hospitals in East Malaysia. Hosp Pract Res. 2018; 3:90–97.
46. Nowson CA, Sherwin AJ, McPhee JG, Wark JD, Flicker L. Energy, protein, calcium, vitamin D and fibre intakes from meals in residential care establishments in Australia. Asia Pac J Clin Nutr. 2003; 12:172–177. PMID: 12810407.
47. Keawkaika S, Suzuki K, Hagura Y. Determination of viscoelastic properties of rice porridge by the non-rotational concentric cylinder method. Food Sci Technol Res. 2010; 16:23–30.
crossref
48. Shahar S, Chee KY, Wan Chik WC. Food intakes and preferences of hospitalised geriatric patients. BMC Geriatr. 2002; 2:3. PMID: 12165100.
crossref
49. Tamby Chik C, Adilah Zulkiply N, Bachok S, Mohi Z, Mohd Shahril A. Plate waste in public hospitals foodservice management in Selangor, Malaysia. Indian J Sci Technol. 2019; 11:1–5.
50. Ballou Stahlman L, Mertz Garcia J, Hakel M, Chambers E 4th. Comparison ratings of pureed versus molded fruits: preliminary results. Dysphagia. 2000; 15:2–5. PMID: 10594251.
crossref
51. Donini LM, Castellaneta E, De Guglielmi S, De Felice MR, Savina C, Coletti C, Paolini M, Cannella C. Improvement in the quality of the catering service of a rehabilitation hospital. Clin Nutr. 2008; 27:105–114. PMID: 18063444.
crossref
52. Valero Díaz A, Caracuel García Á. Evaluation of factors affecting plate waste of inpatients in different healthcare settings. Nutr Hosp. 2013; 28:419–427. PMID: 23822694.
53. Cereda E, Pedrolli C. Food waste: other issues and settings should be considered. Nutr Bull. 2009; 34:238–239.
54. Abdelhafez AM, Al Qurashi L, Al Ziyadi R, Kuwair A, Shobki M, Mograbi H. Analysis of factors affecting the satisfaction levels of patients toward food services at general hospitals in Makkah, Saudi Arabia. Am J Med Med Sci. 2012; 2:123–130.
55. Leandro-Merhi VA, Aquino JLB. Relationship between nutritional status and the clinical outcomes of patients with and without neoplasms according to multiple correspondence analysis. Arq Gastroenterol. 2017; 54:148–155. PMID: 28198916.
crossref
TOOLS
Similar articles