

 PDF
PDF Citation
 Print
Print


INTRODUCTION
Food records are used to assess the food intakes of free-living individuals. A perceived strength of food records is that the bias due to memory is minimal if the participant records foods immediately after intake [1]. However, knowledge of recording food intake in the near future may influence the participant to alter one's diet to simplify the task of recording foods. Although the 24-h recall method can resolve this issue, it requires assistance from an interviewer or an automated software, which may increase the number of required resources. In addition, bias may be introduced by the interviewer or software. Misreporting of dietary intake occurs in both food records and 24-h recalls, with a greater discrepancy from actual intake observed in the latter method [234]. Therefore, food records may be an economic and more effective tool to evaluate dietary intake if performed properly.
The validity of dietary assessment, including food records and 24-h recalls, has been studied in various populations, such as those in the US, the UK, and Belgium [345678], but few validation studies have been performed in Korea. The results of previous validation studies are not applicable to Korea as Korean food culture drastically differs from those of Western countries. For instance, Korean meals traditionally consist of rice, soup, kimchi, sauces, and side dishes. Most side dishes are shared rather than served individually. No studies have assessed the validity of food records in Korea, and few studies have assessed the accuracy of 24-h recalls in Koreans [910]. Recently, the accuracy was tested in older Korean men and women using the doubly labeled water method for reported energy intake [910], but not for other nutrients or food groups. Dietary patterns and food intake, in addition to nutrient intake, are important in nutrition research but the accuracy of food records according to food groups has not been assessed in Koreans. In addition, previous studies in Western countries have shown that participants easily omit snacks and condiments [1], but the accuracy of food records according to type of dish in Korean meals has not been investigated. Therefore, investigation of the validity of food records according to type of dish and food group is required to improve the accuracy of diet assessment in Koreans.
Owing to the lack of studies validating dietary intake assessment in Koreans, we assessed the accuracy of food item and portion size estimation of estimated food records according to food group and type of dish in the Korean diet, and the effect of a short education session aimed to improve food record accuracy in young Korean women.
SUBJECTS AND METHODS
Subjects
This study was conducted as a secondary study of a controlled-feeding trial focusing on the effect of seaweed intake on bone biomarkers and gut microbiota [11]. Data of 30 Korean women participating in a 5-day controlled-feeding study conducted in Wando-gun, Jeollanam-do province from June 25 to June 29, 2018, were analyzed. Food records of the first 3 days (June 25 to June 27, 2018) were used. The participants' weight and height were measured prior to participation in the controlled-feeding period. The recruitment criteria for the parent study was females aged 18–39 yrs with low Ca intake (< 400 mg/day) over the last 3 months, which was assessed by a food frequency questionnaire. We excluded the following participants: individuals who smoked, were pregnant or breastfeeding, had liver/kidney/thyroid diseases, were consuming hormones or steroids, or had experienced a fracture in the last 6 months. Participants were randomized to the experimental or control groups: the experimental group received an additional portion of seaweed (approximately 20 g [dry weight]/day; primarily Undaria pinnatifida). The study protocol was approved by the Institutional Review Board of Chonnam National University (IRB number: 1040198-180320-HR-017-03) and was registered at www.cris.cdc.go.kr (registration number: KCT0003307).
Diet
Data of the first 3 days of the controlled-feeding period were used. Participants were provided 6 meals and 5 snacks during this period. The subjects consumed all of the served foods. The meals were mostly typical Korean-style meals consisting of cooked rice, soup, kimchi, and 2–3 side dishes. Bread was served occasionally for breakfast. Food was served according to one's energy requirement, which was calculated based on the Harris-Benedict equation [12] and physical activity level. Nutrients were provided according to the 2015 Dietary Reference Intake for Koreans (KDRIs) or the mean intake of Koreans [13]. All food items were weighed to the nearest 0.1 g on a scale before serving. The participants were monitored for compliance to all meals and snacks and during other activities throughout the day by research personnel. They were allowed but not strongly encouraged to take photographs of their food and to use these photographs for reference during the completion of food records. One participant who did not consume all of the served food was excluded from the analysis of portion size estimation.
Education session
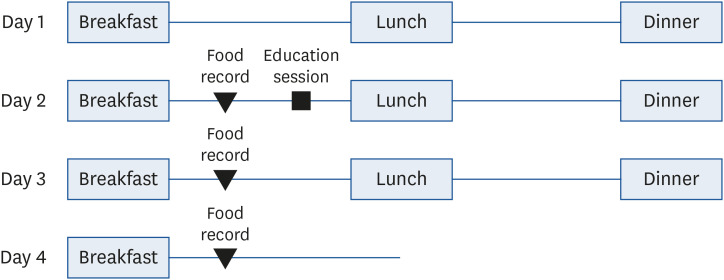
An education session was conducted before lunch on the second day of the study (Fig. 1). This approximately 40-minute-long session consisted of a short lecture and hands-on training. During the lecture, a dietitian expounded on independently completing a food record using the multiple-pass approach for a 24-h recall [14] and estimating portion sizes in grams or using standardized measurement tools. Next, the participants were shown 24 photographs of a single portion size of various foods according to food group: grains (cooked rice, bread, cereal, cooked noodles, and potatoes); meat, fish, eggs, and beans (MFEB; pork, chicken, fish, eggs, tofu, and beans); vegetables (kimchi, seaweed [wet], cucumber, and bean sprouts); fruits (melon, watermelon, strawberry, banana, orange, grape, and apple); dairy (milk); and oils and sugars (sugar). Further, the participants were organized into groups to measure the portion sizes of 8 different foods (cooked rice, chicken, kimchi, salad, banana, apples, bean sprouts, and lettuce) with respect to at least three different quantities using a provided scale. For example, for cooked rice, the participants measured half a bowl of rice (100 g), 3/4 bowl of rice (150 g), and one bowl of rice (210 g) and were also encouraged to measure the amount of rice they usually consumed.
Food records
Food records were completed on the morning of the day following consumption for 3 days (Fig. 1). The participants were provided sheets of paper with a labeled blank table to record the type of meal (breakfast, lunch, dinner, and snack), time and place, name of the food, ingredients, method of preparation, name of the brand/company, and portion size. As the education session was conducted on day 2, the data collected for day 1 indicated pre-education data (baseline), and data of days 2 and 3 were the results obtained after the education session. The food record for day 1 was unannounced, and the subjects were informed of the food records of the following days during the education session.
Accuracy of diet records
We assessed the accuracy of the food records for both 1) food items and 2) portion sizes by comparing them with actual intakes. The accuracy of reported food items was assessed by comparing the recorded items with the consumed food items in 3 match levels (exact, close, or far), similar to the protocol of Kirkpatrick et al. [15]. For example, if a participant had actually consumed soybean paste (deonjang) soup with spinach, a recall of soybean paste soup with spinach was evaluated as an exact match. If the participant reported consuming soybean paste soup with a different green vegetable, this was considered a close match. An example of a far match would be soybean paste soup with tofu. Exclusions (i.e., foods consumed but not recorded) and intrusions (i.e., foods reported but not consumed) were also determined.
The accuracy of portion size was measured by comparing the amount recorded with the amount actually consumed. The actual amount was set at 100%, and the recorded amount of food was calculated against the actual amount. Accuracy was classified as accurate estimates (90–110% of the actual intake), similar estimates (51–89% [underestimate] or 111–199% [overestimate] of the actual intake), or inaccurate estimates (≤ 50% [underestimate] or ≥ 200% [overestimate] of the actual intake). This classification was determined arbitrarily due to the lack of categorization in the available literature. If a record was blank or the reported amount was not quantifiable, the value was considered to be missing. When the amount was recorded in terms of size (width × length) or volume, the amount was converted to grams using the conversion database developed by the Korea Health Industry Development Institute [16]. If no conversion between size or volume and weight was available, 2–3 experienced dietitians were consulted. The accuracy of soup portion sizes was graded based on the total (liquid + solid) amount served and recorded. The accuracy of portion sizes of salad dressing was not assessable as most participants recorded a combination of the portion sizes of the salad and dressing.
Further analyses were performed according to food groups and types of dishes. Food groups (grains, MFEB, vegetables, fruit, dairy, and oils and sugars) were categorized in line with the 2015 KDRIs [13]. Soups consisted mostly of water and were excluded from the food group analyses. Due to the primary hypothesis, dairy foods were provided only once during the study.
The type of dish was determined according to Korean meal culture, which traditionally consists of rice, soup, kimchi, and several side dishes. Spreads, such as butter or ssamjang (a mixture of bean curd and other spices that is typically consumed with raw leafy vegetables), snacks, and beverages were also analyzed separately. Bread served for in the morning was considered a snack, according to Korean food culture. Assessments of matching food items and estimations of portion size were cross-checked by 2–3 research personnel for accuracy.
Statistical analyses
The mean percentages were reported, similar to that by Kirkpatrick et al. [15]. The mean value of day 1 was compared with the mean values of days 2 and 3 using the paired t-test to assess the effectiveness of the education program. For sub-analysis by food groups, if the side dish contained various ingredients, the 2 major ingredients were selected, and each ingredient was calculated to constitute half a dish. All statistical analyses were performed with statistical software SAS 9.4 (SAS Institute Inc., Cary, NC, USA). Null hypotheses were rejected when the P-value was < 0.05.
RESULTS
Participant characteristics
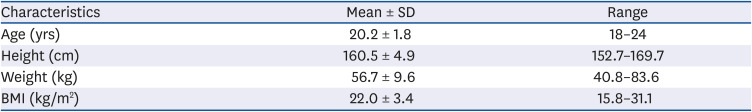
The participants were relatively healthy women with a mean age of 20.2 yrs and a mean body mass index of 22.0 kg/m2 (Table 1). All participants were university students hailing from various regions of Korea. Four participants were undergraduates majoring in food and nutrition. We found no differences in results between students majoring in food and nutrition and those majoring in other subjects. Therefore, the results of all participants were combined and reported.
Accuracy of food items
We investigated the accuracy of recorded food items (Table 2). On day 1, on which a total of 15 items were served, the mean proportions were as follows: exact matches, 80.9%; close matches, 10.9%; far matches, 2.0%; and exclusions, 6.2%. The mean number of intrusions was 0.1; 2 participants reported consuming kimchi more frequently than actually served. The accuracy of recorded food items on days 2 and 3 (following the first education session) did not differ from that of recorded food items on day 1.
Table 2
Mean proportions of exact, close, and far matches and exclusions and the mean number of intrusions for food items of the food records in young Korean women before and after a single education session (n = 30)
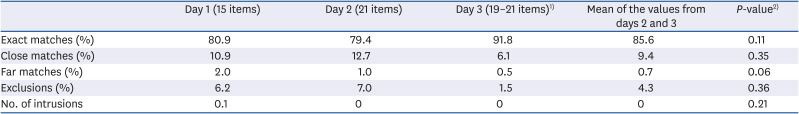
1)The control group consumed 19 items and the experimental group consumed 20 items. The participants requiring higher energy intake consumed two additional items.
2)P-values are results of paired t-tests for comparison between the values for day 1 (before the education session) and the mean of the values for days 2 and 3 (after the education session).
Furthermore, we assessed the accuracy of recalled food items by food group or type of dish. The grain group showed relatively high percentages of exact matches regardless of training (day 1 vs. days 2 and 3: 95.3% vs. 97.9%; P = 0.43; Table 3). The percentage of exact matches in the MFEB group was 87.1% at baseline, with no observed effects of the education session. However, the percentage of close matches in the MFEB group increased after the education session (from 3.8% to 15.3%; P = 0.002). Additionally, the education session increased the accuracy of recorded food items from the vegetable group, as the proportion of exact matches increased from 80.2% to 89.3% (P = 0.02); however, the proportion of close matches decreased from 12.2% to 6.4% (P = 0.04). The proportion of close matches in the fruit group also increased after the education session (from 0% to 10.6%; P < 0.001). The yogurt provided on day 3 was recalled by all participants (100% of exact matches). In terms of the accuracy of recalled food items in the oils and sugars group (provided only on day 2), the proportions of exact matches, close matches, far matches, and exclusions were 55.0%, 36.7%, 1.7%, and 6.7%, respectively (data not shown).
Table 3
Mean proportions of exact, close, and far matches and exclusions and the mean number of intrusions for food items of food records according to food group before and after a single education session in young Korean women (n = 30)1)
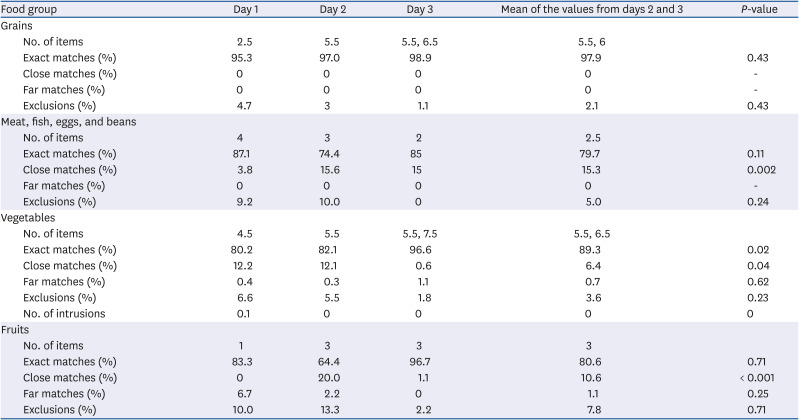
1)Three items, 2 items, and 1 item were excluded from the analyses of days 1, 2, and 3, respectively, as some foods (soup and spreads) could not be classified into any food group. The number of foods may differ according to the experimental group of the parent study. Only the vegetable group showed intrusions. Two items included in the oils and sugars group (provided only on day 2) and one item in the dairy group (consumed on day 3) are not shown. P-values are results of paired t-tests for comparison between the values for day 1 (before the education session) and the mean of the values for days 2 and 3 (after the education session).
When the accuracy of recorded food items was assessed by type of dish, rice and kimchi showed high proportions of exact matches (≥ 95%) throughout the study (Table 4). Soup, side dishes, and beverages also had a stable proportion of exact matches (≥ 75%). In terms of snacks, the proportion of exact matches increased after the education session from 60.0% to 94.8% (P < 0.001); however, this value decreased in spreads (from 80.0% to 36.7%, P < 0.001).
Table 4
Mean proportions of exact, close, and far matches and exclusions and the mean number of intrusions for food items of food records according to food type before and after a single education session in young Korean women (n = 30)1)
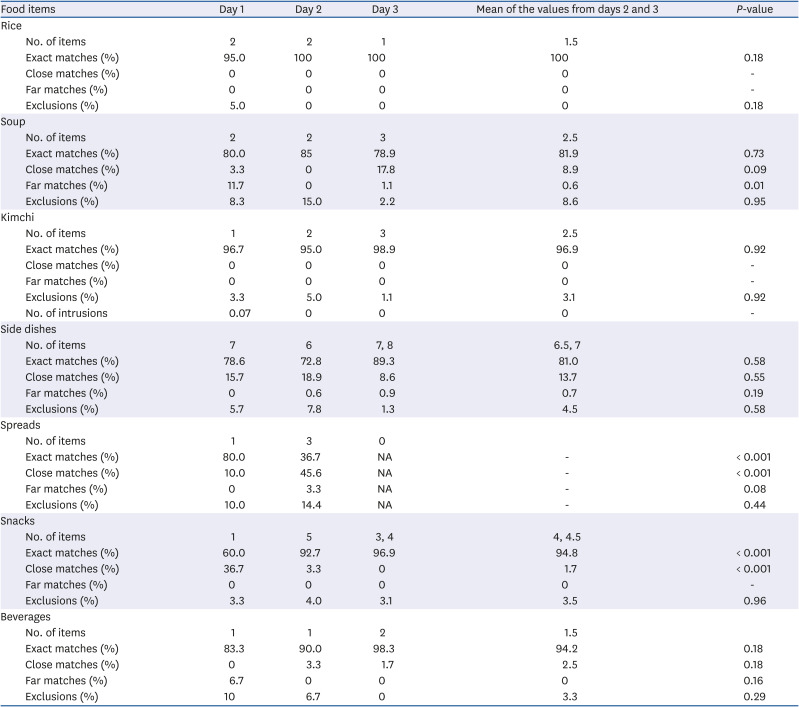
NA, not applicable.
1)The number of foods may differ according to the experimental group of the mother study. Only the kimchi group showed intrusions. P-values are results of paired t-tests for comparison between the values for day 1 (before the education session) and the mean of the values for days 2 and 3 (after the education session).
Accuracy of portion sizes
The proportions of accurate, similar, and inaccurate estimates were 11.7%, 19.8% and 12.2%, respectively (Table 5). Fifty-six percent of the foods had missing data for portion size estimates on day 1; this value significantly decreased to 14.0% after the education session (P < 0.001), thereby resulting in an approximately 2-fold increase in the proportions of all other portion size matches. Among similar and inaccurate estimates, the proportion of underestimates increased but that of overestimates did not.
Table 5
Mean proportions of accurate, similar, and inaccurate estimates, and missing portion sizes of food records before and after a single education session in young Korean women (n = 29)1)
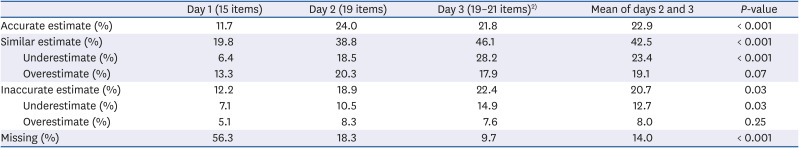
1)One participant who did not consume all the provided food was excluded from the analysis. P-values are results of paired t-tests for comparison between the values for day 1 (before the education session) and the mean of the values for days 2 and 3 (after the education session).
2)The control group consumed 19 items and the experimental group consumed 20 items. The participants requiring a higher energy intake consumed two additional items.
When stratified by food group, the portion sizes of 43.4% of grains, 18.1% of MFEB items, 5.0% of vegetables, and 37.9% of fruits were accurately reported at baseline (Table 6). Portion size estimation seemed to be particularly challenging for foods in the MFEB, vegetable, and fruit groups prior to the education session as over 40% of foods in these groups were missing portion size data. After the education session, the proportion of similar estimates in the MFEB group and those of accurate and similar estimates in the vegetable group increased. Surprisingly, the proportion of accurate estimates dropped in the grains and fruit groups, although an increase in the proportion of similar estimates was observed. The portion size of the dairy product (yogurt) provided on day 3 was accurately recorded by 58.6% of participants, however, 24.1% of the records were missing portion size estimates (data not shown). The portion size of butter (oils and sugars group) provided on day 2 was accurately reported by 62.1% of participants, while 20.7% of participants were missing portion size estimates (data not shown).
Table 6
Mean proportions of accurate, similar, and inaccurate estimates, and missing portion sizes of food records by food group in young Korean women (n = 29)1)
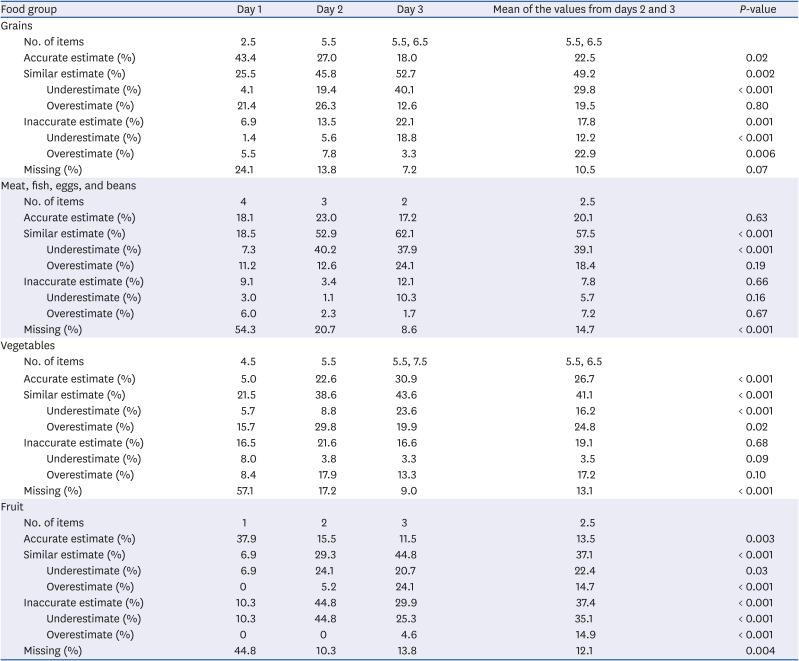
1)One participant who did not consume all the foods provided was excluded from the analysis. Three items, 2 items, and 1 item were excluded from the analyses of days 1, 2, and 3, respectively, as the foods could not be categorized into any food group. Portion sizes for salads and dressings were not reported separately, and salads and dressings were analyzed together as vegetables. One item in the oils and sugars group (consumed on day 2 only) and one item in the dairy group (consumed on day 3) are not shown. The number of foods may differ according to the experimental group of the parent study. P-values are results of paired t-tests for comparison between the values for day 1 (before the education session) and the mean of the values for days 2 and 3 (after the education session).
According to the type of dish, the proportions of accurate portion size estimates for rice, soup, kimchi, side dishes, spreads, snacks, and beverages at baseline were 8.6%, 6.9%, 10.3%, 9.9%, 0%, 31.0%, and 37.9%, respectively (Table 7). After the education session, the proportion of missing estimates of rice was negligible (1.7%, P < 0.001). Over 90% of the portion sizes were categorized as accurate or similar estimates in the rice group after the education session. A high increase was observed in the proportion of accurate estimates for kimchi, which increased from 10.3% to 51.1% (P < 0.001). The proportion of accurate estimates of soups, side dishes, and snacks did not increase, but the proportion of similar estimates increased after education in these types of dishes.
Table 7
Mean proportions of accurate, similar, and inaccurate estimates, and missing portion sizes of food records according to type of dish in young Korean women (n = 29)1)
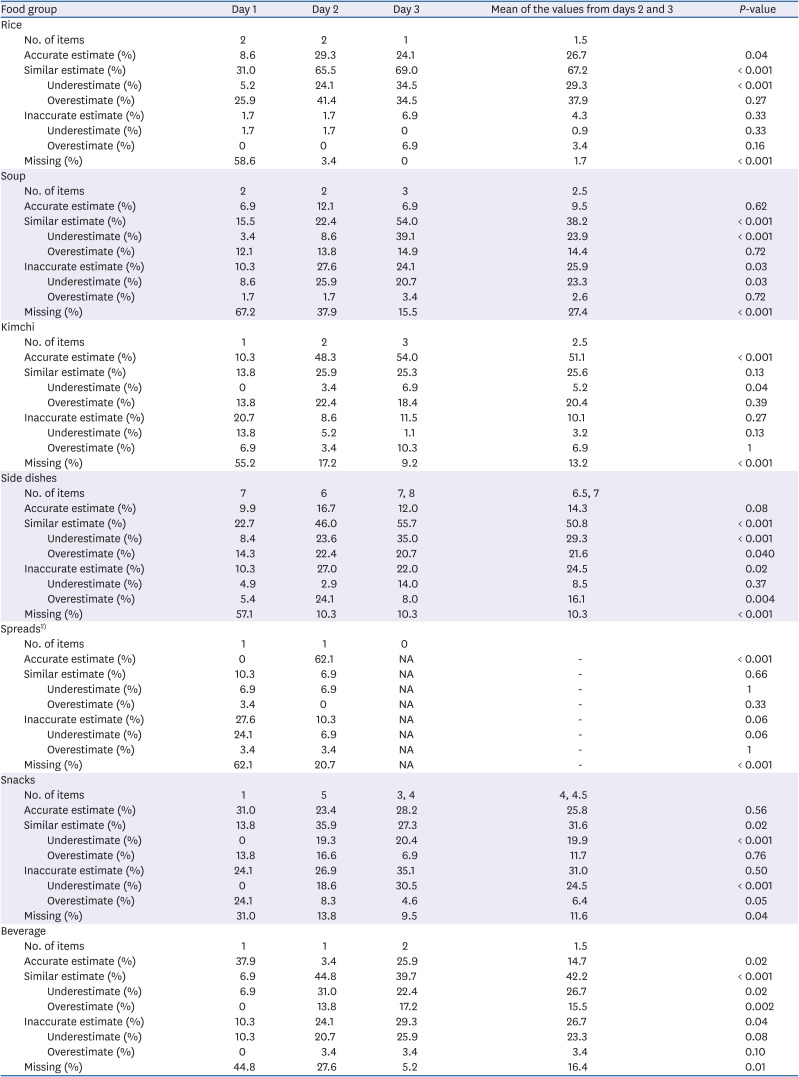
NA, not applicable.
1)One participant who did not consume all the provided food was excluded from the analysis. Salad and dressing were analyzed together as one type of dish since the amount of salad dressing was not reported separately. The number of foods may differ according to the experimental groups of the parent study. P-values are results of paired t-tests for comparison between the values for day 1 (before the education session) and the mean of the values for days 2 and 3 (after the education session).
2)P-values are results of a comparison between the values for day 1 and day 2.
DISCUSSION
Through a controlled-feeding study design, we assessed the validity of food records and the effect of a short education session on food records in young Korean women. Prior to education, the participants accurately reported 81% of the food items, but the precision of portion size estimation was low. The accuracy of reporting food items was not dramatically affected by the education provided, but portion size estimation drastically improved.
This is the first study to validate food records in Korean women by comparing the food records with actual intakes. Relative validity of food records has been measured by comparing them with 24-h recalls and food frequency questionnaires; however, the absolute validity has not been examined in Koreans [17]. Many efforts to validate food records have been made in Western countries according to nutrient intake but not according to food items or portion sizes [5718]. In our study, the proportion of accurately recalled food items was 81% in the pre-training assessment, and this value increased up to 90% in the post-training assessment. In contrast, use of the automated self-administered 24-h recall and interviewer-administered 24-h recall methods in adults in the US showed accuracies of 66.3% and 74.4%, respectively, for food items [15]. The relatively high accuracy of reported food items among our participants, despite the lack of help from an interviewer or software and despite the fact that reporting was performed the day after consumption, may have been influenced by several factors. One reason for this high accuracy is that the participants were aware of the upcoming food record and were allowed to photograph the meal, whereas participants evaluated by the 24-h recall method were not informed of the recall. Previous studies comparing the accuracy of 24-h recalls with that of food records found a higher accuracy in food records [24]. Moreover, as the participants of the present study knew that the researchers were aware of the foods provided, they may have been motivated to remember the consumed foods correctly. However, the results for food items before and after the announcement (day 1 and days 2 and 3, respectively) were similar, indicating that the announcement did not greatly improve the accuracy of the recall of food items. Another reason for the higher accuracy may be that our participants were younger and possibly more educated than the abovementioned US adults [15]. Our participants were 18–23-yr-old women receiving college education, whereas in the study in the US, the adults' age ranged between 20 and 70 yrs, and 42% did not have a college education [15]. Third, the differences in food culture and the different characteristics of the served foods may have affected the accuracy of the dietary assessment. Rice and kimchi, the two main staples of the Korean diet, were well recorded by our participants. In addition, we counted only two of the main ingredients in foods with mixed ingredients, as many ingredients of typical Korean-style foods (especially condiments such as soy sauce, pepper paste, sesame seed oil, vinegar, pepper flakes, and garlic) are usually mixed together and are difficult to distinguish by shape, color, or taste. In contrast, the study in US adults provided American-style foods and counted specific ingredients that could be recognized by shape, color, taste, or texture (e.g., cheese, vegetables, peppers, and spreads in a sandwich). On the other hand, exact matches of oils and sugars were relatively low (55%) on day 2, on which butter and salad dressing was served. This is in line with previous studies in Western food cultures which report that condiments are frequently omitted [1519]. Fourth, due to the study design, fixed amounts of foods were served by the study personnel on personal trays, instead of the buffet style or personally fixed meals provided in other studies [215]. During the controlled-feeding study, participants were not able to select or discard foods. Therefore, the participants could record the foods served on the tray rather than recall what was actually consumed. Korean meals typically involve the sharing of side dishes and sauces, which makes it more difficult to record or recall the intakes of these dishes. Our results may be more applicable to meals provided on individual trays, such as those provided in schools, offices, and military cafeterias. Thus, although the validity of food records for food items was acceptably high in young Korean women regardless of training, caution should be exercised when applying these results to other populations or study designs.
A high accuracy of food records was observed despite the portion sizes being estimated, not weighed, and reported on the day after consumption. Although weighed food records (WFRs) may be perceived to be an accurate tool for assessing dietary intake, most studies have shown that energy intake is underestimated in WFRs [256], and the degree of underestimation is similar to that observed in estimated (unweighed) food records [6]. In free-living individuals, WFRs are limited to settings in which measuring foods is possible. However, in some settings it may be impossible to weigh and record all foods and drinks immediately after consumption. Therefore, the completion of estimated food records within 24 h, if accurate, may be more reliable and convenient for capturing normal intake, especially in Korea where the frequencies of dining out and dining together are high [20]. In the current study, food records were not completed immediately after the meal, which may have introduced a memory bias similar to that in 24-h recalls. However, our participants showed a high rate of accuracy in recalling food items and portion sizes. Accurate portion size estimation at baseline was similar in our study (12%) and Canadian college students (10%) [21]. The accuracy of portion size estimation increased after the education session, especially when assessed by the type of dish. Others have reported a sustained effect of a 10-minute training, using food models labeled with their respective quantities, for up to 1–4 weeks (depending on the food) [222324]. The short and simple training session conducted in this study can be easily applied, possibly leading to substantial savings in resources. However, the duration of the effects of education and whether repeated hands-on training improves portion size estimation requires further investigation. Nevertheless, our results provide a rationale for the use of food records in Koreans after a short education program, especially for portion size estimation.
The hands-on education session on portion size may have directly influenced portion size estimation. The education session proved to be more effective for estimating the portion sizes of rice and kimchi than for estimating the portion sizes of other dishes. Accurate estimation of portion sizes of side dishes, which mostly consisted of cooked mixed ingredients, did not improve as the education session provided single raw ingredients. The lack of increase in accurate estimates in the soup and beverage groups may be due to the lack of hands-on training of liquids during the education session. These results also indicate that despite the lack of a control group in our study, the effects of hands-on training were directly reflected in the estimation of portion sizes of the foods included in the training, whereas the estimation of portion sizes of foods not included in the hands-on training session was less influenced. Although the effect of the education session cannot be measured for the dairy and oils and sugar groups as foods of these groups were served only after the education session, these groups had less accurate portion size estimates than other groups, possibly due to the lack of hands-on training in these groups as well. In addition, the effect of education on accurate portion size estimation was more obvious in the analysis by type of dish than in the analysis by food group. This may indicate that the participants were more likely to perceive portion sizes by the type of dish rather than by the food group. Therefore, the accuracy of portion size estimation may be enhanced by providing a wider variety of foods and dishes and focusing on the type of dish for hands-on training during future education sessions.
The actual dietary intake can be evaluated through various measurement methods. The actual nutrient intake can be assessed indirectly using equations, isotopes, or biomarkers for some nutrients [310]. However, the number of nutrients that can be evaluated using biomarkers is limited, and may not reflect the time of interest [1]. Most biomarkers assess absorbed nutrients rather than the foods consumed, thus making it difficult to assess dietary patterns. Food intake can also be indirectly estimated through unobtrusive observation, which has been used in school children [25] and adults [215]. Many methods to increase recall and portion size accuracy through the use of cameras, smartphones, and other digital devices have been developed, which have shown mixed results [2627]. Recently, Korean smartphone applications have been developed to detect food items using artificial intelligence, but portion size estimation from pictures is not yet available. Controlled-feeding studies have been performed to assess the validity of diet assessment in the US [28] but not in Korea. By using the controlled-feeding study design, we were able to eliminate possible errors introduced by the researchers and minimize the burden on the participants. Therefore, compared to studies with other designs, our study may have accurately estimated the validity of food records.
This study has limitations. One limitation of this study is that the number of items and types of dishes were not fully balanced between days, as this was a secondary study. Some changes in food record accuracy may be due to the variations in the menu or method of serving rather than due to education. For instance, the decrease in the proportion of accurate portion size estimates in the grain and fruit groups may be due to the increased variety of foods provided on days 2 and 3. As beverages were served in a juice box on day 1 but in plastic cups on days 2 and 3, the accuracy of beverage portion size estimation may have decreased on days 2 and 3. By using the mean values from days 2 and 3, we tried to decrease the variation between the days. In addition, we were not able to assess the education effect on foods in the dairy and oils and sugars groups, as these foods were only served on day 3 and 2, respectively. Second, pre-training data were available for only one day. Third, owing to the primary aim of this controlled-feeding study, we were able to assess the validity of dairy intake based on one item as dairy was offered on only one occasion. Additionally, due to the controlled-feeding design, meal and snack intakes in our participants may have differed from those in free-living young Korean women, although we provided a typical Korean meal acceptable to this population. As many foods are shared during a Korean meal (not served in individual dishes or trays), the accuracy of food records may decline in free-living populations. Finally, we were not able to validate nutrient intake using this method as most participants reported the majority of the ingredients but omitted the specific quantity. Therefore, the current results are limited to food intake. Still, this study is the first to assess the accuracy of food records for food items and portion sizes in Koreans and may serve as a basis for more intense validation of dietary assessment in Koreans for nutrient intake.
In conclusion, without training, young Korean women accurately estimated up to 81% of the total food items, but more than 50% of portion size estimates were missing in a food record documented the following morning. A short education session including hands-on training may effectively increase the accuracy of portion size estimation in young Korean women. Further research conducted in free-living individuals is required.
 XML Download