

 PDF
PDF Citation
 Print
Print


INTRODUCTION
A growing body of evidence reports that normal-weight obesity, defined as excessive body fat despite normal body mass index (BMI) [1], may pose a higher risk for a number of obesity-related complications, including cardiovascular disease (CVD) and mortality [2345]. One possible explanation for this in previous studies was that the percent body fat (PBF) of individuals with normal-weight obesity is as high as that of those with general obesity.
Excessive adiposity elevates the risk of diabetes mellitus and CVD [678910]. Another contributing factor might be lower muscle mass accompanied with higher fat mass. Low muscle mass increases the risk of CVD or mortality [1112]. However, BMI as the surrogate marker for obesity would not be accurate as it is a composite of muscle and fat mass.
In order to assess the excessive body fat despite normal BMI, instruments such as dual-energy X-ray absorptiometry (DXA), bioimpedance analysis (BIA), computed tomography, or magnetic resonance imaging (MRI) are needed [6]. However, such measurement methods are not easily accessible, notably in large-scale epidemiologic studies. On the other hand, waist circumference (WC) has been suggested as a surrogate marker of abdominal obesity that provides a more accurate estimate of the adipose tissue distribution than BMI, and abdominal obesity has been associated with the risk of metabolic diseases and mortality [789].
Few studies have explored the association between WC and muscle mass as well as fat mass or PBF in individuals with normal BMI or the appropriateness of applying national WC criteria to subjects with normal BMI. We, therefore, aimed to investigate the association of WC with body composition to distinguish muscle and fat mass, in a population of subjects with normal BMI who participated in the Korean National Health and Nutrition Examination Survey (KNHANES).
SUBJECTS AND METHODS
Ethics
The procedures followed were in accordance with the ethical standards of the Institutional Review Board of the Korea Center for Disease Control and Prevention and with the Helsinki Declaration of 1975, as revised in 2000. The Institutional Review Board of the Korea Center for Disease Control and Prevention reviewed and approved the KNHANES (IRB No. 2008-04EXP-01-C, 2009-01CON-03-2C, 2010-02CON-21, and 2011-02CON-06-C). All participants provided written informed consent.
Subjects
The study population was derived from KNHANES, which is conducted by the Korea Centers for Disease Control and Prevention. Subjects were selected using a randomized multistage stratified cluster sampling protocol according to the Korean national census data [10]. The initial candidates included 10,620 adults aged > 20 yrs and with normal BMI who participated in the surveys during 2008–2012, as DXA data were only available during this period. Normal BMI was defined as a value between 18.5 and 22.9 kg/m2 based on the Asian obesity guidelines [11]. We excluded patients who lacked DXA data (n = 3,102) or WC measurements (n = 26). The present analysis ultimately included data from 7,493 Korean adults (2,835 men and 4,658 women).
Assessment of anthropometric measurements
Height, body weight, and WC were measured by trained nurses. BMI was calculated by dividing the body weight (kg) by the square of the height (m2). DXA (HOLOGIC Discovery W Bone Densitometer, Hologic Inc., Bedford, MA, USA) was used to measure the detailed body composition, which was divided into the body fat mass and lean (i.e., fat-free) body mass; the latter comprised the bones, muscles, and other components, such as skin, tendons, and connective tissues. Eliminating the bone mass from the lean body mass provided the lean soft tissue mass.
For each subject, we collected various type of body composition data including fat, lean mass, and lean soft tissue mass, as follows: 1) fat percent: PBF, percent appendicular fat, and percent trunk fat; 2) fat mass index (kg/m2): body fat mass index (BFMI), appendicular fat mass, and trunk fat mass; 3) lean mass index (kg/m2): lean body mass index (LBMI), appendicular skeletal muscle mass index (ASMI), and lean trunk mass; 4) soft tissue mass index (kg/m2): appendicular skeletal soft tissue mass index, lean appendicular soft tissue mass, and lean trunk soft tissue mass. Each mass index was calculated by dividing each mass by the height square (kg/m2).
Covariates
Demographic variables, including age, household income, and education level, were collected for all the subjects. Smoking status was used to categorize subjects into 3 groups: non-smokers, ex-smokers, and current smokers; the latter included individuals who currently smoked or had smoked ≥ 100 cigarettes in their lifetime. Alcohol use was categorized into 3 groups: none, moderate, and hazardous; hazardous alcohol use was defined as an alcohol use disorder identification test score of ≥ 12 [12]. Physical activity was assessed using the Korean version of the International Physical Activity Questionnaire (IPAQ)-short form and was categorized on the basis of the total physical activity metabolic equivalents (METs) as low (< 600), moderate (600–2,999), or high (≥ 3,000) [13].
Statistical analysis
All estimates were weighted to represent the Korean population. The participant characteristics are reported as mean ± SEs or as frequencies. Differences in the characteristics according to sex were evaluated using the t-test for continuous variables and the χ2 test for categorical variables. Both men and women were subdivided into 4 groups according to the WC (cm): < 80, 80–84, 85–89, and ≥ 90 for men and < 75, 75–79, 80–84, and ≥ 85 for women. Abdominal obesity was defined as WC of ≥ 90 cm for men and ≥ 85 cm for women [14].
All percent fat and mass indices were subjected to a sex-stratified linear regression analysis according to the WC, and the results are expressed as adjusted means with 95% confidence intervals (CIs). We adjusted covariates relating to obesity, including age, education level, household income, physical activity, smoking status, alcohol use, and total energy intake. Subgroup analyses were conducted according to age, education level, household income, physical activity, smoking status, and alcohol use. All statistical analyses were performed using Stata 16.0 (StataCorp., College Station, TX, USA). A P-value of < 0.05 was considered as statistically significant.
RESULTS
Table 1 presents the general characteristics of the study subjects. The average age of men and women were 43.9 and 43.3 yrs, respectively. Significant differences were observed between men and women in most variables, with men having higher education level, smoking and alcohol use history, more physical activity than women. Table 2 presents the anthropometric measurements of the study population. Men and women had mean height of 170.7 and 157.9 cm, respectively, and mean body weight of 62.0 and 52.4 kg, respectively. Men and women had mean PBF values of 18.8% and 30.5%, respectively, and lean appendicular mass index of 7.57 and 5.87 kg/m2, respectively.
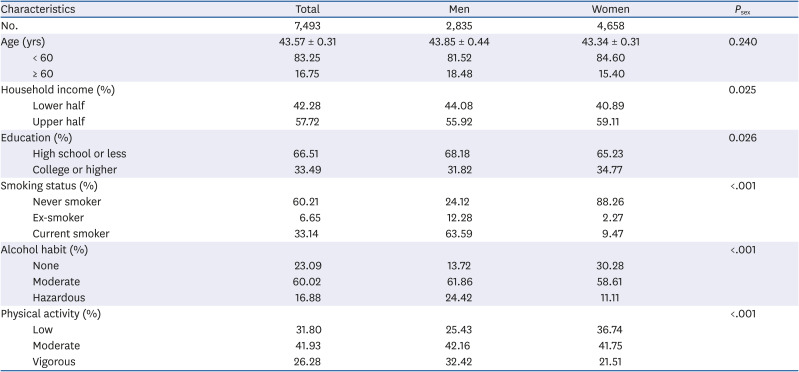
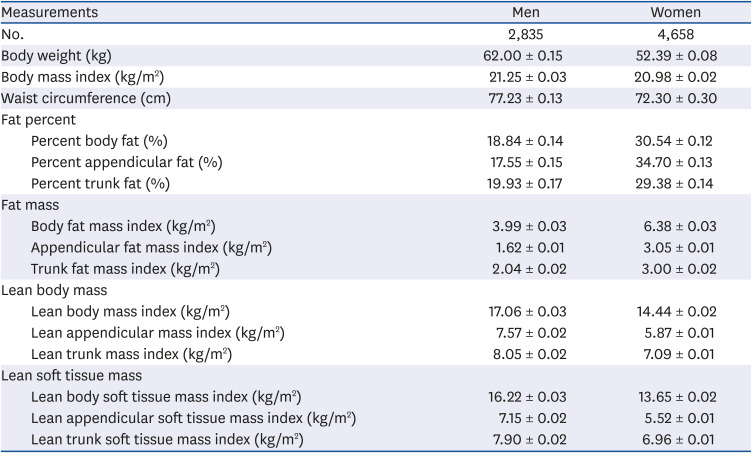
Table 1
General characteristics of study population
![]()
Table 2
Anthropometric measurements of study population
![]()
Fig. 1 depicts the mean PBF or BFMI according to the WC among men and women with normal BMI, adjusted for age, education level, household income, physical activity, smoking status, alcohol use, and total energy intake. Positive associations of the PBF and BFMI with WC were observed (all P value < 0.001). These positive association between fat composition and WC was in line with the main results among both men and women, even when investigating trunk and appendicular mass separately (Supplementary Tables 1 and 2, respectively).
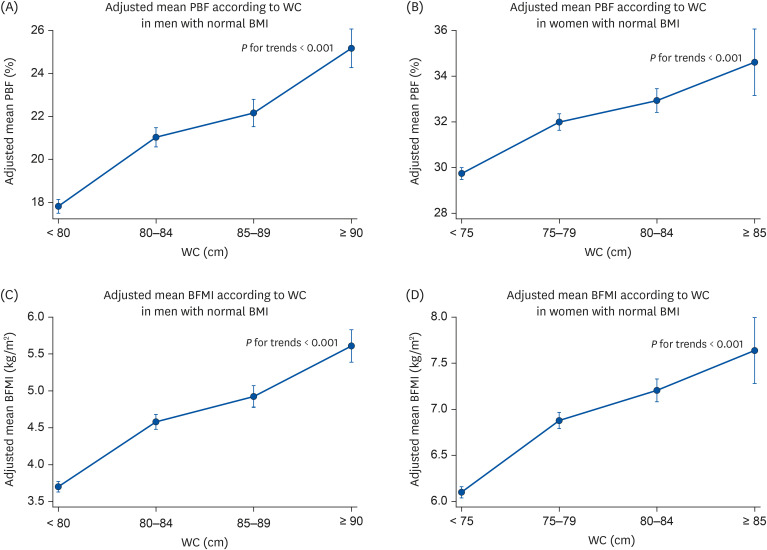
Fig. 1
The adjusted mean percent body fat and body fat mass index according to WC in men and women with normal BMI.
(A) Adjusted mean PBF according to WC in men with normal BMI. (B) Adjusted mean PBF according to WC in women with normal BMI. (C) Adjusted mean BFMI according to WC in men with normal BMI. (D) Adjusted mean BFMI according to WC in women with normal BMI.
WC, waist circumference; BMI, body mass index; PBF, percent body fat; BFMI, body fat mass index.
![]()
However, there were inverted J-shaped associations between LBMI or ASMI mass and WC (Fig. 2). The 4th group had a tendency of lower muscle mass than other groups in both men and women. Additionally, in women, the 1st group had also lower muscle mass. These inverted J-shaped associations between muscle composition and WC were in line with the main results, even when investigating trunk and appendicular mass separately, among both men and women (Supplementary Tables 3 and 4, respectively).
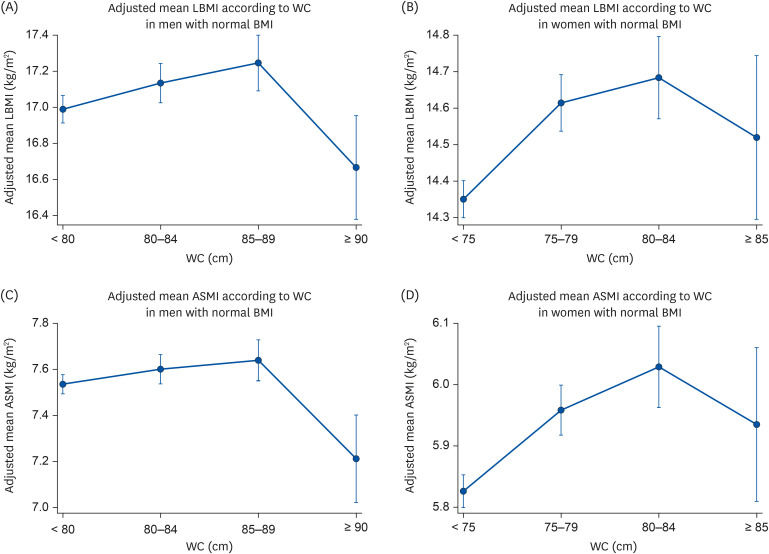
Fig. 2
The adjusted mean LBMI and ASMI according to WC in men and women with normal BMI.
(A) Adjusted mean LBMI according to WC in men with normal BMI. (B) Adjusted mean LBMI according to WC in women with normal BMI. (C) Adjusted mean ASMI according to WC in men with normal BMI. (D) Adjusted mean ASMI according to WC in women with normal BMI.
LBMI, lean body mass index; ASMI, appendicular skeletal muscle mass index; WC, waist circumference; BMI, body mass index.
![]()
The results of the subgroup analyses stratified by age, education level, income level, physical activity, alcohol use, and smoking status were similar to those of the overall analyses in both men and women. (Supplementary Tables 5 and 6).
DISCUSSION
In this analysis, we examined the association of WC with body composition in a population of Korean adults with normal BMI. There were positive associations of all indicators relating body fat with WC. However, there was an inverted J-shaped association of indicators relating muscle with WC. These observations implied that WC is particularly important when evaluating obesity in individuals with normal BMI. Additionally, our results are consistent with the current Korean WC-based guideline for determining abdominal obesity. To the best of our knowledge, this was the first study to examine the association of WC with diverse body composition in adults with normal BMI.
One previous study reported that persons with normal-weight obesity, defined as a BMI < 25 kg/m2 and PBF ≥ 66th percentile as assessed by BIA, had a higher PBF than that of overweight women [2]. However, there was no study on the association between WC and muscularity. In our analysis, individuals with a normal BMI had positive associations of the WC with the body fat indicators and inverted J-shaped associations of the WC with lean body indicators.
Although previous studies on the association between WC and body composition are scarce, the association between WC and health outcomes is well documented. Some studies reported that normal-weight obesity subjects have a higher level of insulin resistance than that in their normal-weight lean counterparts [1516]. Other studies reported that normal-weight obesity (PBF via MRI or DXA) was related with subclinical vascular inflammation [5] and cardiovascular mortality [3].
It has been previously reported that normal-weight obesity is associated with an increased risk of metabolic syndrome and CVD. Our findings state that normal-weight obesity is characterized by high body fat indicators and low lean body indicators, and the proposed mechanisms can be divided into 2 approaches. The first is regarding body fat indicators. Increasing fat mass elevates the levels of circulating fatty acids, thereby inducing lipo-toxicity and dyslipidemia, and enhances the synthesis of adipokines and proinflammatory cytokines, thereby inducing insulin resistance and diabetes mellitus [171819]. The second is regarding lean body mass, which is a feature that has not been well addressed previously. One prior study reported that high lean mass and low-fat mass were associated with a low risk of insulin resistance than low lean and high fat mass [20]. Additionally, we observed a decrease in the ASMI among subjects with normal-weight obesity who were younger than 60 yrs of age, which supports the findings of previous studies on sarcopenic obesity that have focused on the importance of decreasing muscle mass in the elderly [21].
The association between a low lean mass and an increased risk of CVD could be attributed to the role of the skeletal muscles as a main regulator of lipid and glucose metabolism. Circulating fatty acids are absorbed by the skeletal muscles and converted from triacylglycerides to free fatty acids via lipases, which are accumulated as lipid droplets when needed [22]. Consequently, skeletal muscle reduction diminishes the storage capacity for excess fat and glucose. However, we were unable to examine the cumulative effects of a low lean and high fat mass on health outcomes. This should be investigated in further studies.
We note that our study had some limitations. The analysis was subject to the inherent limitations of the cross-sectional national study design; therefore, we could not consider causality between the exposure and outcome, other potential confounding factors, and the possible low accuracy of self-reported covariates, such as physical activity, smoking status, and alcohol use. However, the survey subjects participated in face-to-face interviews with trained interviewers, which was intended to increase the recall accuracy. Despite this limitation, our study has provided a detailed analysis of the lean and fat mass parameters throughout the body according to the WC in a national representative sample of Korean adults with normal BMI.
In conclusion, there was a positive association between body fat and WC among individuals with normal BMI. Conversely, there was an inverted J-shaped association between lean body mass and WC. Our findings thus support the current Korean WC-based guideline for abdominal obesity and emphasize that obesity evaluations for adults should include WC measurement as well as BMI.
 XML Download