Journal List > J Korean Med Sci > v.36(35) > 1147478

Moon, Kim, Kang, Yang, and Lee: Prediction of COVID-19-related Mortality and 30-Day and 60-Day Survival Probabilities Using a Nomogram

Abstract

Background

Prediction of mortality in patients with coronavirus disease 2019 (COVID-19) is a key to improving the clinical outcomes, considering that the COVID-19 pandemic has led to the collapse of healthcare systems in many regions worldwide. This study aimed to identify the factors associated with COVID-19 mortality and to develop a nomogram for predicting mortality using clinical parameters and underlying diseases.

Methods

This study was performed in 5,626 patients with confirmed COVID-19 between February 1 and April 30, 2020 in South Korea. A Cox proportional hazards model and logistic regression model were used to construct a nomogram for predicting 30-day and 60-day survival probabilities and overall mortality, respectively in the train set. Calibration and discrimination were performed to validate the nomograms in the test set.

Results

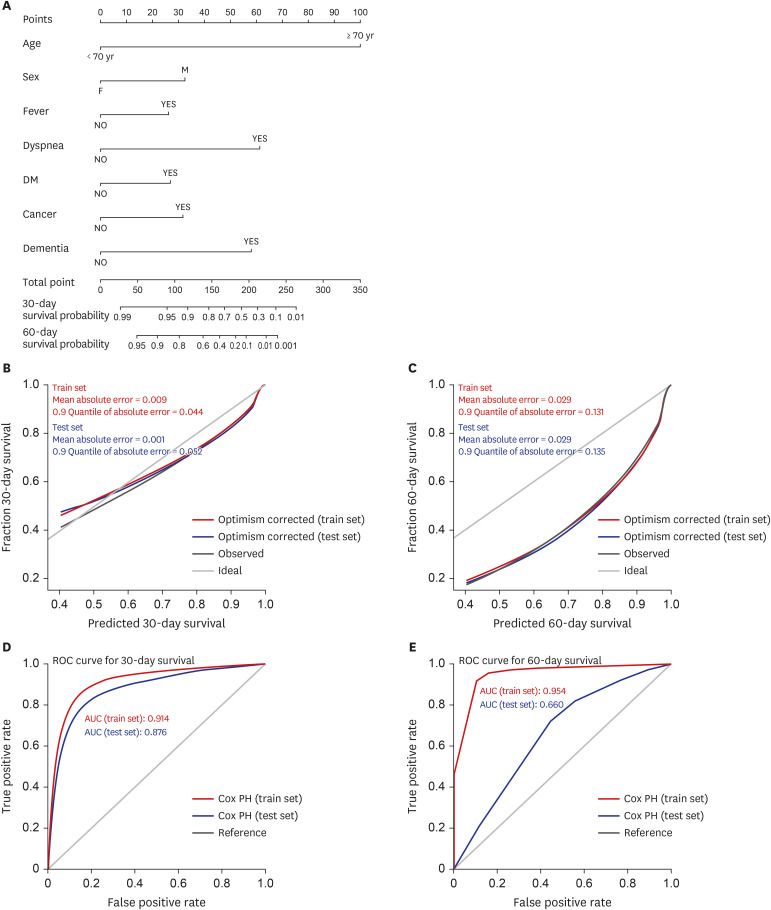
Age ≥ 70 years, male, presence of fever and dyspnea at the time of COVID-19 diagnosis, and diabetes mellitus, cancer, or dementia as underling diseases were significantly related to 30-day and 60-day survival and mortality in COVID-19 patients. The nomogram showed good calibration for survival probabilities and mortality. In the train set, the areas under the curve (AUCs) for 30-day and 60-day survival was 0.914 and 0.954, respectively; the AUC for mortality of 0.959. In the test set, AUCs for 30-day and 60-day survival was 0.876 and 0.660, respectively, and that for mortality was 0.926. The online calculators can be found at https://koreastat.shinyapps.io/RiskofCOVID19/.

Conclusion

The prediction model could accurately predict COVID-19-related mortality; thus, it would be helpful for identifying the risk of mortality and establishing medical policies during the pandemic to improve the clinical outcomes.

Graphical Abstract

jkms-36-e248-abf001.jpg

INTRODUCTION

Since December 2019, coronavirus disease 2019 (COVID-19) has spread worldwide, without decreasing trend. While 80% of COVID-19 patients have a mild clinical course,1 an unexpected increase in the number of deaths related to COVID-19 have resulted in an overwhelming medical burden in some areas. The ongoing pandemic has generated serious socioeconomic and healthcare problems due to the high mortality, especially in high-risk groups, and large number of patients in areas with limited medical resources. The overwhelming number of patients with COVID-19 infection combined with high-risk individuals for mortality makes it difficult to control the COVID-19 pandemic. Therefore, prediction of individualized risks for COVID-19 mortality is essential for estimating the severity of the clinical course of the disease. This would help in classifying the high-risk groups, which would help improve survival rates related with COVID-19.
COVID-19 mortality varies across countries ranging 1.4–4.3%, but the number of deaths due to COVID-19 is higher than that due to other respiratory viral infections, such as seasonal influenza.2345 The individualized prediction of COVID-19-related mortality is important for prioritizing patients with a high risk of mortality in terms of the allocation of limited medical resources.
Previous studies on the estimation of severity and mortality of COVID-19 showed diverse results, with the identification of a limited number of predictors, such as age and sex.678910 Age and underlying diseases are known factors associated with higher risks of mortality in patients with COVID-19,2671112 which is partially related with increased severity and susceptibility to COVID-19.1314 However, heterogeneity in age and underlying diseases could affect COVID-19-related mortality, and therefore, findings from previous studies were inconclusive.2689 In other studies, laboratory or radiologic findings were included in the factors predicting severity or mortality associated with COVID-19.1516171819 However, data on these factors are available for a limited number of COVID-19 patients in clinical settings and it takes time to obtain the results of laboratory and radiological examinations, thereby delaying the prediction of mortality and severity in patients with COVID-19.
In this study, we investigated the baseline characteristics of patients with COVID-19 and developed nomograms for predicting the probabilities of COVID-19-related mortality and 30-day and 60-day survival using data obtained at the time of admission, including individual's underlying diseases.

METHODS

Study population

The present study enrolled 5,626 confirmed cases of COVID-19 from the nationwide multicenter study between February 1 and April 30, 2020. During the study period, all confirmed cases of COVID-19 in South Korea were included since all patients were hospitalized regardless of their clinical presentation. Patients were followed-up until the end of their hospital stay. During the hospital stay, all patients were monitored by the Korea Disease Control & Prevention Agency of the National Medical Center; the database of information on patients with COVID-19 could be obtained from this agency. COVID-19 was confirmed via real-time reverse transcription-polymerase chain reaction assays using nasal and pharyngeal swab samples in accordance with the World Health Organization guidelines.2021 Data on baseline characteristics, such as age, sex, date of death, symptoms at the time of admission due to COVID-19, underlying diseases, and clinical severity were obtained retrospectively and anonymously under the leadership of the Central Disease Control Headquarters of South Korea. Height and weight of each patient were measured at the time of admission for treatment of COVID-19. Information on underlying diseases was collected by the doctors at the time of admission, by questioning the patients regarding the presence or history of any underlying disease.

Available items

Data on baseline characteristics, such as age, sex, height, and weight were obtained at the time of admission. Data on age were obtained in the form of age groups, using intervals of 10 years, but not individual age. Body mass index (BMI, kg/m2) were calculated using each patient' height and weight due to the significant effect of BMI on health outcome in patients with COVID-19.22 Clinical manifestations at the time of admission included fever, defined as a body temperature of > 37.5°C; cough; sputum; sore throat; rhinorrhea; myalgia; fatigue; dyspnea; headache; altered consciousness; vomiting/nausea; and diarrhea. Underlying diseases included diabetes mellitus (DM), hypertension, heart failure, cardiovascular diseases, asthma, chronic obstructive pulmonary disease (COPD), chronic kidney disease, cancer, chronic liver disease, rheumatoid/autoimmune disease, and dementia. The severity of COVID-19 was classified as mild, moderate, or severe as follows; mild, no interference with daily life or interference with daily life but no need for oxygen therapy during illness; moderate, requirement of oxygen via diverse routes (use of nasal cannula, oxygen mask, or non-invasive ventilator care); and severe, application of invasive ventilator care, multi-organ failure/ECMO use, or death.

Statistical analysis

Chi-square or Fisher's exact tests were performed to test the association between two nominal variables. Continuous variables were compared using the t-test or Welch t-test. The Mantel-Haenszel χ2 test was used to test the correlation between two ordinal variables or between dichotomous and ordinal variables.
From the total population, 4,426 patients were included in the prediction model after excluding 1,200 patients with any missing information on the variables. The mortality rate of the excluded patients was 9.42% (n = 113). Logistic regression analyses and a Cox proportional hazards models were used to construct a well-calibrated and discriminative nomogram for predicting mortality as well as 30-day and 60-day survival probabilities.
Cox proportional hazard equation applied in the present study was as follows:
S(t) = S0(t)exp(χβ)
χβ = 2.58 × age + 0.84 × sex + 0.67 × fever + 1.58 × dyspnea + 0.69 × DM + 0.82 × cancer + 1.49 × dementia
t = 30, S0(t) = 0.995
t = 60, S0(t) = 0.985
age=0,<70years1,70years,sex=0,female1,male,fever=0,no1,yes,dyspnea=0,no1,yes,DM=0,no1,yes,cancer=0,no1,yes,dementia=0,no1,yesjkms-36-e248-e001.jpg
Logistic regression model applied in the present study was as follows:
P=exp(χβ)1+exp(χβ)jkms-36-e248-e002.jpg
χβ = −7.05 + 2.81 × age + 1.08 × sex + 0.97 × fever + 2.14 × dyspnea + 1.17 × DM + 1.38 × cancer + 2.12 × dementia
age=0,<70years1,70years,sex=0,female1,male,fever=0,no1,yes,dyspnea=0,no1,yes,DM=0,no1,yes,cancer=0,no1,yes,dementia=0,no1,yesjkms-36-e248-e001.jpg
To validate the models, the total population was randomized into the train and test sets at a ratio of 7:3. The balance between the two sets was checked using through the χ2 test, and no significant differences were observed in all variables. To construct the logistic regression model, we obtained crude odds ratios (ORs) via univariate logistic regression analysis of the train set. We constructed a multivariate logistic model by including variables with P values < 0.2 in the univariate analysis and those with the lowest Akaike information criterion using the backward stepwise approach.23 Finally, we obtained the final prediction model after extracting insignificant variables. The validation of the logistic regression model was checked by the calibration curve and area under the curve (AUC) in the test set. The same approach was used for the construction of a Cox proportional hazards model. The validation of the Cox proportional hazards model was checked using Harrell's C-index, time dependent AUCs, and calibration curves. The constructed models can be used on the web-based risk calculator (https://koreastat.shinyapps.io/RiskofCOVID19/).
Overall, statistical analyses were performed using the R programming language and environment version 4.0.2 (R Foundation for Statistical Computing, Vienna, Austria). P values < 0.05 was considered statistically significant.

Ethics statement

This study was approved by the Institutional Review Board (IRB) of Chonnam National University Hospital (IRB No. CNUH-2020-303) and the Korea Disease Control and Prevention Agency. The need for informed consent was waived due to the retrospective nature of the study.

RESULTS

Baseline characteristics of the study population

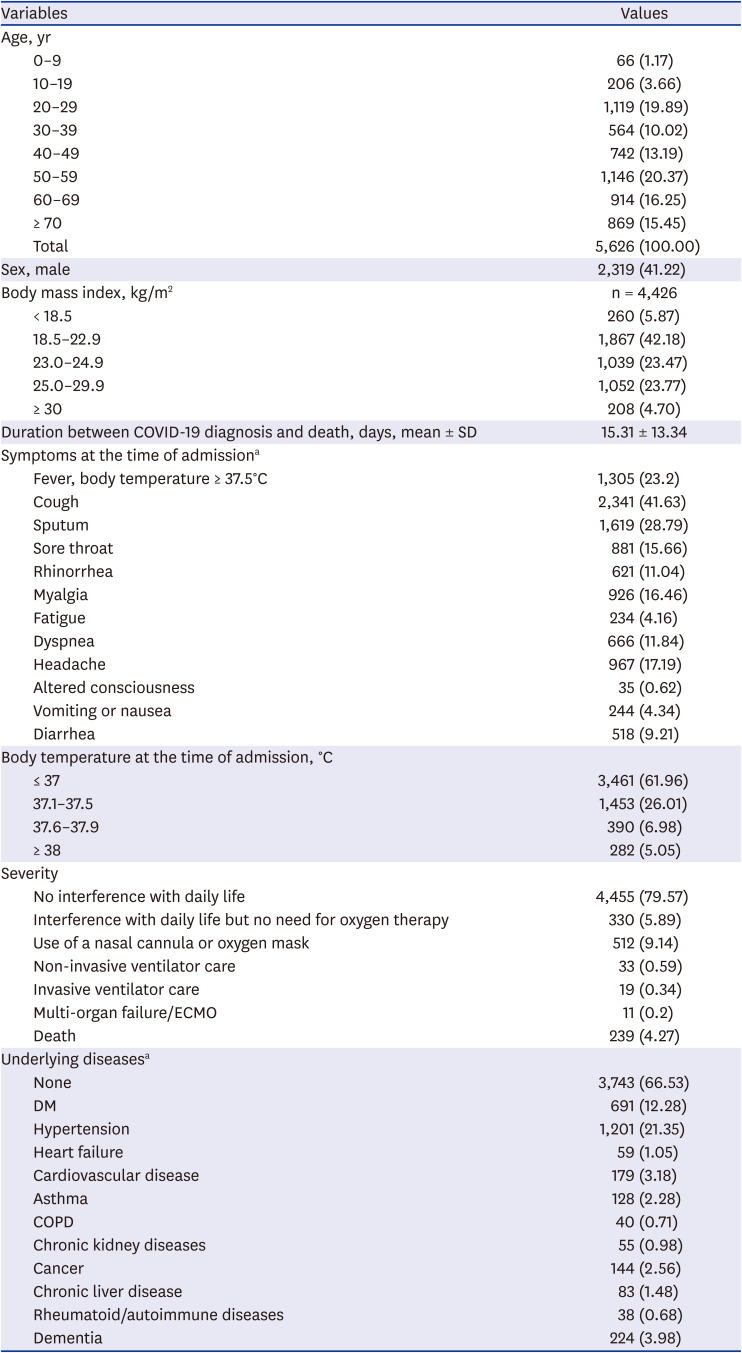
The present study included 5,626 confirmed COVID-19 cases. Table 1 describes the baseline characteristics of the study population: 2,319 (41.22%) patients were male; 15.45% patients were older than 70 years, and 33.47% patients had at least one underlying disease. With respect to underlying diseases, the prevalence of hypertension was the highest (21.35%), followed by that of DM (12.28%) and dementia (3.98%). The mortality rate of COVID-19 was 4.27% in this study.
Table 1

Baseline characteristics of the study population

jkms-36-e248-i001
Variables Values
Age, yr
0–9 66 (1.17)
10–19 206 (3.66)
20–29 1,119 (19.89)
30–39 564 (10.02)
40–49 742 (13.19)
50–59 1,146 (20.37)
60–69 914 (16.25)
≥ 70 869 (15.45)
Total 5,626 (100.00)
Sex, male 2,319 (41.22)
Body mass index, kg/m2 n = 4,426
< 18.5 260 (5.87)
18.5–22.9 1,867 (42.18)
23.0–24.9 1,039 (23.47)
25.0–29.9 1,052 (23.77)
≥ 30 208 (4.70)
Duration between COVID-19 diagnosis and death, days, mean ± SD 15.31 ± 13.34
Symptoms at the time of admissiona
Fever, body temperature ≥ 37.5°C 1,305 (23.2)
Cough 2,341 (41.63)
Sputum 1,619 (28.79)
Sore throat 881 (15.66)
Rhinorrhea 621 (11.04)
Myalgia 926 (16.46)
Fatigue 234 (4.16)
Dyspnea 666 (11.84)
Headache 967 (17.19)
Altered consciousness 35 (0.62)
Vomiting or nausea 244 (4.34)
Diarrhea 518 (9.21)
Body temperature at the time of admission, °C
≤ 37 3,461 (61.96)
37.1–37.5 1,453 (26.01)
37.6–37.9 390 (6.98)
≥ 38 282 (5.05)
Severity
No interference with daily life 4,455 (79.57)
Interference with daily life but no need for oxygen therapy 330 (5.89)
Use of a nasal cannula or oxygen mask 512 (9.14)
Non-invasive ventilator care 33 (0.59)
Invasive ventilator care 19 (0.34)
Multi-organ failure/ECMO 11 (0.2)
Death 239 (4.27)
Underlying diseasesa
None 3,743 (66.53)
DM 691 (12.28)
Hypertension 1,201 (21.35)
Heart failure 59 (1.05)
Cardiovascular disease 179 (3.18)
Asthma 128 (2.28)
COPD 40 (0.71)
Chronic kidney diseases 55 (0.98)
Cancer 144 (2.56)
Chronic liver disease 83 (1.48)
Rheumatoid/autoimmune diseases 38 (0.68)
Dementia 224 (3.98)
Values are presented as number (%).
COVID-19 = coronavirus disease 2019, SD = standard deviation, ECMO = extracorporeal membrane oxygenation, DM = diabetes mellitus, COPD = chronic obstructive pulmonary disease.
aMultiple responses.

Symptoms at the time of COVID-19 diagnosis

The most common symptom of COVID-19 was cough (22.60%) in all age groups, followed by sputum (15.63%), except among those in the 0–9 years group (Supplementary Table 1). Fever was more common in children (18.84% in the 0–9 years group vs. 13.26%–15.64% in other groups), whereas dyspnea was more common in the elderly, especially in those older than 70 years (14.42% in the older than 70 years group vs. 1.45–8.09% in other groups).

Severity of COVID-19 according to underlying diseases

The prevalence of severe COVID-19 was the highest in patients with dementia (33.93%), followed by those with heart failure (33.90%) and chronic kidney disease (32.73%) (Supplementary Table 2). Similar to the prevalence of severe COVID-19, COVID-19-related mortality was the highest in patients with dementia (33.48%) (Supplementary Table 3).

Severity of COVID-19 according to age and sex

There was linear correlation between age and COVID-19 severity (Supplementary Table 4). The prevalence of severe COVID-19 was the highest in elderly people, especially those aged over 70 years.

Prevalence of underlying diseases according to age groups

The prevalence of some underlying diseases, such as hypertension, dementia, and cancer, was the highest in individuals older than 70 years (Supplementary Table 5), whereas that of rheumatoid or autoimmune diseases was the highest in patients aged 50–59 years.

Factors associated with COVID-19-related mortality

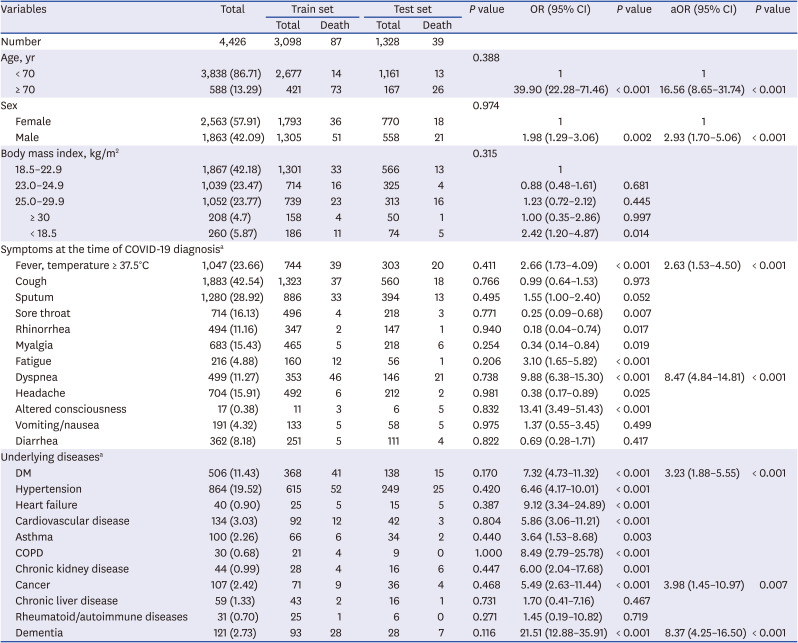
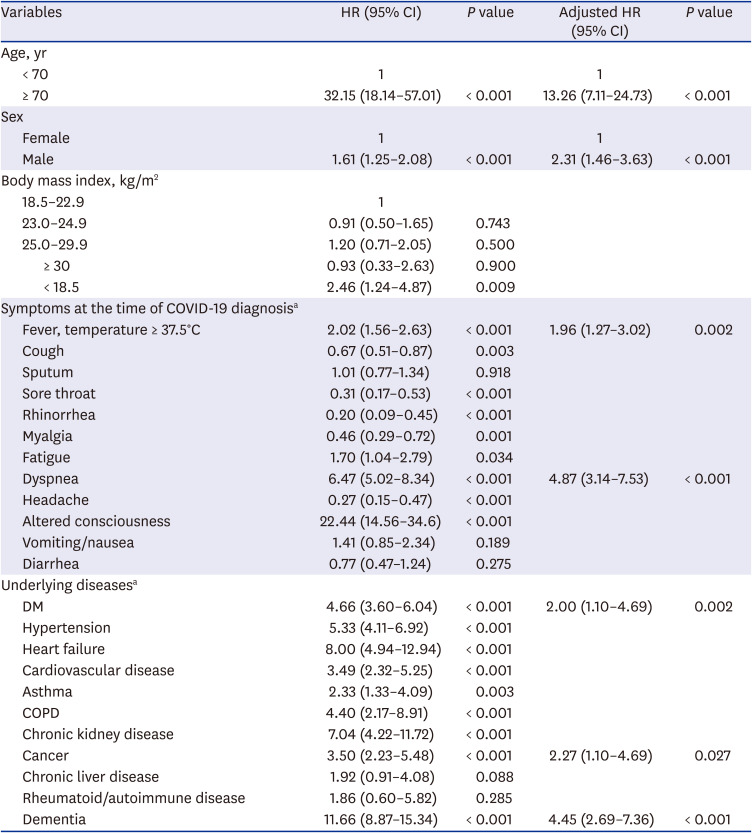
To identify potential factors that could predict COVID-19-related mortality, univariate and multivariate logistic regression analyses were performed, as indicated in Table 2. The following factors showed significant associations with COVID-19-related mortality: age ≥ 70 years; male; the presence of fever and dyspnea at the time of diagnosis; and underlying diseases such as DM, cancer, and dementia. The same predictive factors were identified in the final Cox proportional hazard model for 30-day and 60-day survival in patients with COVID-19 (Table 3).
Table 2

ORs for factors associated with COVID-19-related mortality

jkms-36-e248-i002
Variables Total Train set Test set P value OR (95% CI) P value aOR (95% CI) P value
Total Death Total Death
Number 4,426 3,098 87 1,328 39
Age, yr 0.388
< 70 3,838 (86.71) 2,677 14 1,161 13 1 1
≥ 70 588 (13.29) 421 73 167 26 39.90 (22.28–71.46) < 0.001 16.56 (8.65–31.74) < 0.001
Sex 0.974
Female 2,563 (57.91) 1,793 36 770 18 1 1
Male 1,863 (42.09) 1,305 51 558 21 1.98 (1.29–3.06) 0.002 2.93 (1.70–5.06) < 0.001
Body mass index, kg/m2 0.315
18.5–22.9 1,867 (42.18) 1,301 33 566 13 1
23.0–24.9 1,039 (23.47) 714 16 325 4 0.88 (0.48–1.61) 0.681
25.0–29.9 1,052 (23.77) 739 23 313 16 1.23 (0.72–2.12) 0.445
≥ 30 208 (4.7) 158 4 50 1 1.00 (0.35–2.86) 0.997
< 18.5 260 (5.87) 186 11 74 5 2.42 (1.20–4.87) 0.014
Symptoms at the time of COVID-19 diagnosisa
Fever, temperature ≥ 37.5°C 1,047 (23.66) 744 39 303 20 0.411 2.66 (1.73–4.09) < 0.001 2.63 (1.53–4.50) < 0.001
Cough 1,883 (42.54) 1,323 37 560 18 0.766 0.99 (0.64–1.53) 0.973
Sputum 1,280 (28.92) 886 33 394 13 0.495 1.55 (1.00–2.40) 0.052
Sore throat 714 (16.13) 496 4 218 3 0.771 0.25 (0.09–0.68) 0.007
Rhinorrhea 494 (11.16) 347 2 147 1 0.940 0.18 (0.04–0.74) 0.017
Myalgia 683 (15.43) 465 5 218 6 0.254 0.34 (0.14–0.84) 0.019
Fatigue 216 (4.88) 160 12 56 1 0.206 3.10 (1.65–5.82) < 0.001
Dyspnea 499 (11.27) 353 46 146 21 0.738 9.88 (6.38–15.30) < 0.001 8.47 (4.84–14.81) < 0.001
Headache 704 (15.91) 492 6 212 2 0.981 0.38 (0.17–0.89) 0.025
Altered consciousness 17 (0.38) 11 3 6 5 0.832 13.41 (3.49–51.43) < 0.001
Vomiting/nausea 191 (4.32) 133 5 58 5 0.975 1.37 (0.55–3.45) 0.499
Diarrhea 362 (8.18) 251 5 111 4 0.822 0.69 (0.28–1.71) 0.417
Underlying diseasesa
DM 506 (11.43) 368 41 138 15 0.170 7.32 (4.73–11.32) < 0.001 3.23 (1.88–5.55) < 0.001
Hypertension 864 (19.52) 615 52 249 25 0.420 6.46 (4.17–10.01) < 0.001
Heart failure 40 (0.90) 25 5 15 5 0.387 9.12 (3.34–24.89) < 0.001
Cardiovascular disease 134 (3.03) 92 12 42 3 0.804 5.86 (3.06–11.21) < 0.001
Asthma 100 (2.26) 66 6 34 2 0.440 3.64 (1.53–8.68) 0.003
COPD 30 (0.68) 21 4 9 0 1.000 8.49 (2.79–25.78) < 0.001
Chronic kidney disease 44 (0.99) 28 4 16 6 0.447 6.00 (2.04–17.68) 0.001
Cancer 107 (2.42) 71 9 36 4 0.468 5.49 (2.63–11.44) < 0.001 3.98 (1.45–10.97) 0.007
Chronic liver disease 59 (1.33) 43 2 16 1 0.731 1.70 (0.41–7.16) 0.467
Rheumatoid/autoimmune diseases 31 (0.70) 25 1 6 0 0.271 1.45 (0.19–10.82) 0.719
Dementia 121 (2.73) 93 28 28 7 0.116 21.51 (12.88–35.91) < 0.001 8.37 (4.25–16.50) < 0.001
COVID-19 = coronavirus disease 2019, OR = odds ratio, CI = confidence interval, aOR = adjusted odds ratio, DM = diabetes mellitus, COPD = chronic obstructive pulmonary disease.
aMultiple responses.
Table 3

Hazard ratios for factors associated with coronavirus disease 2019-related mortality

jkms-36-e248-i003
Variables HR (95% CI) P value Adjusted HR (95% CI) P value
Age, yr
< 70 1 1
≥ 70 32.15 (18.14–57.01) < 0.001 13.26 (7.11–24.73) < 0.001
Sex
Female 1 1
Male 1.61 (1.25–2.08) < 0.001 2.31 (1.46–3.63) < 0.001
Body mass index, kg/m2
18.5–22.9 1
23.0–24.9 0.91 (0.50–1.65) 0.743
25.0–29.9 1.20 (0.71–2.05) 0.500
≥ 30 0.93 (0.33–2.63) 0.900
< 18.5 2.46 (1.24–4.87) 0.009
Symptoms at the time of COVID-19 diagnosisa
Fever, temperature ≥ 37.5°C 2.02 (1.56–2.63) < 0.001 1.96 (1.27–3.02) 0.002
Cough 0.67 (0.51–0.87) 0.003
Sputum 1.01 (0.77–1.34) 0.918
Sore throat 0.31 (0.17–0.53) < 0.001
Rhinorrhea 0.20 (0.09–0.45) < 0.001
Myalgia 0.46 (0.29–0.72) 0.001
Fatigue 1.70 (1.04–2.79) 0.034
Dyspnea 6.47 (5.02–8.34) < 0.001 4.87 (3.14–7.53) < 0.001
Headache 0.27 (0.15–0.47) < 0.001
Altered consciousness 22.44 (14.56–34.6) < 0.001
Vomiting/nausea 1.41 (0.85–2.34) 0.189
Diarrhea 0.77 (0.47–1.24) 0.275
Underlying diseasesa
DM 4.66 (3.60–6.04) < 0.001 2.00 (1.10–4.69) 0.002
Hypertension 5.33 (4.11–6.92) < 0.001
Heart failure 8.00 (4.94–12.94) < 0.001
Cardiovascular disease 3.49 (2.32–5.25) < 0.001
Asthma 2.33 (1.33–4.09) 0.003
COPD 4.40 (2.17–8.91) < 0.001
Chronic kidney disease 7.04 (4.22–11.72) < 0.001
Cancer 3.50 (2.23–5.48) < 0.001 2.27 (1.10–4.69) 0.027
Chronic liver disease 1.92 (0.91–4.08) 0.088
Rheumatoid/autoimmune disease 1.86 (0.60–5.82) 0.285
Dementia 11.66 (8.87–15.34) < 0.001 4.45 (2.69–7.36) < 0.001
HR = hazard ratio, CI = confidence interval, DM = diabetes mellitus, COPD = chronic obstructive pulmonary disease.
aMultiple responses

Construction of a nomogram for predicting mortality in patients with COVID-19

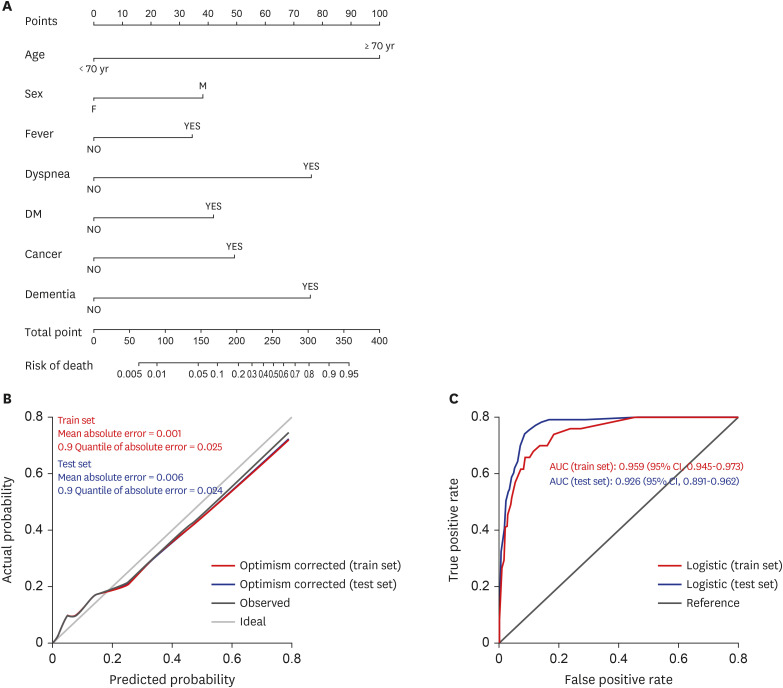
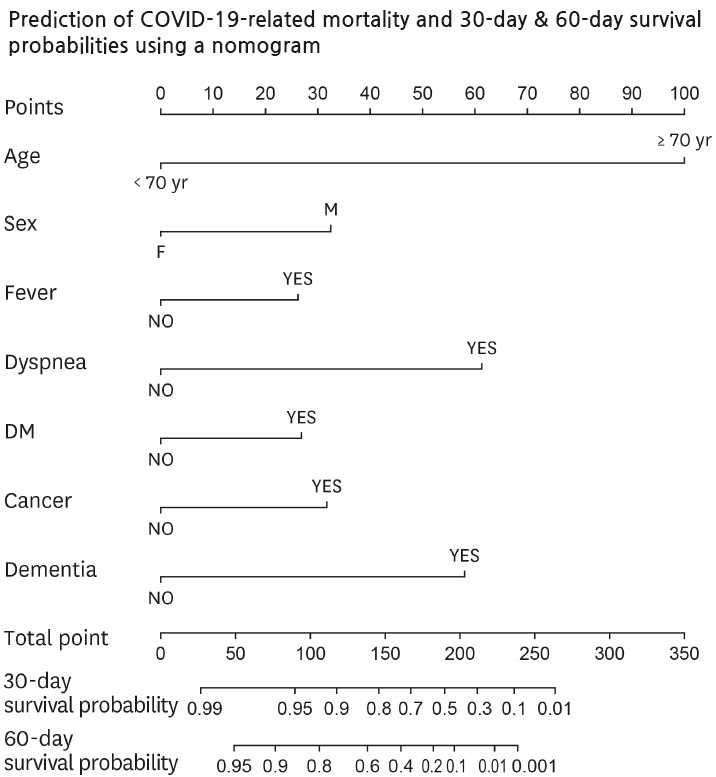
To identify high-risk patients, we constructed a predictive nomogram for mortality due to COVID-19 (Fig. 1). Points were assigned to patients based on age, sex, presence of specific symptoms including fever and dyspnea at the time of diagnosis of COVID-19, and the presence of specific underlying diseases (DM, cancer, and dementia), with a vertical line to the “Points” scale at the top of the nomogram (Fig. 1A). The actual and predicted mortalities due to COVID-19 were similar, and the calibration plot showed a mean absolute error of 0.006 (Fig. 1B), suggesting that the model was acceptable. Fig. 1C shows that the under the receiver operating curve (ROC) for COVID-19-related mortality was 0.926.
Fig. 1

Prediction of mortality in COVID-19 patients. (A) Nomogram for predicting mortality in patients with COVID-19. (B) Calibration plot of the actual and predicted probabilities in the train and test sets. (C) AUC of the nomogram is 0.959 (95% CI, 0.945–0.973) in the train set and 0.926 (95% CI, 0.891–0.962) in the test set.

COVID-19 = coronavirus disease 2019, AUC = the area under the curve, CI = confidence interval, DM = diabetes mellitus.
jkms-36-e248-g001

Construction of a nomogram to predict the 30-day and 60-day survival probabilities in patients with COVID-19

We constructed a predictive nomogram for 30-day and 60-day survival in patients with COVID-19 (Fig. 2A), including the same prognostic factors as those used in the model for COVID-19-related mortality. The nomogram demonstrated good accuracy for predicting 30-day and 60-day survival probabilities in patients with COVID-19 with a C-index of 0.906 (95% confidence interval, 0.883-0.929). Calibration curves indicated that there was no apparent shift from the perfect fit, with a good correlation between the predicted and observed values in the study population (Fig. 2B and C). The AUCs for 30-day and 60-day survival probability in patients with COVID-19 in the train set were 0.914 and 0.954, respectively (Fig. 2D and E). In the test set, the AUC for mortality was 0.926 (Fig. 1) and AUCs for 30-day and 60-day survival were 0.876 and 0.660, respectively (Fig. 2).
Fig. 2

Prediction of the 30-day and 60-day survival probabilities in COVID-19 patients. (A) Nomogram predicting the 30-day and 60-day survival probabilities in patients with COVID-19 in the train and test sets. Calibration plot of the actual and predicted probabilities for 30-day (B) and 60-day (C) survival in the train and test sets. The AUCs of the nomogram for predicting 30-day survival (D) and 60-day survival (E) in the train and test sets. DM = diabetes mellitus, ROC = receiver operating curve, AUC = area under the curve, COVID-19 = coronavirus disease 2019.

jkms-36-e248-g002

DISCUSSION

Even after a year post the emergence of COVID-19, severe cases of COVID-19 have caused socioeconomic and medical problems due to high mortality, especially in limited medical resource settings. Therefore, prediction of mortality early in the clinical course is essential in COVID-19 patients to stratify patients requiring intensive monitoring and aggressive therapy, thereby improving clinical outcomes. In the present study, we identified the predictive factors of COVID-19-related mortality using a nomogram that was validated using calibration plots and ROC curves. The prognostic factors included age ≥ 70 years; male sex; presence of fever and dyspnea at the time of COVID-19 diagnosis; and DM, cancer, and dementia as underlying diseases; these factors can be easily evaluated in the early phase of diagnosis without any additional tests. In addition, we investigated the factors associated with 30-day and 60-day survival in patients with COVID-19; the same prognostic factors were identified. Our findings can help guide policy makers on medical resource allocation in the uncontrolled COVID-19 epidemic era, thereby, improving public health outcomes. Our results would be more useful even in medium- or low- income countries with limited resources for diagnostic purposes.
Although various scoring systems can predict COVID-19-related mortality, we used a nomogram with calibration and discrimination for validation in this study, thereby enabling individualized and evidence-based risk estimation. Previous studies have suggested nomograms for predicting the risk of severe COVID-19 and COVID-19-related mortality using diverse laboratory findings, clinical features, and chest computed tomography (CT) findings.15161718192425 In the present study, we considered age, sex, body mass index, symptoms at the time of COVID-19 diagnosis, and underlying diseases for the prediction model as these parameters can be obtained in the early clinical course. This can be very helpful for identifying patients at risk of mortality at the time of COVID-19 diagnosis. In addition, the AUC for the prediction for COVID-19-related mortality in the present study was the highest compared to those in other previous studies, except for one that included chest CT findings as a predictive factor for severe COVID-19 (Supplementary Table 6). Significant laboratory markers, such as C-reactive protein, could be helpful for predicting the clinical course and outcomes of COVID-19 by reflecting the degree of inflammation.19 However, we did not include laboratory findings or imaging results as a limited number of patients underwent laboratory and imaging examinations in our study. Thus, our prediction model can be easily applied to predict the mortality of COVID-19 even in low- and middle-income countries.
Older age is known as a risk factor of COVID-19-related mortality, although the cut-off differs according to study populations.7826272829 Older age was identified to be a risk factor of a severe clinical course in other infections, including severe acute respiratory syndrome (SARS) and Middle East respiratory syndrome (MERS).3031 Similarly, in COVID-19, age was an independent prognostic factor for mortality and 30-day and 60-day survival. Older age can affect the clinical course of COVID-19 and COVID-19-related mortality, possibly through immunosenescence or a high prevalence of multiple underlying diseases.
Studies on the association of underlying disease with the severity and mortality of COVID-19 included various combinations of diseases, and therefore, these studies reported different results.3 Nevertheless, several underlying diseases, such as cancer, hypertension, and cardiovascular diseases, act as risk factors for severe COVID-19 or COVID-19-related mortality.21232 In COVID-19 patients with cancer, systemic immunosuppression associated with the cancer itself or anticancer therapy might affect the vulnerability to severe COVID-19 or COVID-19-related mortality, which is consistent with our findings. Diabetes, known to be a hazardous comorbidity in fatal COVID-19 cases, was also associated with COVID-19-related mortality in the present study. Although the reasons underlying this association have not been identified,2 persistent chronic inflammation in diabetes combined with poor control of blood glucose levels during the COVID-19 illness and combined comorbidities of diabetes in itself can affect the prognosis of COVID-19 in patients with diabetes.33 Some studies showed that patients with dementia, especially those living in care facilities, had an increased risk of COVID-19 and COVID-19-related mortality,343536 consistent with our findings. Living in care facilities favors the rapid spread of COVID-19 due to the increased likelihood of exposure to the virus in a closed environment, and furthermore, patients with dementia tend to have other underlying comorbidities. A meta-analysis of the association of underlying conditions with COVID-19-related mortality showed that previous studies on this topic included a limited number of underlying diseases and had limited sample sizes.2 In contrast, the present study included diverse underlying disease and used a nationwide registry of COVID-19 patients.
In the present study, the AUC for COVID19-related 30-day survival was excellent, whereas that for COVID-19-related 60-day survival was poor in the test set. These results might suggest that the prediction model based on age, sex, symptoms at the time of COVID-19 diagnosis, and underlying diseases would be appropriate for the prediction of COVID-19-related short-term survival. However, more delicate variables, reflecting clinical courses and laboratory findings, might be needed for better prediction of COVID-19-related long-term survival.
There are some limitations to our study. The sample size was considered to be limited because the study population was enrolled in the early period of the pandemic. However, previous studies on the prediction of COVID-19-related mortality/severity included smaller samples than that in our study (Supplementary Table 6).151617182537383940 Since the appropriate therapeutic strategies had not been established during the early epidemic of COVID-19, the mortality in the present study was less affected by medications, including anti-viral agents, that can affect the clinical course of COVID-19. The present study included patients from care hospitals where patients with dementia were hospitalized. The prevalence of dementia differs across study populations. One study reported a 7.5% prevalence,22 while some studies did not include dementia as one of the comorbidities of COVID-19.2 Since comorbidities are affected by herd infections in specific institutions, consideration of the specific situations on mass infection is needed while interpreting the results of related studies. Although AUCs for COVID19-related 30-day and 60-day survival in the train set were excellent, AUC for 60-day survival in the test set showed poor accuracy. Although we performed internal validation by classifying the total population into the train and test sets, external validation of the results is also needed to confirm our results. The variants of SARS-CoV-2 and COVID-19 vaccination status were not considered in the prediction model in the present study due to availability of limited information at the time of data collection. The prediction models for COVID-19-related mortality considering these factors can be developed after accumulation of sufficient information in the near future. The treatment strategies and clinical courses of COVID-19 prediction model were not included in the prediction model in the present study due to limitations in the available database. However, the results of the present study would be useful in predicting COVID-19-related mortality and in more efficient allocation of medical resources at an earlier stage. Finally, the present study was performed retrospectively, and therefore, validation using a prospective design is required to improve the statistical power of the results.
In conclusion, age ≥ 70 years, male sex, the presence of fever and dyspnea at the time of COVID-19 diagnosis, and DM, cancer, and dementia as underlying diseases are associated with an increased risk of COVID-19-related mortality, and these factors can be used for the prediction of 30-day and 60-day survival in COVID-19 patients. The results of the present study would be helpful in establishing therapeutic strategies for improving the clinical outcomes and guiding policy makers with regard to appropriate medical resource allocation.

Notes

Funding: This research was supported by Ilsung Research Award of Korean Academy Pediatric Allergy and Respiratory disease (2020).

Disclosure: The authors have no potential conflicts of interest to disclose.

Author Contributions:

  • Conceptualization: Moon HJ, Yang HJ, Lee E.

  • Data curation: Moon HJ, Kim KH, Kang EK, Yang HJ, Lee E.

  • Formal analysis: Moon HJ, Yang HJ, Lee E.

  • Methodology: Moon HJ, Yang HJ, Lee E.

  • Software: Moon HJ, Yang HJ, Lee E.

  • Validation: Moon HJ, Kim KH, Kang EK, Yang HJ, Lee E.

  • Investigation: Moon HJ, Kim KH, Kang EK, Yang HJ, Lee E.

  • Writing - original draft: Lee E.

  • Writing - review & editing: Moon HJ, Yang HJ, Lee E.

References

1. Wu Z, McGoogan JM. Characteristics of and important lessons from the coronavirus disease 2019 (COVID-19) outbreak in China: summary of a report of 72 314 cases from the Chinese Center for Disease Control and Prevention. JAMA. 2020; 323(13):1239–1242. PMID: 32091533.
2. Javanmardi F, Keshavarzi A, Akbari A, Emami A, Pirbonyeh N. Prevalence of underlying diseases in died cases of COVID-19: a systematic review and meta-analysis. PLoS One. 2020; 15(10):e0241265. PMID: 33095835.
crossref
3. Piroth L, Cottenet J, Mariet AS, Bonniaud P, Blot M, Tubert-Bitter P, et al. Comparison of the characteristics, morbidity, and mortality of COVID-19 and seasonal influenza: a nationwide, population-based retrospective cohort study. Lancet Respir Med. 2021; 9(3):251–259. PMID: 33341155.
crossref
4. Reiner Benaim A, Sobel JA, Almog R, Lugassy S, Ben Shabbat T, Johnson A, et al. Comparing COVID-19 and influenza presentation and trajectory. Front Med (Lausanne). 2021; 8:656405. PMID: 34055833.
crossref
5. Modi C, Böhm V, Ferraro S, Stein G, Seljak U. Estimating COVID-19 mortality in Italy early in the COVID-19 pandemic. Nat Commun. 2021; 12(1):2729. PMID: 33980836.
crossref
6. O'Driscoll M, Ribeiro Dos Santos G, Wang L, Cummings DA, Azman AS, Paireau J, et al. Age-specific mortality and immunity patterns of SARS-CoV-2. Nature. 2021; 590(7844):140–145. PMID: 33137809.
7. Banerjee A, Pasea L, Harris S, Gonzalez-Izquierdo A, Torralbo A, Shallcross L, et al. Estimating excess 1-year mortality associated with the COVID-19 pandemic according to underlying conditions and age: a population-based cohort study. Lancet. 2020; 395(10238):1715–1725. PMID: 32405103.
crossref
8. Mohamed MO, Gale CP, Kontopantelis E, Doran T, de Belder M, Asaria M, et al. Sex differences in mortality rates and underlying conditions for COVID-19 deaths in England and Wales. Mayo Clin Proc. 2020; 95(10):2110–2124. PMID: 33012342.
crossref
9. Omori R, Matsuyama R, Nakata Y. The age distribution of mortality from novel coronavirus disease (COVID-19) suggests no large difference of susceptibility by age. Sci Rep. 2020; 10(1):16642. PMID: 33024235.
crossref
10. Suh HJ, Lee E, Park SW. Clinical characteristics of COVID-19: risk factors for early oxygen requirement after hospitalization. J Korean Med Sci. 2021; 36(19):e139. PMID: 34002553.
crossref
11. Grasselli G, Zangrillo A, Zanella A, Antonelli M, Cabrini L, Castelli A, et al. Baseline characteristics and outcomes of 1591 patients infected with SARS-CoV-2 admitted to ICUs of the Lombardy Region, Italy. JAMA. 2020; 323(16):1574–1581. PMID: 32250385.
crossref
12. Bennett KE, Mullooly M, O'Loughlin M, Fitzgerald M, O'Donnell J, O'Connor L, et al. Underlying conditions and risk of hospitalisation, ICU admission and mortality among those with COVID-19 in Ireland: a national surveillance study. Lancet Reg Health Eur. 2021; 5:100097. PMID: 33880459.
crossref
13. De Larochelambert Q, Marc A, Antero J, Le Bourg E, Toussaint JF. Covid-19 mortality: a matter of vulnerability among nations facing limited margins of adaptation. Front Public Health. 2020; 8:604339. PMID: 33330343.
crossref
14. Jang SY, Seon JY, Eun BL, Koh SB, Yoo JH, Lee WY, et al. Risk factors of outcomes of COVID-19 patients in Korea: focus on early symptoms. J Korean Med Sci. 2021; 36(18):e132. PMID: 33975399.
crossref
15. Liu J, Liu Y, Xiang P, Pu L, Xiong H, Li C, et al. Neutrophil-to-lymphocyte ratio predicts critical illness patients with 2019 coronavirus disease in the early stage. J Transl Med. 2020; 18(1):206. PMID: 32434518.
crossref
16. Wu G, Yang P, Xie Y, Woodruff HC, Rao X, Guiot J, et al. Development of a clinical decision support system for severity risk prediction and triage of COVID-19 patients at hospital admission: an international multicentre study. Eur Respir J. 2020; 56(2):56.
17. Liu YP, Li GM, He J, Liu Y, Li M, Zhang R, et al. Combined use of the neutrophil-to-lymphocyte ratio and CRP to predict 7-day disease severity in 84 hospitalized patients with COVID-19 pneumonia: a retrospective cohort study. Ann Transl Med. 2020; 8(10):635. PMID: 32566572.
crossref
18. Yu Y, Wang X, Li M, Gu L, Xie Z, Gu W, et al. Nomogram to identify severe coronavirus disease 2019 (COVID-19) based on initial clinical and CT characteristics: a multi-center study. BMC Med Imaging. 2020; 20(1):111. PMID: 33008329.
crossref
19. Weng Z, Chen Q, Li S, Li H, Zhang Q, Lu S, et al. ANDC: an early warning score to predict mortality risk for patients with Coronavirus Disease 2019. J Transl Med. 2020; 18(1):328. PMID: 32867787.
crossref
20. Lee SW, Yang JM, Moon SY, Yoo IK, Ha EK, Kim SY, et al. Association between mental illness and COVID-19 susceptibility and clinical outcomes in South Korea: a nationwide cohort study. Lancet Psychiatry. 2020; 7(12):1025–1031. PMID: 32950066.
crossref
21. Yüce M, Filiztekin E, Özkaya KG. COVID-19 diagnosis - a review of current methods. Biosens Bioelectron. 2021; 172:112752. PMID: 33126180.
22. Du Y, Lv Y, Zha W, Zhou N, Hong X. Association of body mass index (BMI) with critical COVID-19 and in-hospital mortality: a dose-response meta-analysis. Metabolism. 2021; 117:154373. PMID: 32949592.
crossref
23. Heinze G, Dunkler D. Five myths about variable selection. Transpl Int. 2017; 30(1):6–10. PMID: 27896874.
crossref
24. Pan D, Cheng D, Cao Y, Hu C, Zou F, Yu W, et al. A predicting nomogram for mortality in patients with COVID-19. Front Public Health. 2020; 8:461. PMID: 32850612.
crossref
25. Zhou Y, He Y, Yang H, Yu H, Wang T, Chen Z, et al. Development and validation a nomogram for predicting the risk of severe COVID-19: a multi-center study in Sichuan, China. PLoS One. 2020; 15(5):e0233328. PMID: 32421703.
26. Yanez ND, Weiss NS, Romand JA, Treggiari MM. COVID-19 mortality risk for older men and women. BMC Public Health. 2020; 20(1):1742. PMID: 33213391.
crossref
27. Porcheddu R, Serra C, Kelvin D, Kelvin N, Rubino S. Similarity in case fatality rates (CFR) of COVID-19/SARS-COV-2 in Italy and China. J Infect Dev Ctries. 2020; 14(2):125–128. PMID: 32146445.
crossref
28. Perez-Saez J, Lauer SA, Kaiser L, Regard S, Delaporte E, Guessous I, et al. Serology-informed estimates of SARS-CoV-2 infection fatality risk in Geneva, Switzerland. Lancet Infect Dis. 2021; 21(4):e69–70. PMID: 32679085.
crossref
29. Owen RK, Conroy SP, Taub N, Jones W, Bryden D, Pareek M, et al. Comparing associations between frailty and mortality in hospitalised older adults with or without COVID-19 infection: a retrospective observational study using electronic health records. Age Ageing. 2021; 50(2):307–316. PMID: 32678866.
crossref
30. Chan JC, Tsui EL, Wong VC. Hospital Authority SARS Collaborative Group. Prognostication in severe acute respiratory syndrome: a retrospective time-course analysis of 1312 laboratory-confirmed patients in Hong Kong. Respirology. 2007; 12(4):531–542. PMID: 17587420.
crossref
31. Assiri A, Al-Tawfiq JA, Al-Rabeeah AA, Al-Rabiah FA, Al-Hajjar S, Al-Barrak A, et al. Epidemiological, demographic, and clinical characteristics of 47 cases of Middle East respiratory syndrome coronavirus disease from Saudi Arabia: a descriptive study. Lancet Infect Dis. 2013; 13(9):752–761. PMID: 23891402.
crossref
32. Liu C, Li L, Song K, Zhan ZY, Yao Y, Gong H, et al. A nomogram for predicting mortality in patients with COVID-19 and solid tumors: a multicenter retrospective cohort study. J Immunother Cancer. 2020; 8(2):8.
crossref
33. Yang JK, Lin SS, Ji XJ, Guo LM. Binding of SARS coronavirus to its receptor damages islets and causes acute diabetes. Acta Diabetol. 2010; 47(3):193–199. PMID: 19333547.
crossref
34. Matias-Guiu JA, Pytel V, Matías-Guiu J. Death rate due to COVID-19 in Alzheimer's disease and frontotemporal dementia. J Alzheimers Dis. 2020; 78(2):537–541. PMID: 33074240.
crossref
35. Vrillon A, Mhanna E, Aveneau C, Lebozec M, Grosset L, Nankam D, et al. COVID-19 in adults with dementia: clinical features and risk factors of mortality-a clinical cohort study on 125 patients. Alzheimers Res Ther. 2021; 13(1):77. PMID: 33838684.
crossref
36. Ghaffari M, Ansari H, Beladimoghadam N, Aghamiri SH, Haghighi M, Nabavi M, et al. Neurological features and outcome in COVID-19: dementia can predict severe disease. J Neurovirol. 2021; 27(1):86–93. PMID: 33417193.
crossref
37. Gong J, Ou J, Qiu X, Jie Y, Chen Y, Yuan L, et al. A tool for early prediction of severe coronavirus disease 2019 (COVID-19): a multicenter study using the risk nomogram in Wuhan and Guangdong, China. Clin Infect Dis. 2020; 71(15):833–840. PMID: 32296824.
crossref
38. Zeng F, Deng G, Cui Y, Zhang Y, Dai M, Chen L, et al. A predictive model for the severity of COVID-19 in elderly patients. Aging (Albany NY). 2020; 12(21):20982–20996. PMID: 33170150.
crossref
39. Cao G, Li P, Chen Y, Fang K, Chen B, Wang S, et al. A risk prediction model for evaluating the disease progression of COVID-19 pneumonia. Front Med (Lausanne). 2020; 7:556886. PMID: 33251226.
crossref
40. Acar HC, Can G, Karaali R, Börekçi Ş, Balkan II, Gemicioğlu B, et al. An easy-to-use nomogram for predicting in-hospital mortality risk in COVID-19: a retrospective cohort study in a university hospital. BMC Infect Dis. 2021; 21(1):148. PMID: 33546639.
crossref

SUPPLEMENTARY MATERIALS

Supplementary Table 1

Symptoms at the time of coronavirus disease 2019 diagnosis according to age groups
jkms-36-e248-s001.doc

Supplementary Table 2

Severity of coronavirus disease 2019 according to underlying diseases
jkms-36-e248-s002.doc

Supplementary Table 3

Severity of coronavirus disease 2019 according to underlying diseases
jkms-36-e248-s003.doc

Supplementary Table 4

Severity of coronavirus disease 2019 according to age and sex
jkms-36-e248-s004.doc

Supplementary Table 5

The prevalence of underlying diseases according to age groups
jkms-36-e248-s005.doc

Supplementary Table 6

Summary of the previous studies on the prediction of COVID-19 mortality and severe COVID-19
jkms-36-e248-s006.doc
TOOLS
Similar articles