

 PDF
PDF Citation
 Print
Print


INTRODUCTION
The global prevalence of diabetes mellitus (DM) is rapidly increasing. Currently, one in seven adults in Korea is affected by diabetes.12 The growing prevalence of type 2 DM (T2DM) is a major contributor to the increase in the population with diabetes. The occurrence of T2DM continues to rise in both the elderly and adolescent age groups.12 Over the past few decades, an increased understanding of T2DM pathophysiology has led to the development of anti-diabetic drugs (ADDs) with various mechanisms of action.3 Currently, six groups of oral hypoglycemic agents (OHAs) and two groups of injectables with different mechanisms of action are available in Korea. Recently developed drugs that target incretin hormones (dipeptidyl peptidase 4 [DPP-4] inhibitor and glucagon like peptide-1 receptor agonist [GLP-1 RA]) and renal glucose reabsorption (sodium and glucose co-transporter 2 [SGLT2] inhibitors) do not cause hypoglycemia or weight gain, and their positive effects on the risk of cardiovascular events are supported by the results of large clinical trials.45 Therefore, the treatment guidelines for T2DM are being revised based on the development of new drugs and accumulating evidence from the results of clinical trials.67 Despite the uniform treatment recommendations, various combinations of ADDs are prescribed in clinical practice. As such, analysis of treatment patterns of T2DM in real-world settings may facilitate improvements in actual diabetes management workflow and establish further management plans. Previous studies have reported drug utilization patterns in patients with DM89; however, the majority of these studies were conducted using health insurance data, which lacked crucial information such as glycemic control status and renal function, potentially affecting drug prescription. Furthermore, these studies did not include prescriptions not covered by health insurance.9
The Observational Health Data Sciences and Informatics (OHDSI) program is a global consortium established in 2008 to support medical data-based research. The OHDSI adopts a distributed research network with federated data harmonized to the Observational Medical Outcomes Partnership Common Data Model (OMOP-CDM), a unified database model that integrates various real-world data (RWD) sources, including electronic health records (EHRs), based on the same standards.10 CDM-based RWD is useful for uncovering various common treatment pathways or sequences.11 Recently, epidemiologic studies using CDMs have been conducted,121314 but few have applied these for diabetes research. In Korea, starting with the participation of the Department of Medical Informatics at Ajou University in the consortium in 2014,15 many hospital EHR data have now been converted to OMOP-CDM. Recently, the 30-year EHR data of our institution, Jeonbuk National University Hospital (JNUH), was converted to CDM. Therefore, the present study aimed to analyze treatment patterns of T2DM using a CDM-based RWD in a tertiary hospital.
METHODS
Study design and data sources
This was a retrospective, observational study that employed the EHR data of JNUH transformed into OMOP-CDM version 5.3. The data used in this study comprised medical records of patient visits from January 2000 to December 2019. In the CDM, various domains such as conditions (corresponding to diagnosis), drug exposure, and measurements including laboratory tests are modeled using standard vocabularies.7
Study population and data collection
We examined adult patients aged ≥ 18 years with T2DM from 2000 to 2019 among the JNUH-CDM dataset. A diagnosis of T2DM was defined as having a diagnostic code Korean Standard Classification (KCD)-7 for T2DM (E11-14) and meeting at least one of the following criteria: 1) glycosylated hemoglobin (HbA1c) ≥ 6.5%, 2) fasting serum glucose ≥ 126 mg/dL, and 3) ADD prescription more than once. Patients with type 1 DM or gestational DM were excluded. We conducted an annual trend analysis of ADD prescriptions for patients prescribed at least one ADD each year from 2000 to 2019. For patients prescribed more than one ADD a year, analysis was performed by including the data for each prescription pattern. ADDs were divided into six OHAs and two subcutaneous injections as follows: metformin, sulfonylurea (SU), thiazolidinediones (TZDs), alpha-glucosidase inhibitors (AGIs), DPP-4 inhibitors, SGLT-2 inhibitors, GLP-IRA, and insulin. Glinide drugs were analyzed by inclusion in the SU group. All drugs were classified according to the mechanism of action rather than active ingredients. We analyzed drug prescription patterns according to age, renal function, and HbA1c in patients with T2DM. As the estimated glomerular filtration rate (eGFR) values in the CDM dataset were only available after July 2013, they were analyzed based on outpatient medical records from 2013 to 2019. Patients with drug prescription records for < 2 years were excluded from the analysis. Patients were classified into age groups of 18–39, 40–79, and ≥ 80 years. To minimize factors other than age affecting drug selection, patients with GFR ≥ 60 mL/min/1.73 m2 and HbA1c < 9% were included. Drug prescription patterns were analyzed according to renal function by dividing patients into groups with eGFR ≥ 60, 30 ≤ eGFR < 60, and eGFR < 30. Also, considering the effect of hyperglycemia instead of renal function on drug selection, patients with HbA1c < 9% were examined. Finally, for patients with an eGFR ≥ 60, drug prescription patterns were analyzed by dividing patients into groups with HbA1c < 7.5%, 7.5% ≤ HbA1c < 9%, and HbA1c ≥ 9% based on the time they first received ADD. Further, we analyzed the annual glycemic control rate and incidence of severe hypoglycemia from 2000 to 2019. The glycemic control rate was analyzed by dividing patients into groups with HbA1c < 7%, 7% ≤ HbA1c < 9%, and HbA1c ≥ 9%. Severe hypoglycemia was defined as cases of hospital visits to the emergency room for treating a hypoglycemic episode.
Statistical methods
This study involved a descriptive summary analysis of data exploration and characterization using R version 4.0.3, with no specific assumptions; as such, no statistical analysis was performed. OHDSI’s open-source software is publicly available on the GitHerb repository (http://github.com/OHDSI/). Among them, ATLAS ver. 2.7.6 was used in the present study. Descriptive statistics (persons and percentages) by year for each subject corresponding to the data extracted using ATLAS were calculated. The analysis of drug prescription patterns according to patient characteristics was conducted using cohort pathway analysis in the ATLAS software. The goal of the treatment pathway analysis in the ATLAS software is to understand and sequence treatments in one or more cohorts of interest. In the present study, sunburst plots were generated. The center of each plot represents patients with diabetes initiating first-line therapy. The first ring in each sunburst plot depicts the proportion of patients in whom one type of first-line therapy was initiated defined by the event cohort. The second set of rings represents the second event cohort for patients. For certain event sequences, a patient may never have a second event cohort observed in the data; this proportion is represented by the gray portion of the ring.
RESULTS
Annual trends in the number of adult patients with T2DM from 2000 to 2019
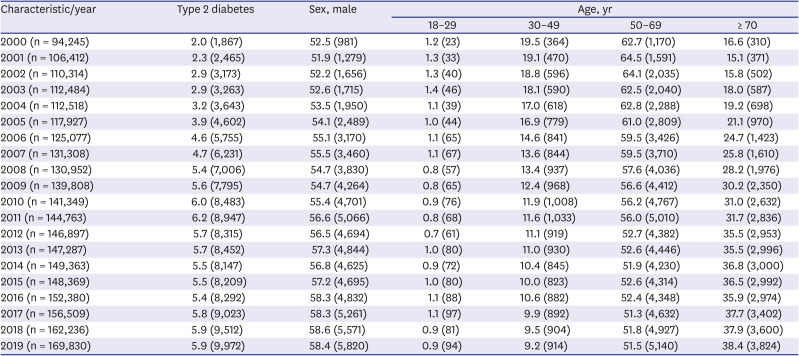
The OMOP-CDM at JNUH contains approximately 1.56 million patients. The number of adult patients treated for T2DM continuously increased from 1,867 (2.0%) in 2000 to 9,972 (5.9%) in 2019. The number of male patients with T2DM steadily increased from 981 (52.5%) in 2000 to 5,820 (58.4%) in 2019. The age group between 50 and 69 years exhibited the highest prevalence of T2DM across all years, and the age group between 30 and 49 years exhibited the second highest prevalence in the early 2000s. The number of patients with T2DM in the old age group (> 70 years) increased steadily from 310 (16.6%) in 2000 to 3,824 (38.4%) in 2019 (Table 1).
Table 1
Number of adult patients with type 2 diabetes from 2000 to 2019
Annual trends of ADD prescriptions from 2000 to 2019
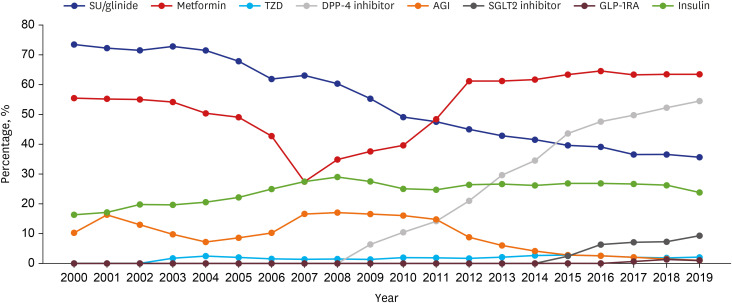
In total, 40,418 patients with T2DM were included in the analysis. Of them, 32,332 (80%) were receiving ADDs. In 2000, SU/glinide was the most commonly prescribed drug (73%), followed by metformin (55%). After 2011, metformin was the most commonly prescribed drug (64% in 2019), DPP-4 inhibitor prescription rates increased rapidly to 55%, and SU/glinide prescription rates decreased to 36% (Fig. 1). Insulin prescription rates increased steadily through 2008 (29% in 2008), followed by a slight decline. AGI was the third most commonly prescribed drug until 2010, after which prescription rates decreased steadily. Prescription rates for SGLT2 inhibitors increased gradually over the past few years. The number of GLP-1RA prescriptions was generally low, as GLP-1RA has only been available in our hospital since 2015.
Fig. 1
Time trends in drug prescriptions for type 2 diabetes from 2000 to 2019.
SU = sulfornylurea, TZD = thiazolidinedione, AGI = alpha-glucosidase inhibitor, GLP-1RA = glucagon like peptide-1 receptor agonist.
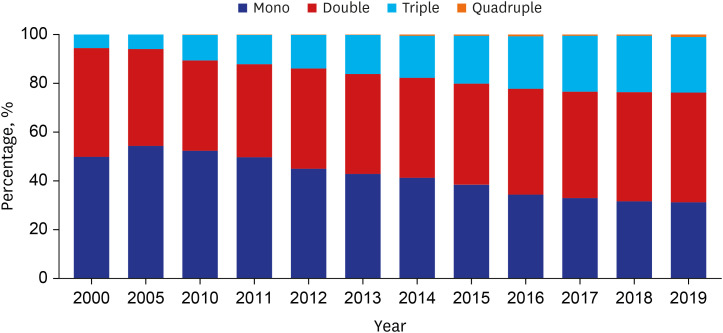
The trends of OHA combination therapy prescriptions for patients with T2DM were analyzed. Over time, monotherapy prescription rates decreased, whereas prescription rates for triple and quadruple combinations increased steadily (Fig. 2). Triple combination prescription rates increased from 5.69% to 22.84% over 20 years. No prescriptions for quadruple combinations of OHAs were noted prior to 2010, and quadruple combination prescription rates increased gradually to 1.01% with the beginning of prescriptions for DPP-4 and SGLT2 inhibitors in 2009 and 2014, respectively. In 2019, prescription rates for monotherapy, dual combinations, triple combinations, and quadruple combinations were 31%, 45%, 23%, and 1%, respectively. The most common dual combination was metformin + DPP4 inhibitor, the most common triple combination was metformin + DPP4 inhibitor + SU, and the most common quadruple combination was metformin + DPP-4 inhibitor + SU + TZD.
Fig. 2
Changes in patterns of combination therapy of oral hypoglycemic agents for type 2 diabetes from 2000 to 2019. Over time, the monotherapy prescription rates have decreased, whereas prescription rates for triple and quadruple combinations have increased steadily.
Mono = monotherapy, Double = dual combination therapy, Triple = triple combination therapy, Quadruple = quadruple combination therapy.
ADD prescription patterns according to age, renal function, and HbA1c
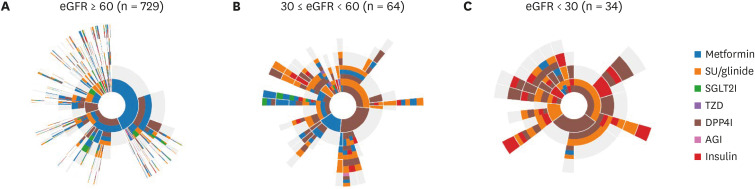
Treatment patterns according to age were analyzed for 729 patients: 39 patients in the 18–39-year age group, 672 patients in the 40–79-year age group, and 21 patients in the ≥ 80-year age group. In adult patients with T2DM with preserved renal function, the most common first-line treatment in all age groups was metformin monotherapy. DPP4 inhibitor and SU/glinide prescription rates were higher in the older group (≥ 80-year age), whereas insulin and SGLT2 inhibitor prescription rates were higher in the younger group (< 80-year age) for first-line therapy (Supplementary Fig. 1). Treatment patterns according to renal function were analyzed for 827 patients: 729 patients with eGFR ≥ 60 (group I), 64 patients with 30 ≤ eGFR < 60 (group II), and 34 patients with eGFR < 30 (group III). In group I, the most common first-line treatment was metformin monotherapy (43.3%), followed by metformin + DPP4 inhibitor (18.8%) (Fig. 3A). In group II, SU + DPP4 inhibitor was the most commonly prescribed treatment (26.6%), followed by DPP4 inhibitor (25%) and metformin (14.1%) monotherapy (Fig. 3B). In group III, SU + DPP4 inhibitor was the most commonly prescribed treatment (35.4%), followed by DPP4 inhibitor (29.4%) and SU (11.8%) monotherapy. As GFR decreased, the proportion of insulin prescriptions as the first or second prescription was higher than that before the decrease (Fig. 3C). The drug prescription pattern for the low HbA1c group (i.e., that with good glycemic control) was simple and did not change substantially, whereas the high HbA1c group exhibited frequent changes in drug combination patterns (Supplementary Fig. 2). In comparison to the low HbA1c group, in the high HbA1c group, the prescription of monotherapy as the first-line treatment decreased and that of initial combination therapy increased. However, despite the high blood glucose levels, insulin prescription rates were low. Only 5.6% of patients with HbA1c 7.5–9% and 15.6% of patients with HbA1c > 9% were treated with insulin-containing therapy as the first-line regimen.
Fig. 3
Anti-diabetic drug prescription patterns determined using a cohort pathway analysis in ATLAS software according to renal function for the period from 2013–2019. The center of each plot represents patients with diabetes initiating first-line therapy. The first ring in each sunburst plot depicts the proportion of patients in whom a type of first-line therapy was initiated defined by the event cohort. The second set of rings represents the second event cohort for patients. Patients with HbA1c < 9% were included in this analysis.
eGFR = estimated glomerular filtration rate, SU = sulfornylurea, TZD = thiazolidinedione, AGI = alpha-glucosidase inhibitor, GLP-1RA = Glucagon like peptide-1 receptor agonist, DPP4I = DPP4 inhibitor, SGLT2I = SGLT2 inhibitor.
Glycemic control rate and hypoglycemia
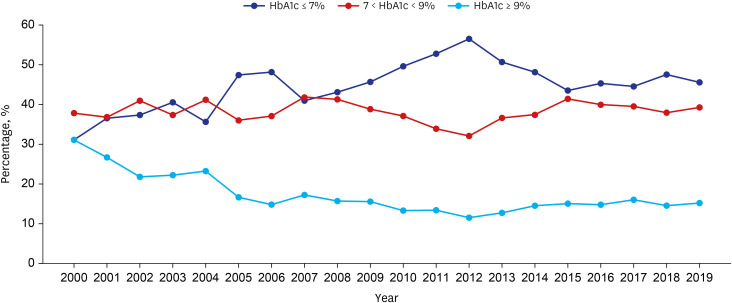
The proportion of patients with T2DM receiving HbA1c testing at least once a year increased from 55.3% in 2000 to 79.3% in 2019. The proportion of patients with HbA1c ≤ 7% increased from 31.1% in 2000 to 45.6% in 2019 (Fig. 4), while the proportion of patients with HbA1c ≥ 9% decreased from 31.1% to 15.3%. Approximately half of patients with T2DM still had HbA1c values above the target range. The number of patients who visited our emergency room for severe hypoglycemia was 335 (3.9%) in 2010 and 363 (4.0%) in 2019.
DISCUSSION
The present study reported epidemiologic statistics of EHR-based data transformed to OMOP-CDM of adult patients with T2DM over a 20-year period in a single, tertiary referral hospital. Our study demonstrated that the number of patients with T2DM increased steadily, and T2DM was more prevalent in older individuals and males than in their counterparts. Metformin was the most commonly prescribed drug over a 20-year period based on hospital data. Prescription patterns of ADDs significantly differed between periods before and after the availability of new drug prescriptions. Prior to DPP-4 and SGLT-2 inhibitors being available, SU was the most commonly prescribed drug. More recently, a rapid decline in SU prescription rates and rapid increase in those of DPP4 and SGLT-2 inhibitors were observed. This pattern is consistent with the diabetes fact sheet in Korea, which used data from the Korea National Health and Nutrition Survey and the National Health Insurance Service (NHIS).1 In contrast, insulin prescription rates were higher than those reported in national statistics1, which may reflect the characteristics of a tertiary referral hospital. Nevertheless, insulin prescription rates steadily increased until 2008 but declined slightly since then as more ADDs became available, and this trend is also observed in the diabetes fact sheet.16
With regard to OHA prescriptions, both stepwise patterns and initial combinations are possible based on clinical decisions and the baseline glycemic status.17 The task force team of the Korean Diabetes Association analyzed patterns of combination therapies of ADDs, including insulin, in Korea based on health insurance data from 2002 to 2013.6 In this study, monotherapy decreased, while dual and triple combination therapy increased. The most common dual combination was metformin + SU. However, in the 2016 analysis, the most common dual combination changed to metformin + DPP4 inhibitor,18 which is consistent with our analysis. In addition, we analyzed the quadruple combination therapy, and since 2010, the quadruple combination therapy has been steadily increasing. Quadruple combination of OHAs is not recommended in the guidelines67 and is not covered by health insurance, but prescription rates of quadruple combination therapy are increasing gradually because new drugs targeting different pathophysiological processes are being introduced in clinical practice. The various barriers to insulin therapy are also a major cause of passive insulin prescription and increased prescriptions of oral drug combinations.19 Recently, two retrospective real-world studies on the Korean population with T2DM reported the efficacy and safety of quadruple combination therapy.2021 These studies revealed the therapeutic efficacy and good safety profiles of quadruple oral therapy in Korean patients with uncontrolled T2DM. Combination therapy of various OHAs with or without injections is expected to increase gradually, and further studies are warranted to clarify the advantages and disadvantages of these treatments.
When prescribing ADDs for patients with T2DM, various patient factors and drug characteristics must be considered. A national survey of specialists and academic generalists regarding the approaches for selecting medications to treat T2DM revealed that physicians considered a wide range of qualitative and quantitative factors when selecting medications for hyperglycemia management.22 However, past treatment guidelines have been underscored by uniform recommendations.23 Recent drug development and clinical evidence have catalyzed changes in recommendations for drug selection according to patient and specific drug characteristics, such as glucose-lowering efficacy, cardiovascular benefits, hypoglycemia risk, and effects on body weight.67 Nevertheless, various other factors must be considered when prescribing ADDs. In this regard, we analyzed the drug prescription patterns for T2DM in our outpatient clinic according to age, renal function, and glycemic control status. In adult patients with T2DM with preserved renal function, metformin was the most commonly prescribed first-line drug in all age groups. DPP4 inhibitors and SU were more commonly prescribed in the older group, whereas SGLT2 inhibitors and insulin were more commonly prescribed in the younger age group. DPP4 inhibitors are thought to be more commonly prescribed for the older group owing to their low risk of inducing hypoglycemia and good safety profile.24 SGLT2 inhibitors have a potential risk of occurrence of ketoacidosis and urogenital infection;25 therefore, the prescription rate is relatively low in the elderly. Insulin is more difficult to use than OHAs and associated with a high risk of hypoglycemia. As such, it is less commonly prescribed for elderly patients. In contrast, the rate of SU prescriptions in the older age group was higher than that in the younger age groups. This may be the result of prescribing SU because insulin cannot be used even in hyperglycemia cases.
For patients with decreased renal function, the prescription rates for DPP4 inhibitors and insulin secretagogues increased, which could be because some of the drugs in these groups do not undergo renal metabolism and do not require dose adjustment according to renal function. In this study, it was not possible to confirm this because the analysis was conducted by drug category, not by ingredient. Metformin prescription rates tended to decrease with a decline in renal function; however, for patients with an eGFR ≥ 30 mL/min/1.73 m2, prescription rates were similar to those of patients with normal renal function in the present study. Owing to its substantial glucose-lowering effects, association with a relatively low risk of hypoglycemia, and favorable vascular outcomes, metformin has remained the first-line option following lifestyle changes and is currently the most important drug.726 Based on evidence regarding metformin use and its good safety profile, the U.S. Food and Drug Administration revised indications for the use of metformin in patients with chronic kidney disease (CKD) stage 3 in 2016.27 The Korean Diabetes Association and Korean Society of Nephrology recently published a consensus statement on metformin treatment for DM and CKD. Metformin can be used safely when the GFR > 45 mL/min/1.73 m2, should not be started if the GFR is 30–44 mL/min/1.73 m2, and is contraindicated if the GFR is < 30 mL/min/1.73 m2.28
The drug prescription patterns in the low HbA1c group were simple and did not change substantially, whereas frequent changes in the patterns of drug combinations were observed in the high HbA1c group. For newly diagnosed patients with T2DM who present with symptoms and marked hyperglycemia (HbA1c > 9%), initial insulin treatment is recommended in the guidelines.6 However, the insulin prescription rates were very low, and only 15.6% of patients with HbA1c > 9% were treated with insulin-containing therapy as the first-line regimen in our study.
The proportion of patients with T2DM receiving HbA1c testing at least once a year increased steadily owing to increased awareness of the utility of HbA1c as an index for glycemic control and its use as a diagnostic criterion for DM.2629 In addition, the number of patients who received regular HbA1c tests increased with the commencement of a diabetes medical adequacy evaluation project by the Korean Health Insurance Review and Assessment Service in 2010. In terms of glycemic control, despite the development of novel ADDs and practical testing of various combinations, T2DM management remains challenging. Indeed, only half of patients with DM are well controlled with HbA1c < 7%, and hypoglycemia remains an issue. In the most recently updated national statistics, the control rate of HbA1c < 7% in diagnosed diabetes was 51.2%, similar to the results of our study. Therefore, more effort is needed to improve glycemic control and reduce hypoglycemia.
This study has several strengths: 1) by conducting the study through an OMOP-CDM-based analysis, we have shown the potential for epidemiological studies of DM patients, especially hospital-based multicenter studies. 2) ADD combination therapies not covered by health insurance were included in this analysis; and 3) the drug prescription patterns were visualized according to patient characteristics such as age, renal function, and HbA1c levels. However, our study also has some limitations. First, this was a single-center retrospective study; thus, generalization of findings might be limited; further, retrospective data analysis has fundamental limitations. Second, demographic characteristics such as weight, body mass index, and duration of diabetes for each patient could not be evaluated in this study because they were not converted to our CDM. Third, we were unable to obtain clinical information on the adherence or side effects of ADDs in our analysis.
In conclusion, through analyzing the drug prescription patterns for patients with T2DM over a 20-year period, we identified that medication utilization patterns have changed significantly with an increase in the use of newer drugs and a shift to combination therapies. In addition, various prescription patterns were observed depending on the patient's age, renal function, and baseline HbA1c. Despite substantial changes and clinical efforts, improvements in glycemic control and hypoglycemia remain challenging. Further studies are needed on the effects of various ADDs on glycemic, along with a better understanding of the treatment patterns of T2DM.
 XML Download