INTRODUCTION
METHODS
Chemicals
Experimental protocol
Animal model
Study design
Measurement of gastric ulcerative lesions
Measurement of ulceration index
Measurement of pH and total acidity
Measurement of hemoglobin value
Measurement of pro-inflammatory cytokines
Measurement of lipid peroxidation activity
Measurement of superoxide dismutase enzymes (SOD) activity
Measurement of catalase (CAT) activity
Measurement of serum biochemical parameters
Measurement of histopathological analysis
Statistical evaluation
RESULTS
Effect of cirsilineol on the gastric ulcer markers in HCl/ethanol induced gastric ulcer rats
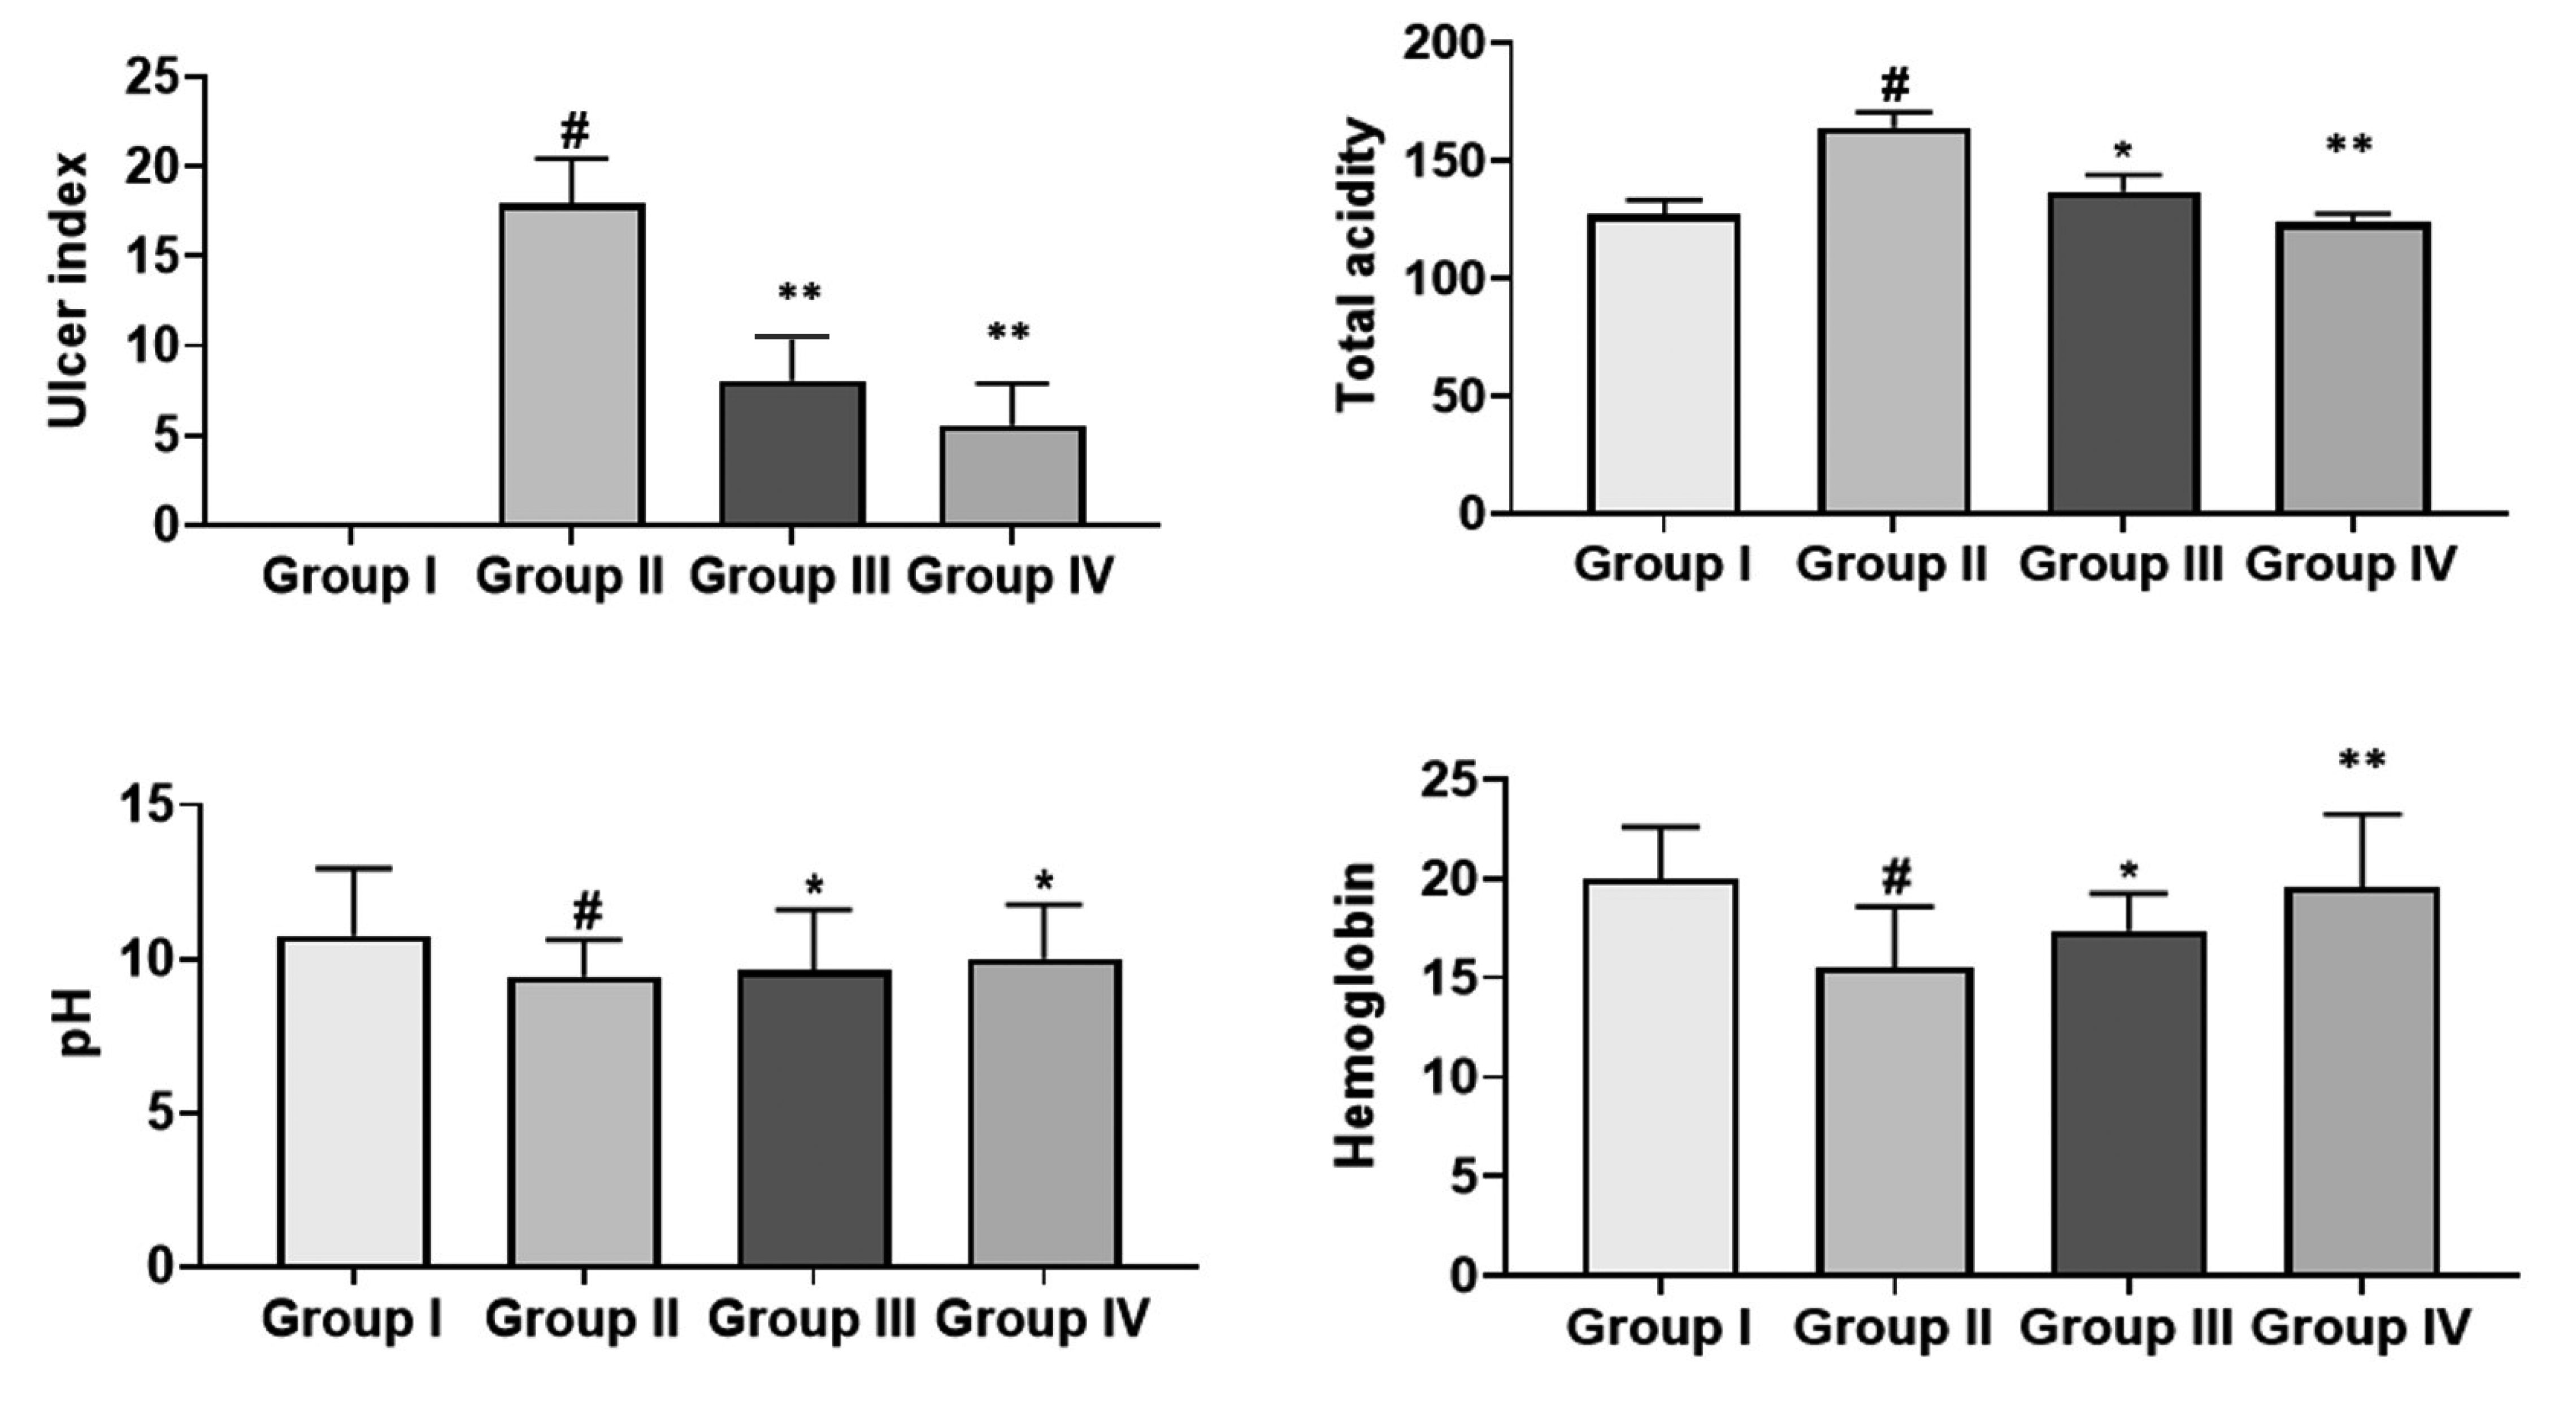 | Fig. 1The ulcer index scores and ulcer markers by cirsilineol treatment.Results were articulated as mean ± SEM from 6 individual rats. Group I: control rats, Group II: untreated hydrochloric acid (HCl)/ethanol rats, Group III: cirsilineol (20 mg/kg)-HCl/ethanol rats and Group IV: cirsilineol (40 mg/kg)-HCl/ethanol rats. #Significant difference by (p < 0.05) from Group I, *significant difference by (p < 0.05) from Group II, **significant difference by (p < 0.01) from Group II.
|
Effect of cirsilineol on the production of inflammatory mediators in HCl/ethanol induced gastric ulcer rats
 | Fig. 2The inflammatory cytokines (TNF-α, IL-1β, and IL-6) and anti-oxidative expression (SOD, CAT, and LPO) by cirsilineol treatment. Results were articulated as mean ± SEM by (p < 0.05) from 6 individual rats. Group I: control rats, Group II: untreated hydrochloric acid (HCl)/ethanol rats, Group III: cirsilineol (20 mg/kg)-HCl/ethanol rats and Group IV: cirsilineol (40 mg/kg)-HCl/ethanol rats. TNF-α, tumor necrosis factor alpha; IL-1β, interleukin-1 beta; IL-6, interleukin-6; SOD, superoxide dismutase; CAT, catalase; LPO, lipid peroxidation. #Significant difference by (p < 0.05) from Group I, *significant difference by (p < 0.05) from Group II, **significant difference by (p < 0.01) from Group II.
|
Effect of cirsilineol on the production of anti-oxidative expression in HCl/ethanol induced gastric ulcer rats
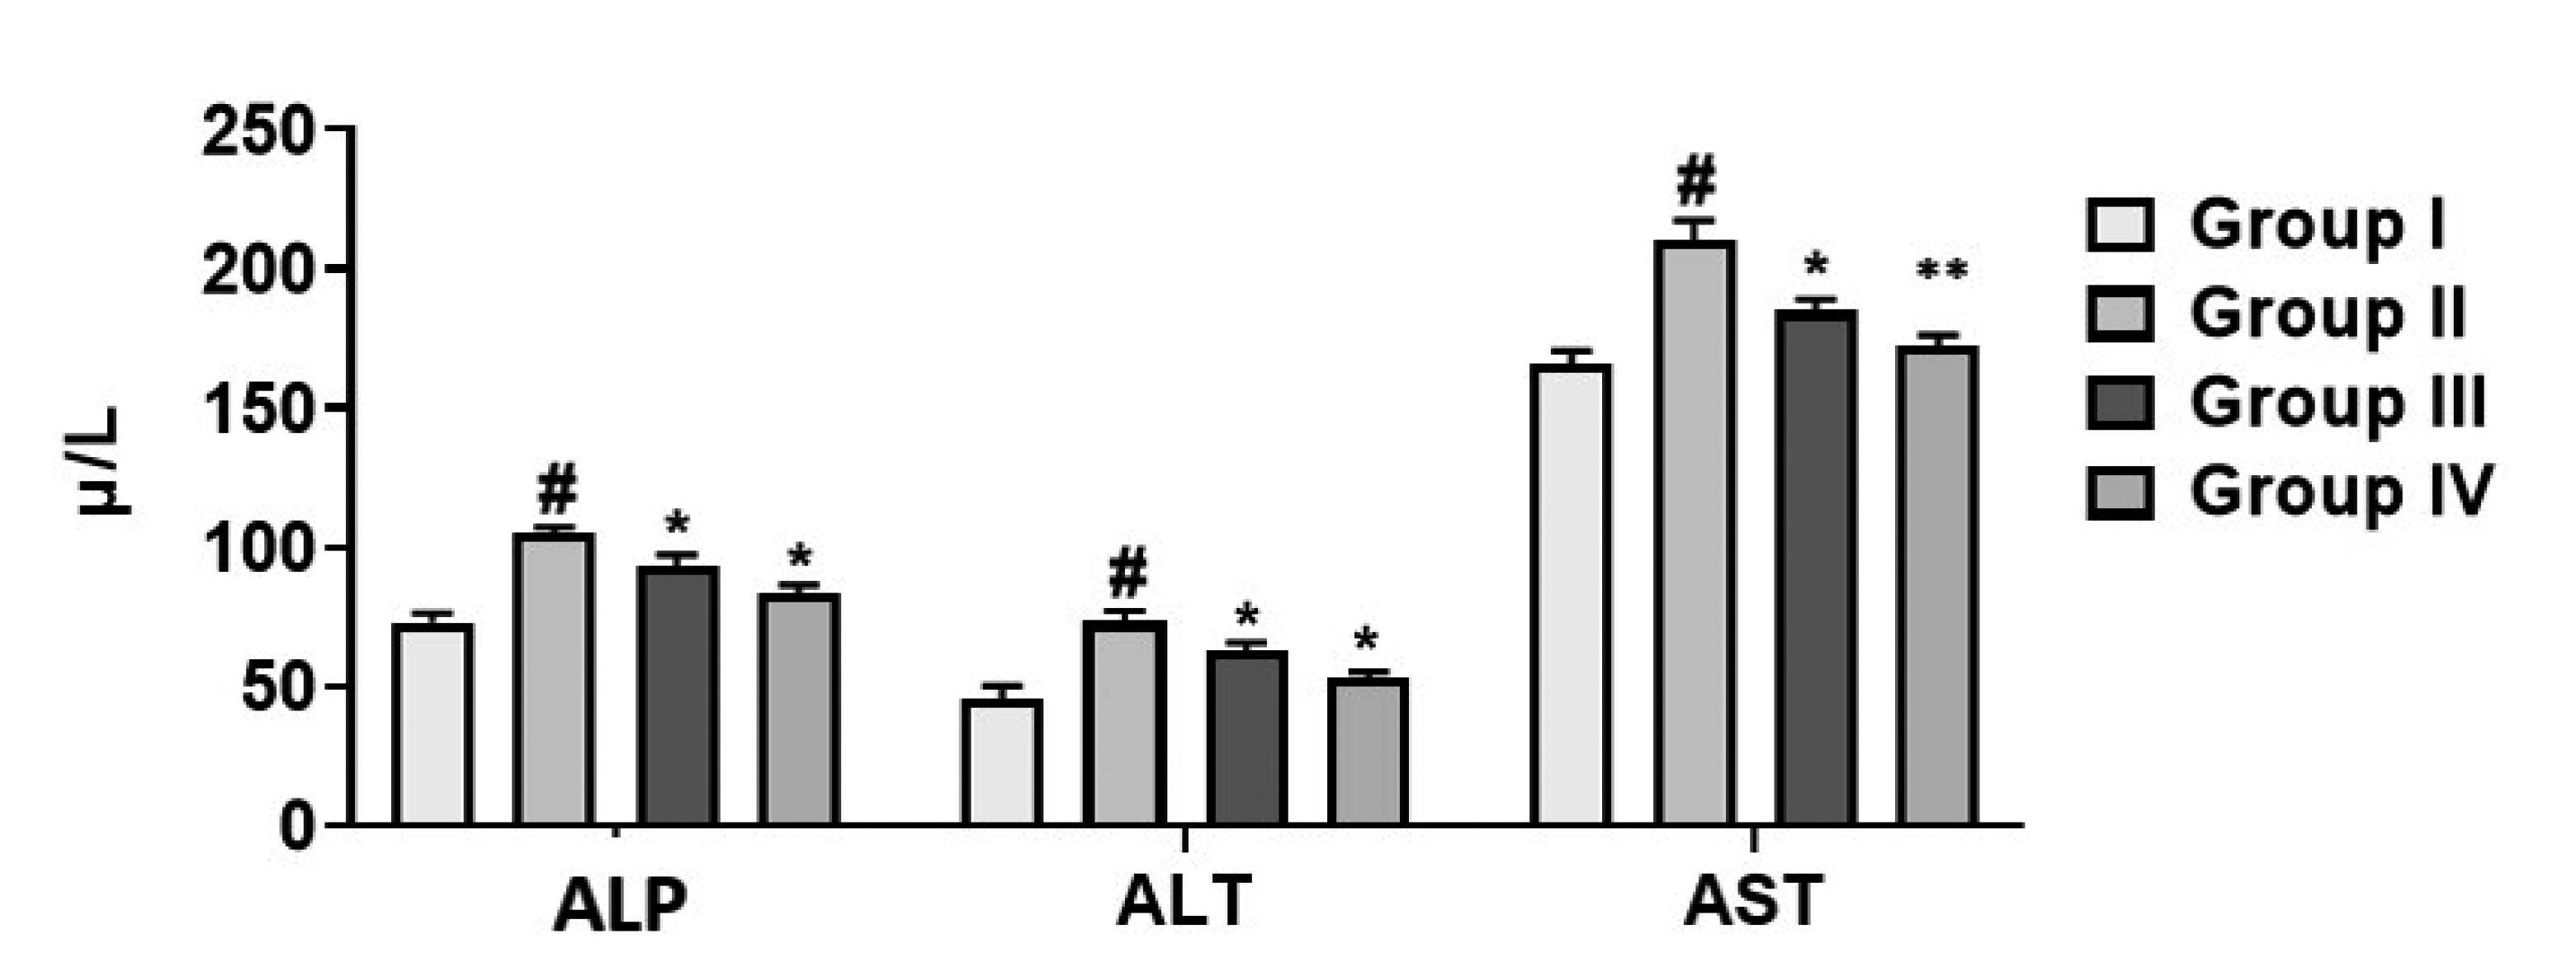
Effect of cirsilineol on the production of liver function enzymes in HCl/ethanol induced gastric ulcer rats
 | Fig. 3The liver function enzymes (ALP, ALT, and AST) by cirsilineol treatment.Results were articulated as mean ± SEM by (p < 0.05) from 6 individual rats. Group I: control rats, Group II: untreated hydrochloric acid (HCl)/ethanol rats, Group III: cirsilineol (20 mg/kg)-HCl/ethanol rats and Group IV: cirsilineol (40 mg/kg)-HCl/ethanol rats. ALP, alkaline phosphatases; ALT, alanine aminotransferase; AST, aspartate aminotransferase. #Significant difference by (p < 0.05) from Group I, *significant difference by (p < 0.05) from Group II, **significant difference by (p < 0.01) from Group II.
|
Effect of cirsilineol on the production of metabolic acidosis in HCl/ethanol induced gastric ulcer rats
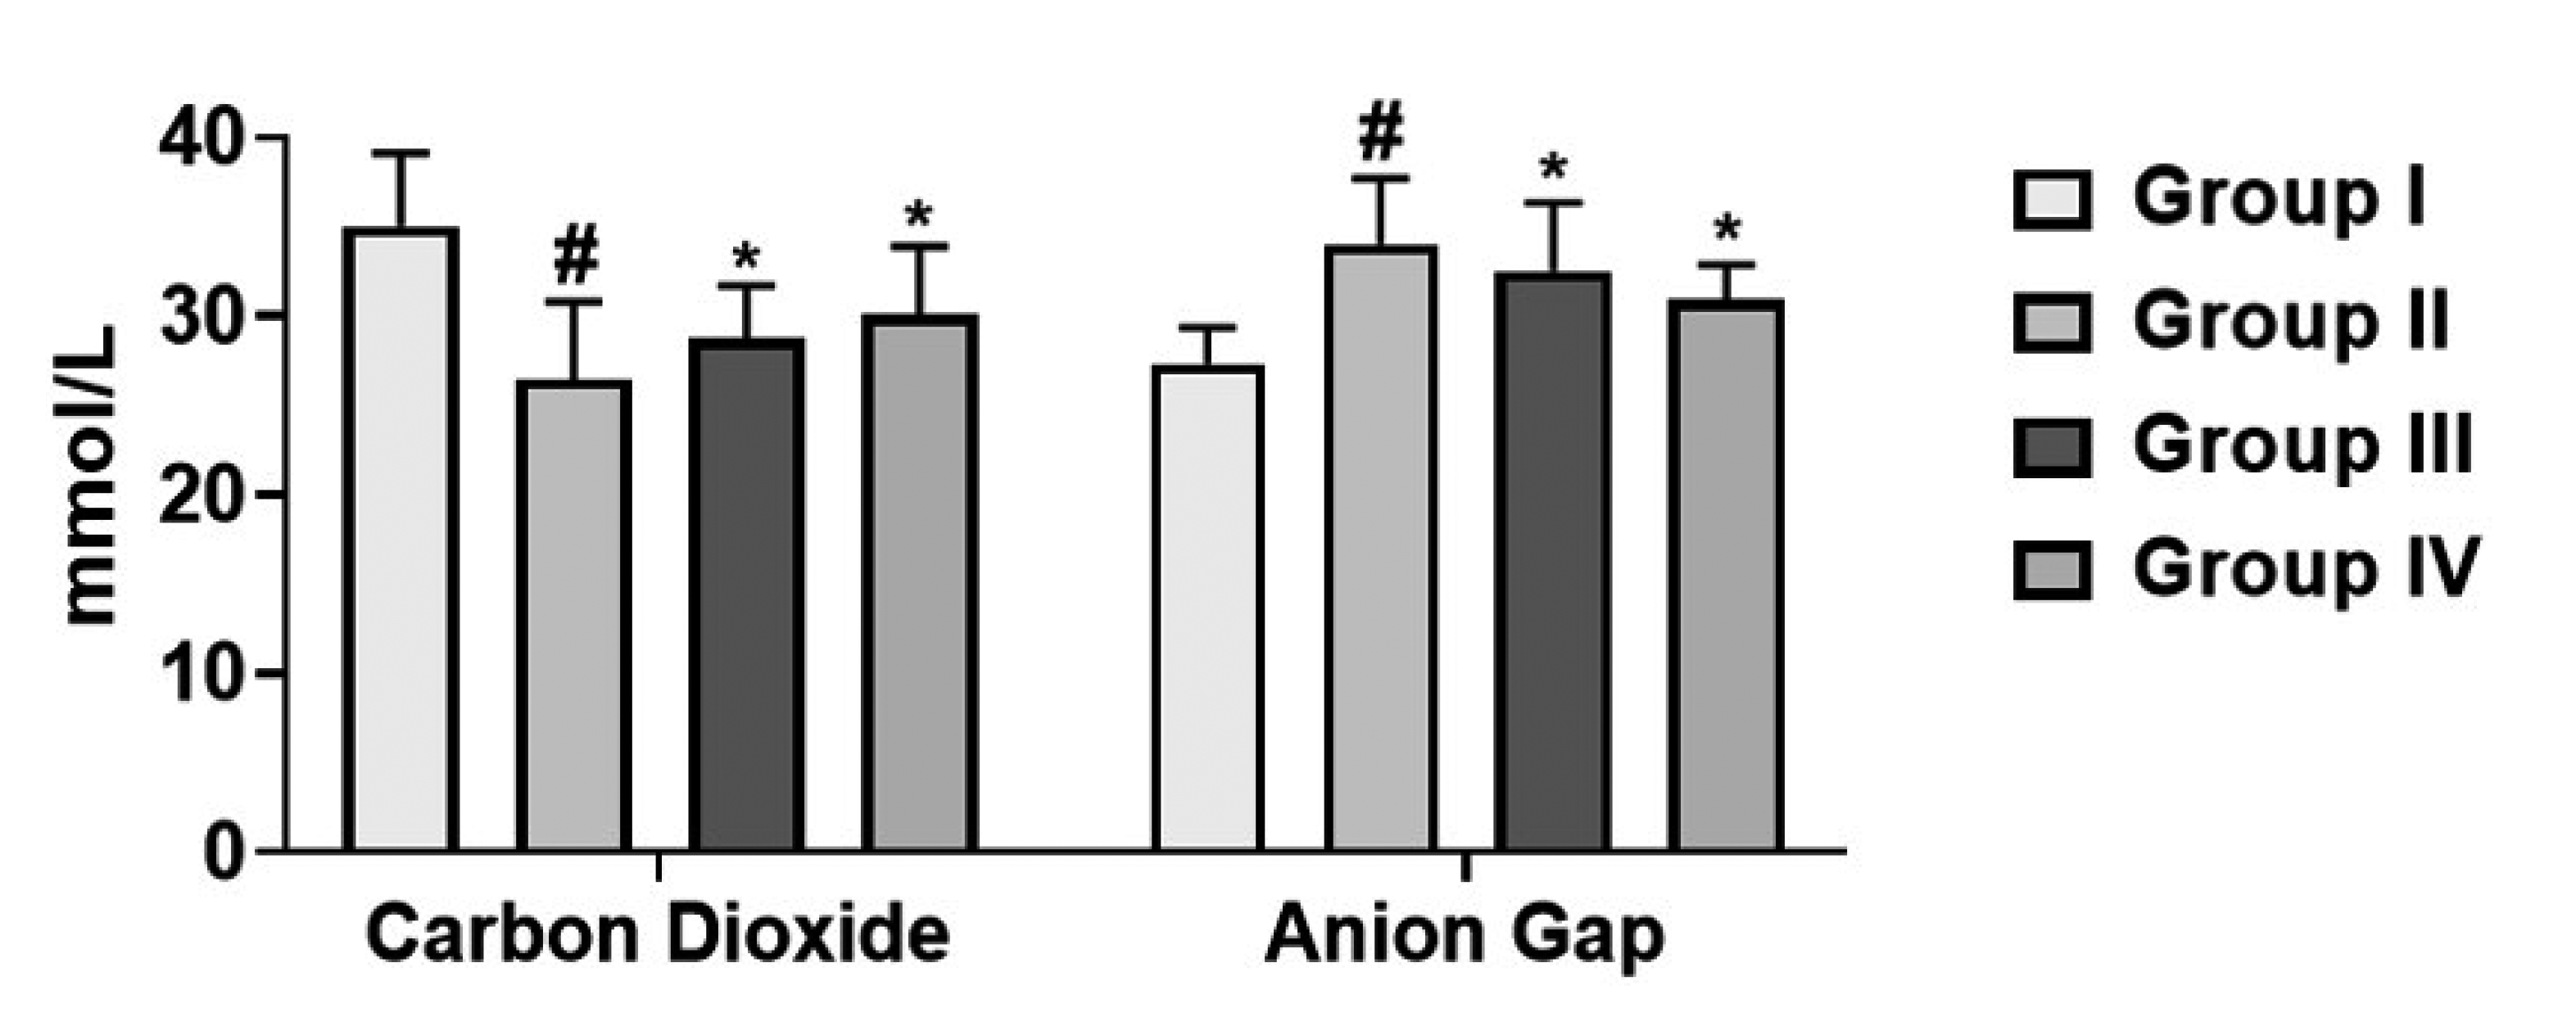
 | Fig. 4The metabolic acidosis by cirsilineol treatment.Results were articulated as mean ± SEM by (p < 0.05) from 6 individual rats. Group I: control rats, Group II: untreated hydrochloric acid (HCl)/ethanol rats, Group III: cirsilineol (20 mg/kg)-HCl/ethanol rats and Group IV: cirsilineol (40 mg/kg)-HCl/ethanol rats. #Significant difference by (p < 0.05) from Group I, *significant difference by (p < 0.05) from Group II.
|
Effect of cirsilineol on the production of kidney function markers in HCl/ethanol induced gastric ulcer rats
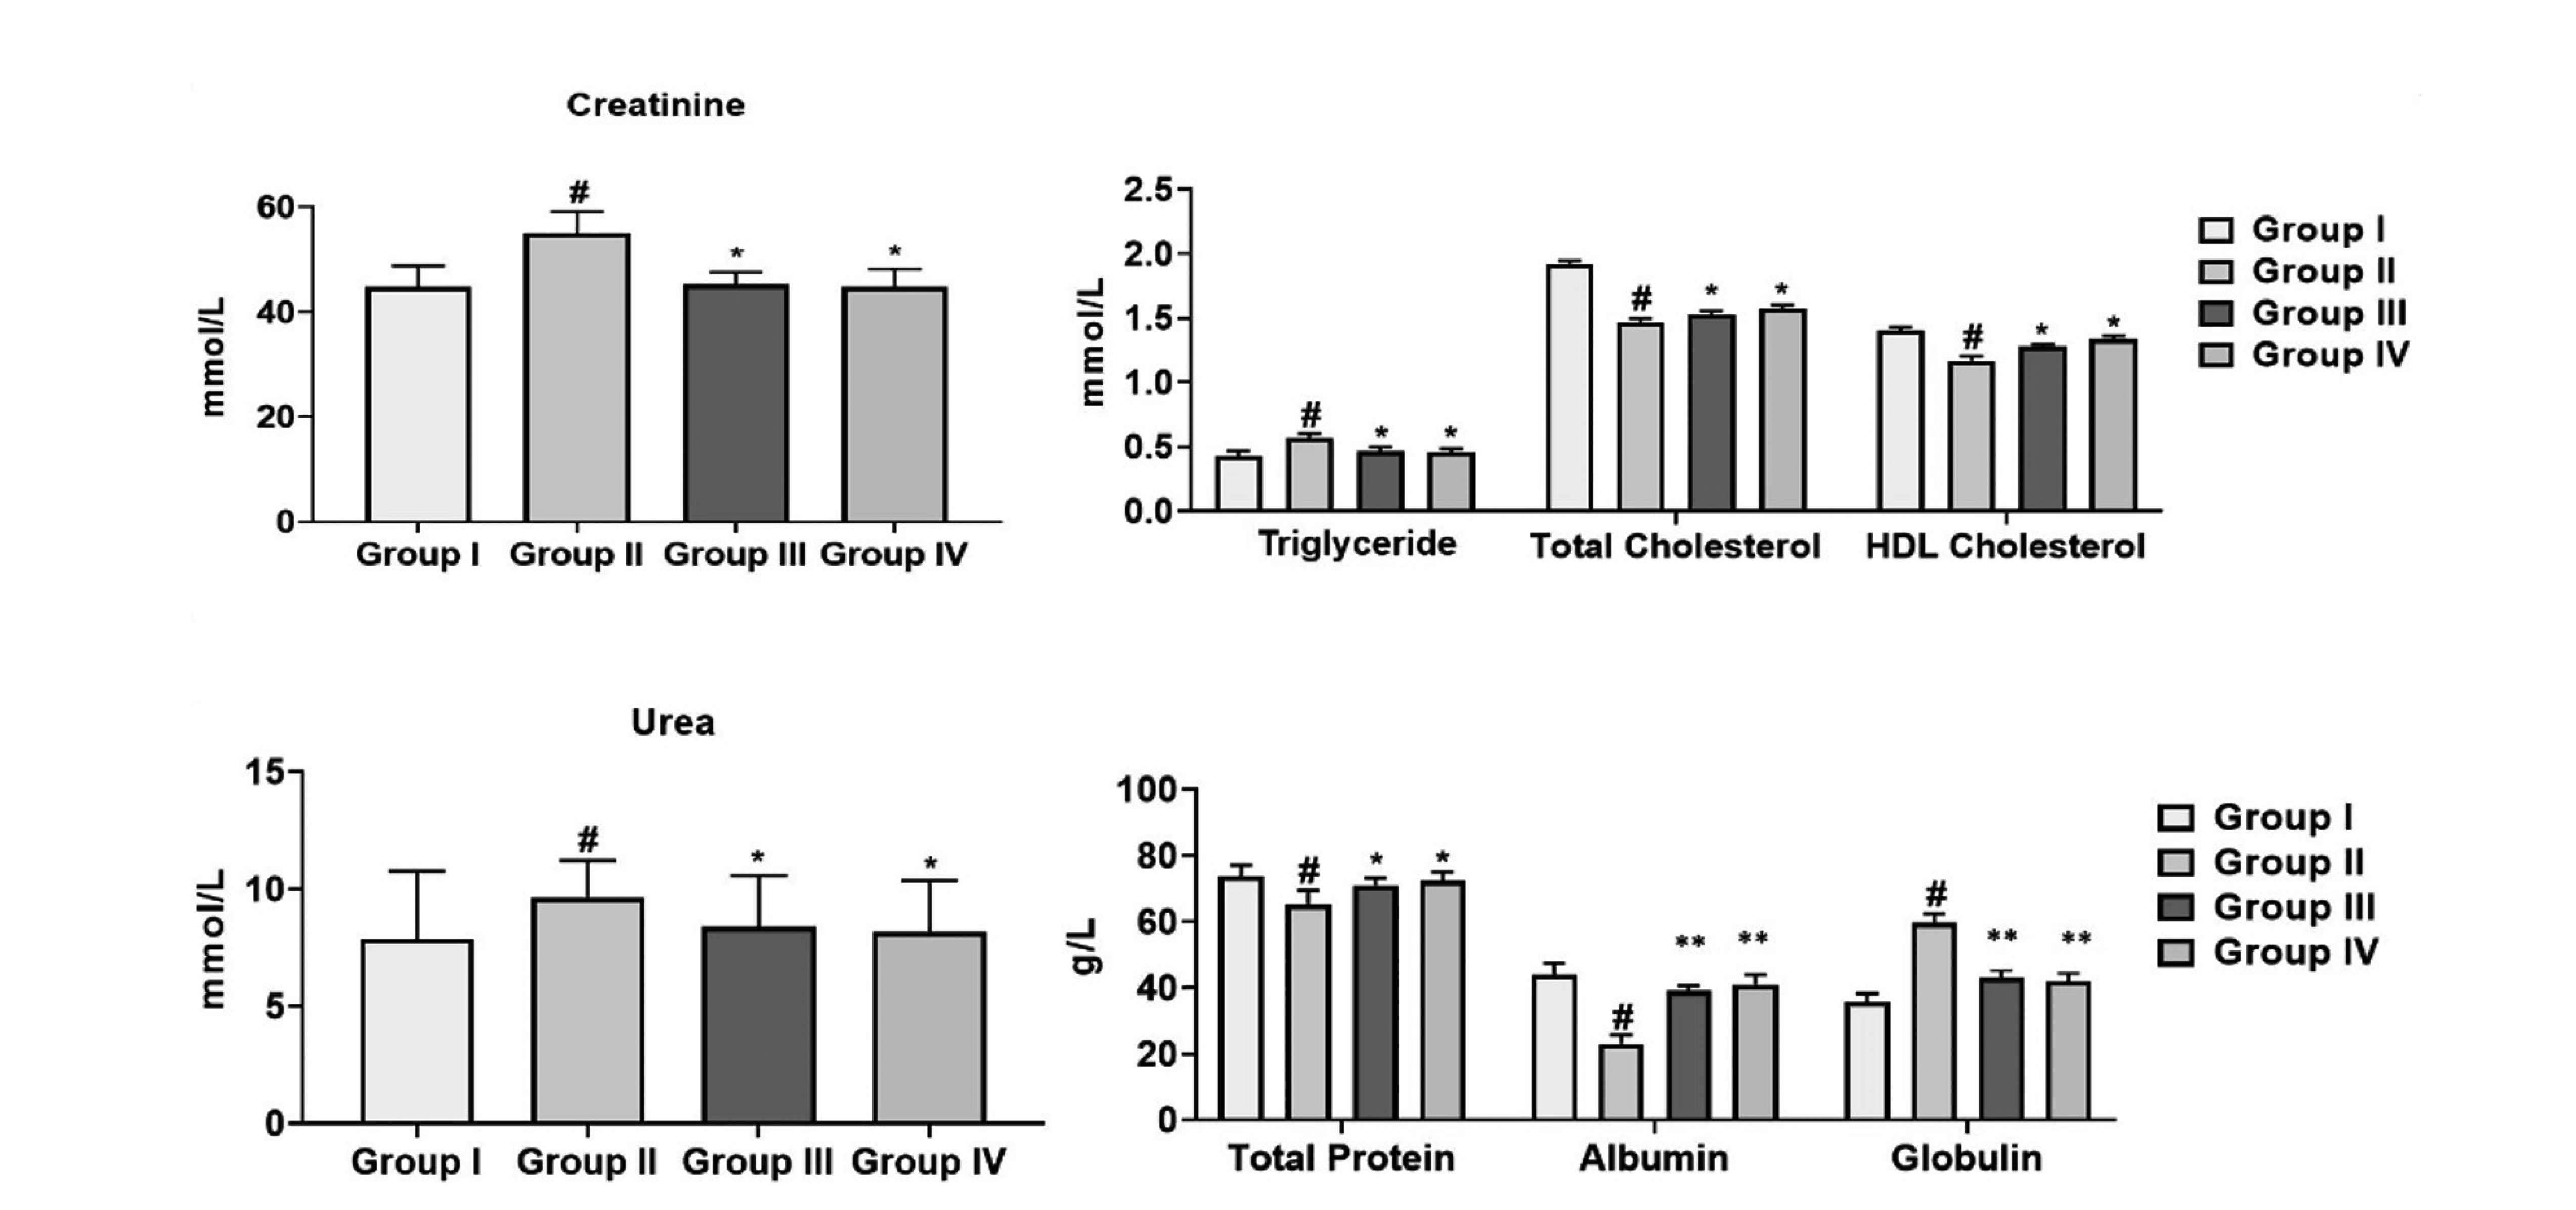
 | Fig. 5The kidney function markers (urea, creatinine, total protein, albumin, and globulin) and lipid profile (triglyceride, total cholesterol, and HDL cholesterol) by cirsilineol treatment.Results were articulated as mean ± SEM by (p < 0.05) from 6 individual rats. Group I: control rats, Group II: untreated hydrochloric acid (HCl)/ethanol rats, Group III: cirsilineol (20 mg/kg)-HCl/ethanol rats and Group IV: cirsilineol (40 mg/kg)-HCl/ethanol rats. HDL, high-density lipoprotein. #Significant difference by (p < 0.05) from Group I, *significant difference by (p < 0.05) from Group II, **significant difference by (p < 0.01) from Group II.
|
Effect of cirsilineol on the production of lipid markers in HCl/ethanol induced gastric ulcer rats
Effect of cirsilineol on the production of histological evidence in HCl/ethanol induced gastric ulcer rats
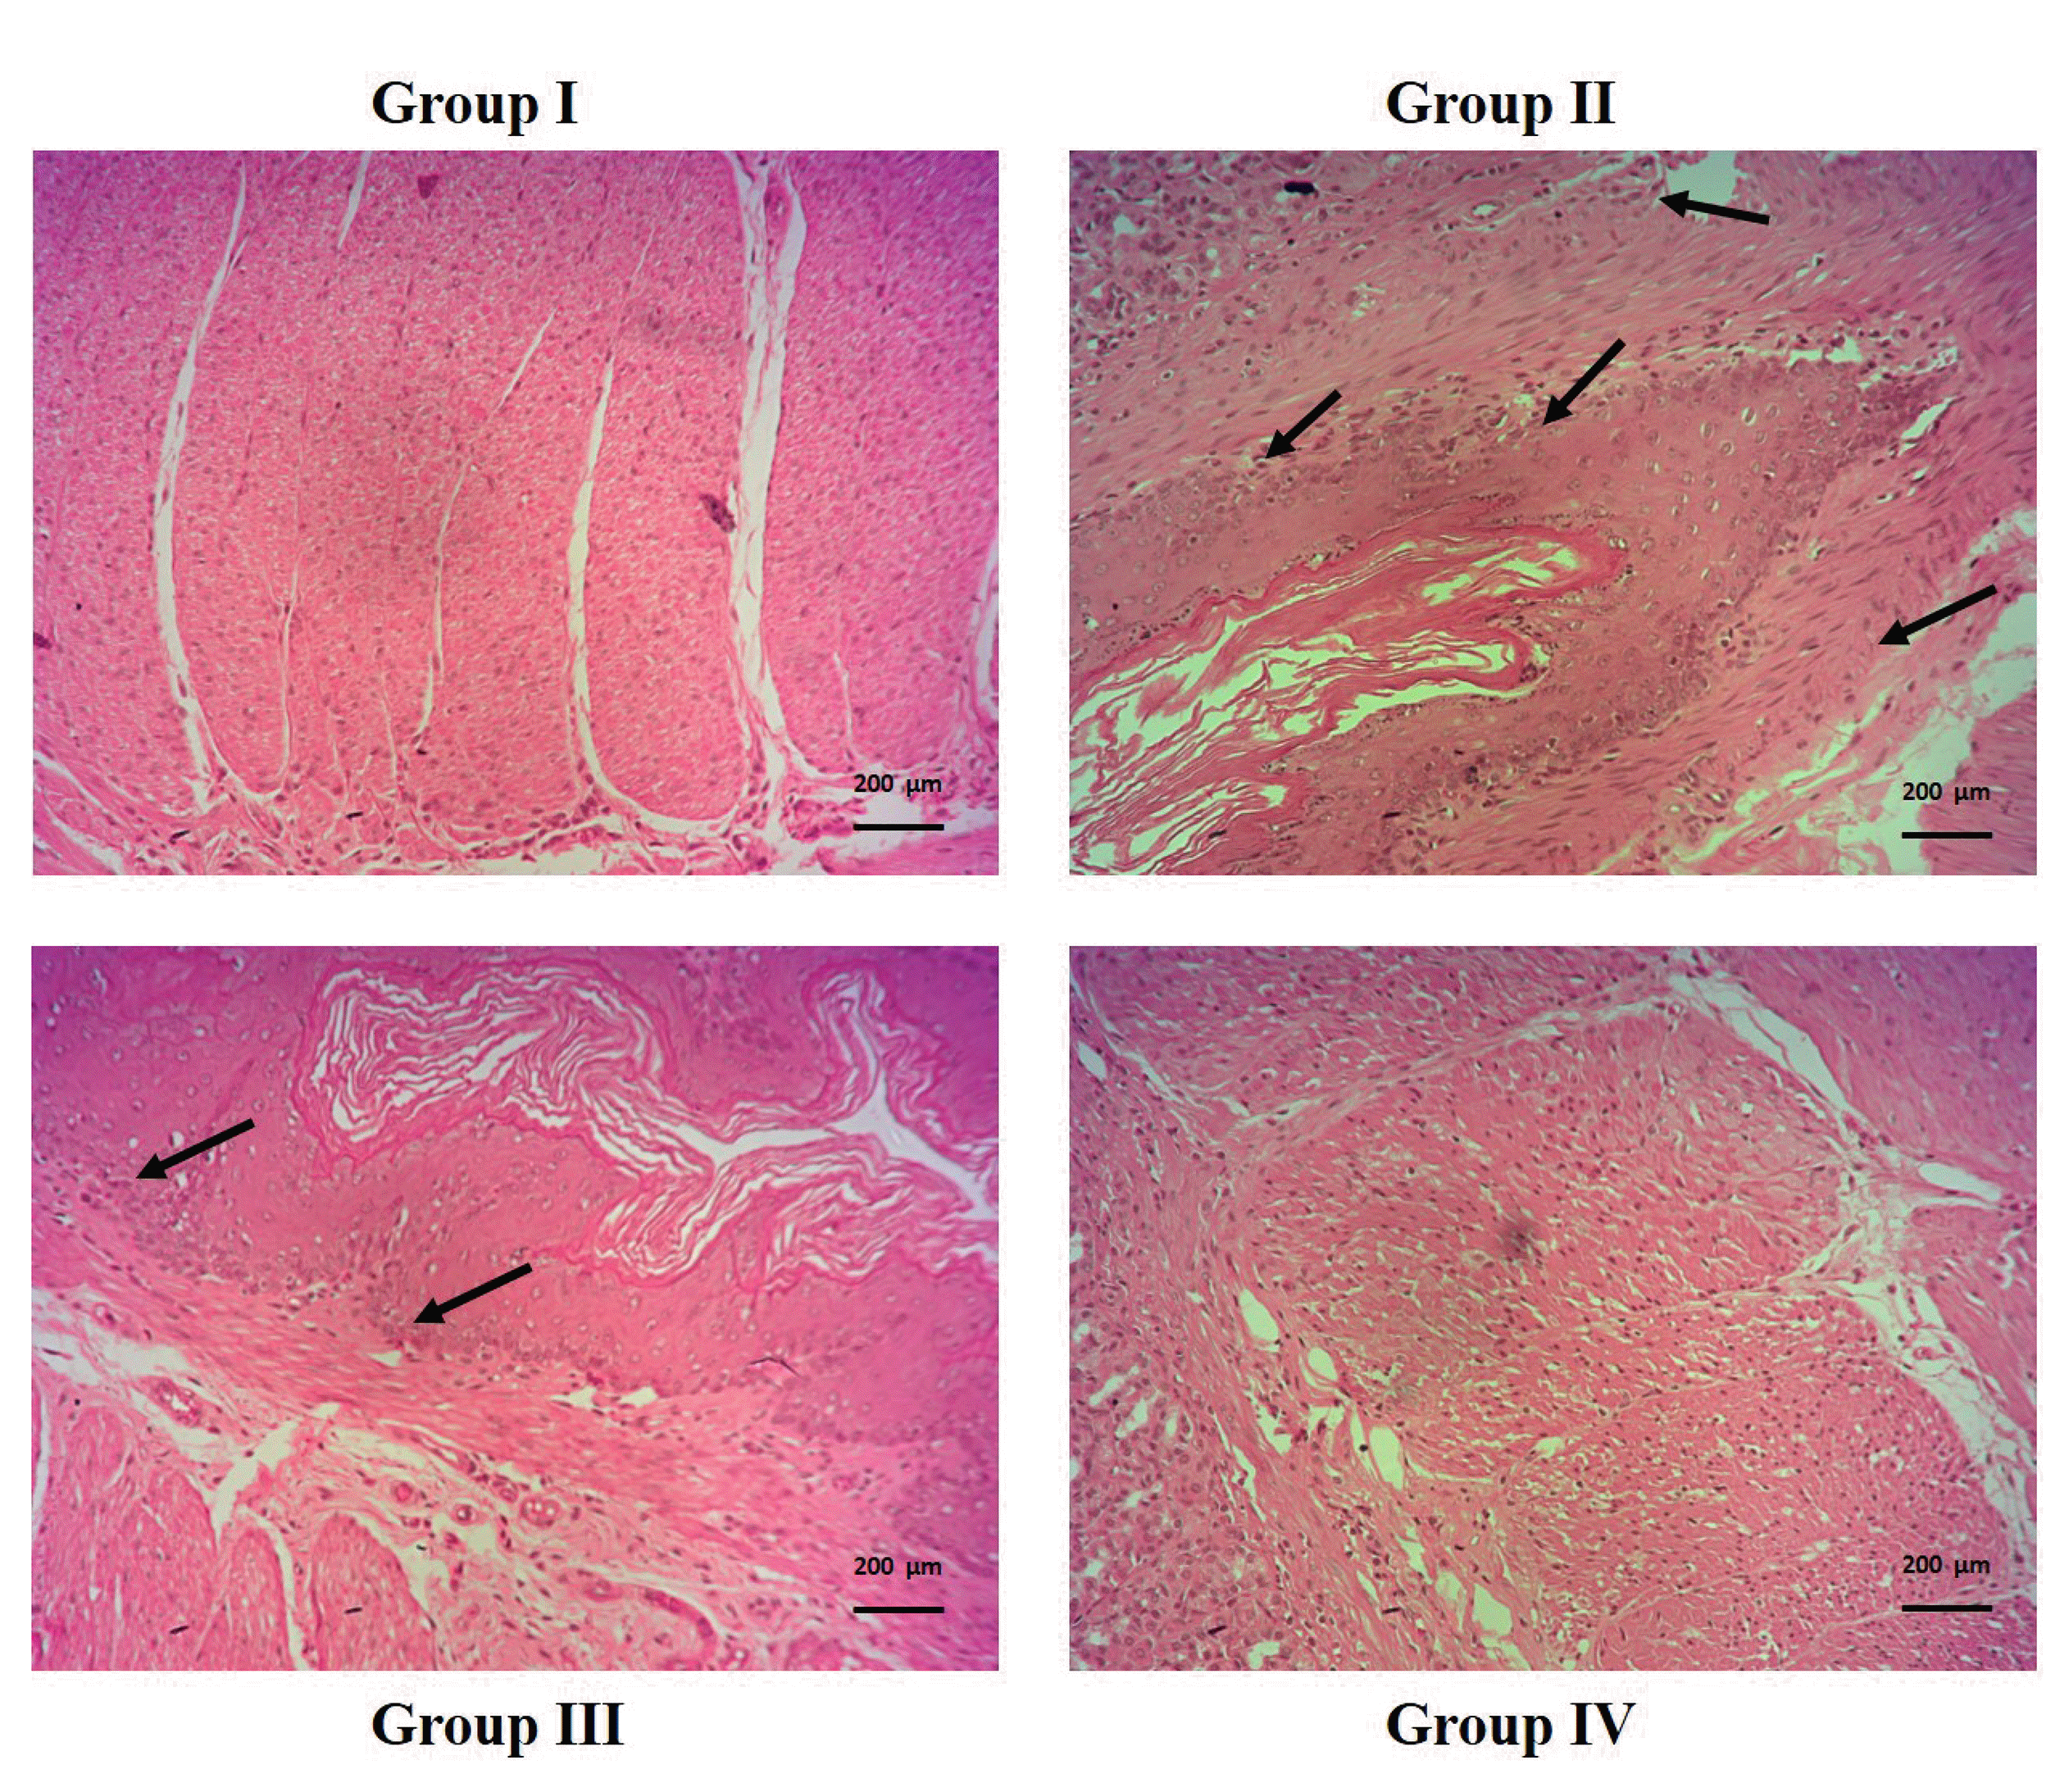 | Fig. 6The histopathological evidence by cirsilineol treatment.Group I: control rats; Group II: hydrochloric acid (HCl)/ethanol model rats (black arrows indicate the inflammatory cells, submucosal and mucosal damage, necrosis); Group III: cirsilineol (20 mg/kg)-HCl/ethanol rats (black arrows indicate the inflammatory cells, mild mucosal damage) and Group IV: cirsilineol (40 mg/kg)-HCl/ethanol rats. The stain method is H&E (magnification at ×100).
|


 PDF
PDF Citation
 Print
Print


 XML Download