

 PDF
PDF Citation
 Print
Print


INTRODUCTION
As global life expectancy rises and the diabetic population grows, the prevalence of peripheral artery disease (PAD) is also increasing. PAD is mainly caused by atherosclerosis and is associated with increased risk of cardiovascular death and morbidity.1) Furthermore, progressive atherosclerotic changes in PAD may lead to ischemic injury and may even require limb amputation.2) Although obesity is generally considered a risk factor for diabetes, hypertension, dyslipidemia, and coronary artery disease, clinical trials have demonstrated that overweight or obesity are associated with better prognosis in patients with cardiovascular disease (CVD).3) In contrast, death rates were shown to be higher in underweight patients with or without CVD.4) The pathophysiology behind this phenomenon remains poorly understood. This so-called obesity paradox has also been described in PAD patients.5) However, few studies have investigated the association between body mass index (BMI) and clinical outcomes of PAD.6)7) Thus, the present study aimed to investigate the relationship between BMI and clinical outcomes in patients with PAD undergoing endovascular treatment (EVT).
METHODS
Ethical statement
The study was conducted in accordance with the Declaration of Helsinki as revised in 2013 and approved by the Institutional Review Board of each participating hospital. The Institutional Review Boards of the participating hospitals waived the requirement for informed consent because of the retrospective nature of the study.
Study population
This study analyzed the retrospective cohort data of the Korean Vascular Intervention Society Endovascular Therapy in Lower Limb Artery Diseases (K-VIS ELLA) registry, a multicenter, observational retrospective and prospective cohort (ClinicalTrials.gov NCT02748226). The retrospective analysis included 3,073 patients with 3,972 target limbs who received EVT between January 2006 and July 2015 in 31 hospitals in Korea.8) After exclusion of patients without BMI information (n=159), 2914 patients were included in the present analysis. The distribution of BMI in the total population is presented in Supplementary Figure 1. Patients were categorized into four groups according to underweight, BMI <18.5 kg/m2, n=204; normal weight, BMI 18.5 to 24.9 kg/m2, n=1818; overweight, BMI 25 to 29.9 kg/m2, n=766, or obese, BMI ≥30 kg/m2, n=126.9)
Data of baseline characteristics, lesion characteristics, and clinical outcomes were collected by review of electronic medical records and angiography.
Clinical outcomes and definitions
The primary outcomes were major adverse cardiovascular event (MACE) and major adverse limb event (MALE). MACE was defined as a composite of all-cause deaths, myocardial infarctions, and strokes. MALE was defined as a composite of repeat revascularizations and major amputations. The secondary outcomes were cardiac death and individual components of the two primary outcomes. All-cause death was defined as any death, whether cardiac or non-cardiac in origin. Cardiac death was considered any death without definite non-cardiac cause. Myocardial infarction (MI) was defined as an event with a rise and/or fall of cardiac troponin values with at least one value above the 99th percentile upper reference limit in presence of symptoms of myocardial ischemia, new ischemic electrocardiogram changes, development of pathological Q waves, imaging evidence of new loss of viable myocardium or new regional wall motion abnormality in a pattern consistent with an ischemic etiology, or identification of a coronary thrombus by angiography.10) Stroke was defined as any occurrence of a neurological deficit confirmed by a neurologist, and with related abnormal findings in brain imaging studies.11) Repeat revascularization was defined as repeated open or endovascular interventions in the target limb. Major amputation was defined as above-the-ankle amputation of the index limb.
Statistical analyses
Continuous variables are expressed as mean ± standard deviation and were compared using analysis of variance. Categorical variables are reported as frequencies (percentage) and were compared using the Chi-squared or Fisher's exact tests. Event-free survival was analyzed using Kaplan-Meier survival curves and compared among different groups using the log-rank test. Univariable and multivariable Cox proportional hazard regression analysis was performed to calculate the hazard ratio (HR), and to identify independent predictors for clinical outcomes. Variables achieving p<0.15 in the univariable analysis with age, sex, or diabetes, congestive heart failure were entered in the multivariable analysis. HRs are presented as unadjusted and multivariable-adjusted. All analyses were performed using IBM SPSS 25.0 for Windows (SPSS Inc., Chicago, IL, USA) and R statistical software version 3.5.2 (R Foundation for Statistical Computing, Vienna, Austria). A value of p<0.05 was considered statistically significant.
RESULTS
Baseline clinical characteristics
Baseline characteristics of the study population according to BMI groups are summarized in Table 1. The obese and underweight groups were older than the normal weight and overweight groups. Male was the dominant gender, with presence above 80% in all BMI groups except the obese group (47.6%). Presence of hypertension and diabetes were more frequent, and current smoking was less frequent, in the overweight and obese groups than in the underweight and normal weight groups. Coronary artery disease also showed a trend toward increased prevalence at higher BMI (p=0.058). Congestive heart failure (CHF) and critical limb ischemia (CLI) were present more frequently in the underweight and obese groups than in the normal weight and overweight groups. Similarly, multilevel vessel disease was more frequently observed in the underweight and the obese groups than in the normal weight and overweight groups. Infrapopliteal artery disease also occurred more frequently in the underweight and the obese groups than in the normal weight and overweight groups.
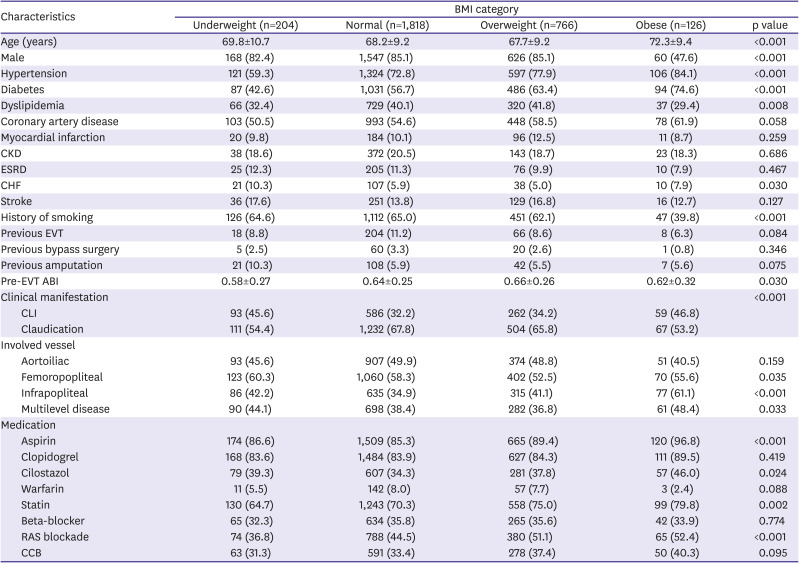
Table 1
Baseline characteristics of subjects according to BMI category
Except as noted, values represent numbers of patients, with percentages given in parentheses.
ABI = ankle-brachial index; BMI = body mass index; CCB = calcium channel blocker; CHF = congestive heart failure; CKD = chronic kidney disease; CLI = critical limb ischemia; ESRD = end-stage renal disease; EVT = endovascular therapy; PCI = percutaneous coronary intervention; RAS = renin-angiotensin system.
![]()
Risk of procedure complications and in-hospital adverse events according to body mass index categories
Incidences of procedure complications and in-hospital adverse events are presented in Table 2. There was no difference in the procedure-related complications. However, obese group showed more access site complications (p=0.001). However, in-hospital events did not differ significantly across the BMI categories (p=0.638).
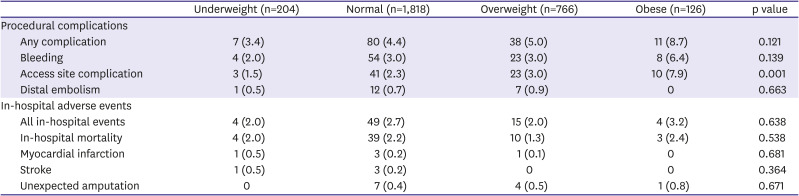
Table 2
Incidences of procedural complications and in-hospital adverse events according to body mass index category
![]()
Mid-term clinical outcomes according to body mass index categories
A total of 344 (10.4%) MACE events and 371 (12.7%) MALE events occurred during the follow-up period (median 720 days; interquartile range 351–1,046 days). Clinical outcomes according to the BMI groups, including MACE, MALE, all-cause death, and target lesion revascularizations (TLR), are presented in Figure 1. Accumulated events of cardiovascular death, MI, stroke, and major amputation are shown in Supplementary Figure 2.
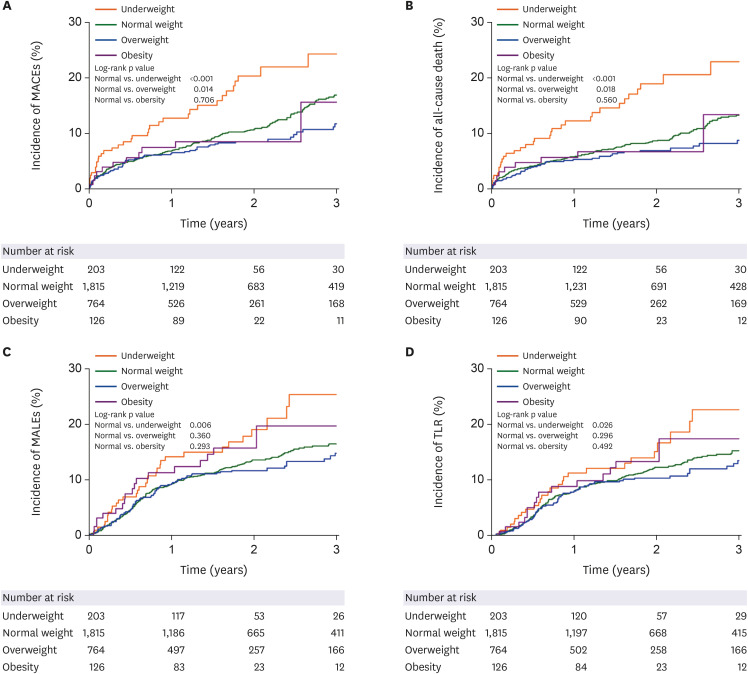
The underweight group showed the highest rates of MACE (17.2%) and all-cause death at 3 years (16.2%) compared with the normal weight (10.8% and 8.6%), overweight (8.4% and 6.5%), and obese groups (8.7% and 7.1%) (Figure 1A and B). The underweight group also showed the highest rates of MALE (15.7%) and TLR (13.2%) at 3 years, compared with the normal weight (11.7% and 10.5%), overweight (10.7% and 9.4%), and obese groups (14.3% and 11.9%) (Figure 1C and D).
The unadjusted and adjusted HRs for MACE and MALE according to BMI categories are presented in Table 3. The underweight group exhibited significantly higher risk of MACE (adjusted HR, 1.540; 95% CI, 1.091–2.173) and MALE (adjusted HR, 1.523; 95% CI, 1.066–2.177) compared with the normal weight group, after adjustment for confounding factors. Furthermore, the underweight group also showed significantly increased risk of all-cause death (adjusted HR, 1.793; 95% CI, 1.252–2.568), cardiac death (adjusted HR, 1.769; 95% CI, 1.043–2.999), and repeat revascularization (adjusted HR, 1.476; 95% CI, 1.005–2.166) compared with the normal weight group.
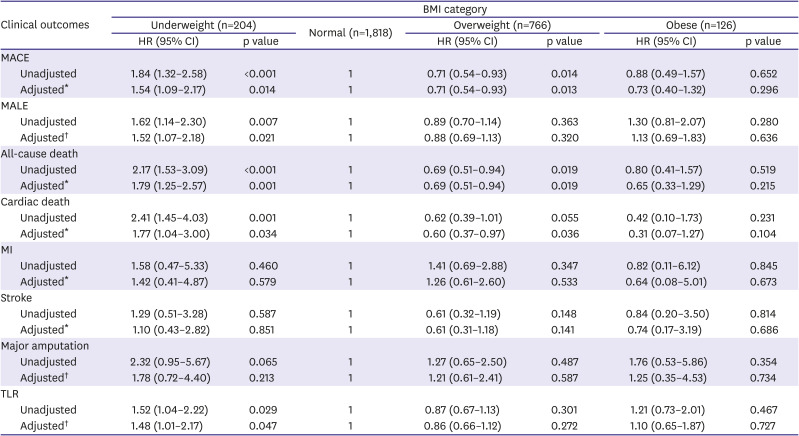
Table 3
Hazard ratios for primary and secondary outcomes, according to BMI categories
BMI = body mass index; CI = confidence interval; HR = hazard ratio; MACE = major adverse cardiovascular events; MALE = major adverse limb events; MI = myocardial infarction; TLR = target lesion revascularization.
MACE includes all-cause death, myocardial infarction, and stroke.
MALE includes major amputation and peripheral revascularization for ischemia.
*Adjusted for age, sex, diabetes, end-stage renal disease, chronic heart failure, previous stroke, previous myocardial infarction, previous bypass surgery, and critical limb ischemia.
†Adjusted for age, sex, diabetes, end-stage renal disease, chronic heart failure, previous stroke, previous endovascular treatment, and critical limb ischemia.
![]()
In contrast, the overweight group showed significantly decreased risks of MACE (adjusted HR, 0.706; 95% CI, 0.537–0.928), all-cause death (adjusted HR, 0.692; 95% CI, 0.508–0.942), and cardiac death (adjusted HR, 0.594; 95% CI, 0.365–0.965) compared with the normal weight group. However, overweight was not significantly associated with the risk of MALE. The obese group showed no association with either MACE or MALE.
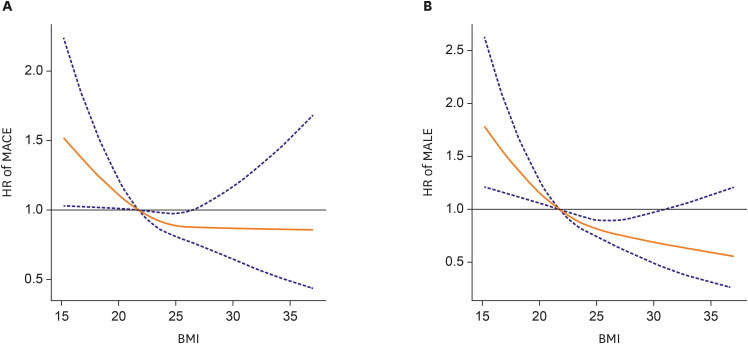
In restricted cubic spline regression analysis, negative non-linear association was observed between continuous BMI and the risks of MACE and MALE (Figure 2A and B).
Independent predictors of primary outcomes
Independent predictors of MACE and MALE are shown in Table 4. Underweight (HR, 1.539; 95% CI, 1.079–2.193) was identified in multivariable analysis as a significant predictor for MACE, along with age, end-stage renal disease, chronic heart failure, previous history of MI, stroke, peripheral bypass surgery, and CLI. The underweight category was also found to be a significant predictor of MALE (HR, 1.510; 95% CI, 1.056–2.160), along with male gender, end-stage renal disease, previous stroke, EVT procedure, and CLI.
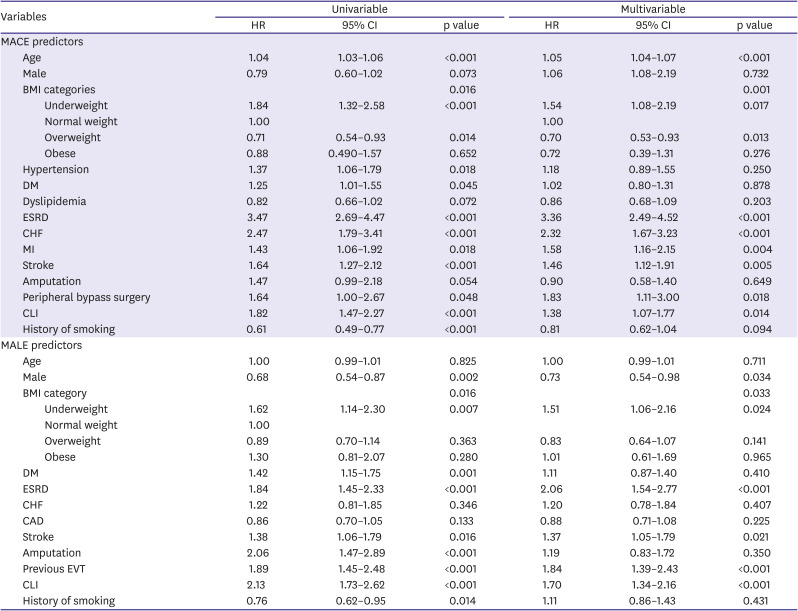
Table 4
Predictors for MACE and MALE
Only variables with p<0.15 in the univariable analysis are shown in this table. Variables with p<0.15 in the univariable analysis were included in the multivariable model.
MACE includes all-cause death, myocardial infarction and stroke.
MALE includes major amputation and peripheral revascularization for ischemia.
BMI = body mass index; CAD = coronary artery disease; CHF = chronic heart failure; CI = confidence interval; CLI = chronic limb ischemia; DM = diabetes mellitus; ESRD = end-stage renal disease; EVT = endovascular therapy; HR = hazard ratio; MACE = major adverse cardiovascular events; MALE = major adverse limb events.
![]()
DISCUSSION
The main findings of our study are as follows: 1) In PAD patients, underweight was significantly associated with increased risk of MACE and MALE compared with normal weight. In addition, underweight also showed significantly increased risk for all-cause death, cardiac death, and TLR compared with normal weight. 2) Overweight was associated with lower risk of MACE, all-cause death, and cardiac death compared with normal weight. However, overweight showed no impact on MALE. 3) Obesity showed no significant association with MACE or MALE. 4) Underweight was identified as an independent predictor for MACE as well as for MALE. 5) There was a negative non-linear association between continuous BMI and the risk of MACE and MALE.
Our study findings are consistent with those of previous studies investigating the influence of BMI on prognosis for patients with PAD. Golledge et al.5) reported an inverse association between BMI and the risk of death in patients with PAD. They found that underweight was associated with approximately two-fold higher mortality risk, while overweight and obesity were associated with about 30–40% decrease in mortality risk.
In another retrospective cohort study of CLI patients undergoing EVT for infrapopliteal artery lesions, the underweight group showed a higher death rate, whereas overweight and obese groups showed lower death rates than the normal weight group.12) However, the weight status had no impact on MALE in that analysis.
A recent analysis using the National Inpatient Sample database showed that patients in the low BMI group were more likely to experience in-hospital death, MACE, open bypass surgery, or infection compared with the normal BMI group.13) However, procedural complications, such as vascular complication or major bleeding, did not differ between the patient groups. In contrast, in the present study, we found no significant trend in in-hospital adverse events according to body weight status, possibly due to the small number of these events. However, incidences of access site complications were higher with increasing BMI. This may be explained by the greater depth of the access vessel, which may make it more difficult to precisely puncture the target vessel, and to apply effective hemostasis after the removal of vascular sheath.14) Previous studies investigating the relationship between BMI and procedural complications have reported conflicting results, possibly due to differences in study populations and procedures.15)16)
In the present study, underweight, end-stage renal disease, and CLI were identified as common independent predictors for MACE as well as for MALE. These predictors were also found in previous studies evaluating prognostic factors of PAD. Murata et al.12) reported that underweight and chronic renal failure were independent predictors for death in patients with CLI after EVT for isolated infra-popliteal artery lesion. Kumakura et al.17) revealed that low BMI, estimate glomerular filtration rate, and CLI were significant risk factors for both all-cause and cardiovascular death in PAD. However, to the best of our knowledge, there has been no study reporting underweight as an independent predictor of MALE in patients with PAD. In our study, underweight was an independent predictor not only for MACE, but also for MALE. Furthermore, the predictive power of underweight (HR, 1.510) for MALE was comparable with other traditional predictors such as CLI (HR, 1.704) and end-stage renal disease (HR, 2.063).
The mechanism of adverse effects of underweight on clinical outcomes of PAD is not well established. A possible explanation is that low BMI is associated with unfavorable clinical factors such as old age, malnutrition, or sarcopenia.18)19)20) In our study, however, underweight remained a significant predictor for MACE and MALE even after adjustment for age and other covariates. Malnutrition, another plausible explanation for poor prognosis of underweight, is associated with sarcopenia, and causes loss of metabolic reserve. Malnutrition is frequently combined with inflammation in chronic diseases such as heart failure. Malnutrition, sarcopenia, and chronic inflammation aggravate one another, creating a vicious cycle of fragility, the so-called malnutrition-inflammation complex syndrome.21)
Sarcopenia is frequently combined with PAD, and its prevalence increases with decreasing BMI.22) In small single center study, sarcopenia has been shown to be associated with higher death rate in patients with CLI (HR, 3.22; 95% CI, 1.24–9.11; p=0.02).23) The mechanism is not yet fully elucidated, however, aforementioned chronic inflammatory and protein wasting state of sarcopenia can be a plausible mechanism. Furthermore, level of adiponectin and carnitine, important anti-inflammory, anti-atherosclerotic, insulin sensitizing and pro-myogenic hormone, was reduced in sarcopenia.24) It promotes metabolic dysfunction and atherosclerosis in sarcopenic patients, resulting in poor clinical prognosis. Recent national health data showed that preserved muscle mass plays a crucial role in better survival rate in same BMI category from underweight to obesity people.25) It suggested sarcopenia could be more precise prognostic factor than BMI.
It is uncertain whether underweight results from an advanced atherosclerotic process of PAD or other comorbidities. Generally, physicians tend to consider underweight patients as having better lipid profiles and less CVD than higher body weight patients. This presumption may lead to CVD not being diagnosed in its early stage, and to underweight patients being managed less aggressively. In addition, the relatively low blood pressure in the underweight patients and their more sensitive reaction to low doses of drugs can present additional hurdles in prescribing medications.
A previous study demonstrated that good nutritional status is an independent predictor of better clinical outcomes in patients undergoing EVT.26) However, there are currently no recommendations for underweight PAD patients to gain weight in order to improve clinical outcomes. Further studies are needed to elucidate the role of increasing muscle, nutritional support, and weight gain on prognosis of PAD in underweight patients.
Our study has some limitations. First, the present study is a retrospective analysis with potential selection and observational bias, and this type of study does not reveal cause-and-effect relationships. Baseline characteristics and medical treatment showed significant difference between the different patient groups. There were more diabetes and hypertension in the overweight and obesity group than in the underweight and in the normal weight group. Accordingly, the overweight and the obesity group required more antiplatelet, lipid lowering, and antihypertensive medications than the underweight or the normal weight group. We tried to adjust the analysis outcomes based on the baseline characteristics. Second, the study population was confined to patients with PAD undergoing EVT. Thus, the results cannot be generalized to all patients with PAD. Third, BMI was estimated just once upon hospitalization for the index procedure. Therefore, the impact of changes in body weight on clinical outcomes during follow-up was not taken into account. Lastly, because the present registry database did not include information regarding nutrition, muscle mass, or physical activity, more detailed analysis of clinical factors leading to the underweight state was not feasible.
In conclusion, in patients with PAD undergoing endovascular therapy, underweight is an independent predictor for MACE and MALE, whereas overweight was associated with lower risk of MACE than normal weight.
 XML Download