

 PDF
PDF Citation
 Print
Print


INTRODUCTION
The percent of elderly people in the world's population is increasing as a consequence of life expectancy increases, which are due to health and medical progress and a decrease in birthrate [1]. Projections based on the assumption that the current demographic trends will continue indicate that the 21st century will be the “century of the old” in Turkey, which will be paralleled in populations around the world. In Turkey, the elderly population proportion of the total population was 8.7% in 2018. According to population projections, the elderly population proportion in Turkey is estimated to be 10.2% in 2023, 12.9% in 2030, 16.3% in 2040, 22.6% in 2060, and 25.6% in 2080 [2].
In the aging process, various physiological, psychological, economic, and social changes can adversely affect a person's nutritional status. Such malnutrition can be accompanied by disease and weakness. The elderly may have nutritional problems and can become predisposed to the risk of malnutrition [1]. Among the main nutritional disorders are malnutrition, overweight status, obesity, micronutrient abnormalities, and refeeding syndrome. Sarcopenia and frailty are conditions related to nutritional status and are associated with multiple complex factors [3]. Both diet and lifestyle change contribute significantly to the development of age-related diseases, and dietary modification may contribute to the prevention of age-related diseases, thereby helping to improve the quality of life in old age [4].
Malnutrition is a multifactorial condition among senior adults. According to a systematic review, demographic characteristics, financial characteristics, food access, appetite status, lifestyle, psychological characteristics, physical functioning, disease, oral health, and social factors can have effects on malnutrition [5]. In the elderly, unintentional weight losses of over 5% in the last month or over 10% in the last 6 months are associated with morbidity, mortality, and postoperative complications [6]. Studies assessing the prevalence of malnutrition among community-living elderly subjects have reported a malnutrition prevalence of 2–8% and a prevalence of malnutrition risk of 24–36% [7]. In a study conducted in Turkey, the risk of malnutrition was 31%, and the rate of malnutrition was 13% among geriatric outpatients, whereas malnutrition risk was 39% and malnutrition rate was 25% among hospitalized patients [8].
Malnutrition in residential areas and nursing homes is often associated with cognitive impairment, hypotension, infection, and anemia, and it may result in the deterioration of physical activities in daily life, such as dressing and washing. In hospitals, the risk of malnutrition may increase due to prolongation of hospital stay, increased morbidity, fractures, infection, and specific nutritional deficiencies, and may result in mortality [9].
A nutritional intake assessment, a component of a nutritional status assessment, is necessary when planning individual nutritional interventions, and it is also beneficial when developing public health and nutrition policies [10]. Changes in body composition and nutrition that occur during the aging process differ in men and women during different life stages and can be reflected by anthropometric measurements. Therefore, anthropometric measurements are an important part of nutritional assessment in geriatric medicine, because it allows determination of the patient's malnutrition, overweight, and obesity status and allows the assessment of muscle mass loss, fat mass gain and loss, and the distribution of adipose tissue [11].
This study performed screening of malnutrition risk by using the Mini Nutritional Assessment (MNA)-long form screening tool and identified malnutrition risk factors in elderly patients in a geriatric outpatient clinic of a hospital in Istanbul, Turkey. Additionally, this study compared elderly patients with malnutrition and patients with a normal nutritional status and identified risk factors that significantly contribute to the variability between the 2 groups.
Go to : 
SUBJECTS AND METHODS
Study design and sample
This was a cross‐sectional, descriptive study with analytic components. It was conducted between May 2018 and November 2018. The study population included 215 volunteers at or above the age of 65 and was comprised of 70 males and 145 females, who were outpatients in the Geriatrics Clinic of Istanbul University-Cerrahpasa, Cerrahpasa Medical Faculty Hospital, Istanbul, Turkey. Istanbul is one of the biggest and most crowded cities in Turkey. The Cerrahpasa Medical Faculty Hospital is one of the oldest and largest hospitals in Istanbul, and it receives referrals from all regions of Turkey. Patients with severe hearing and speech difficulties, severe cognitive impairment, or who had Standardized Mini-Mental State Examination scores of 24 points and below, and individuals who did not volunteer to participate in the study were excluded from the study.
Data collection
To assess the general information and nutritional habits of individuals, an evaluation form related to nutritional habits and food consumption and employed during weight management of elderly individuals was used. The form was previously reported as Patient Monitoring Guidelines of Dietitians [12]. To screen the nutritional status of the elderly subjects, the MNA-long form, developed by Vellas et al. [13] and the subject of validity-reliability study for elderly individuals, was used. In addition, the MNA, which has been used in homes, nursing homes, and hospitals to determine malnutrition and malnutrition risk, was validated for application in Turkish geriatric patients in 2015 [14]. The MNA-long form contains 18 elements in 4 parts and incorporates anthropometric measurements, dietary intake, and general- and self-assessment components. The 4 assessment parts include anthropometric assessments including body mass index (BMI), body weight, mid-upper arm circumference (MUAC), and calf circumference (CC); general assessments (lifestyle, drugs, mobility, depression, and dementia signs); short nutritional assessments (number of meals, food and fluid intake, nutritional autonomy) and subjective assessments (the perception of self about health and nutrition). The scores of each part are calculated by adding the points given to the answers to each question in that part. Based on the total score of all 4 parts of the MNA-long form, a score of 24 points and above were considered reflective of a normal nutritional status; scores between 17–23.5 as indicative of malnutrition risk, and below 17 points as indicating malnutrition [15].
In addition, a 24-h retrospective food consumption record for a single day was requested from the patients. The individuals were asked to report all food and beverages consumed in the last 24 h; each item was recorded by the investigator [16]. A catalog of food and drink photographs was used to help determine the consumed food portions and amounts. Data obtained from the 24-h retrospective food consumption record was analyzed by using the Nutrient Databank and Nutrition Information System—BeBiS full version 7.2 computer program (Ebispro, Stuttgart, Germany). Daily energy and nutrient intake levels were assessed based on mean, standard deviation, and lower and upper values.
Ethical consideration
The study was conducted with the approval of the Yeditepe University Clinical Trials Ethics Committee, Istanbul (No. 370668608-6100-15-1480 per the April 18, 2018 committee meeting). General information about the study was supplied to all individuals participating in the study, and an informed consent form was read and signed by each participant.
Statistical methods
A power analysis was performed based on an expected malnutrition rate of 6% in the elderly population and considering a confidence level of 95% and a margin of error of 5%. On that basis, a minimum of 150 elderly people were needed for the study; nevertheless, 215 elderly people were included in the study.
All obtained data were analyzed by using the SPSS (IBM SPSS Statistics version 25; IBM, Armonk, NY, USA) statistics program. Numeric variables were denoted by mean, standard deviation, median, lower and upper values, whereas categorical variables were denoted by a number and percentage (%). Presence of a normal distribution of data was determined by applying Kolmogorov-Smirnov and Shapiro-Wilkinson tests. For comparisons of 2 groups, independent samples t-tests were applied for variables with normal distributions. The χ2 tests were applied in comparisons of qualitative variables between 2 groups, and relationships between variables were tested by calculating Pearson correlation coefficients. In order to control for confounding factors, logistic regression analyses were performed. The confidence interval was set at 95% in all analyses, and test results were assumed to be statistically significant when P < 0.05.
Go to :
RESULTS
General characteristics according to nutritional status
This study included a total of 215 patients, consisting of 70 males (32.6%) and 145 females (67.4%) attending a geriatric outpatient clinic at a hospital in Istanbul, Turkey. Minimum and maximum ages of the individuals in the study were 65 and 94, respectively, and the mean age of all participants was 76.1 ± 7.0 years.
A normal nutritional status was present in 72.1% of the study participants (MNA score ≥ 24), while 24.7% were at risk of malnutrition (MNA 17 ≤ score < 24), and 3.2% were malnourished (MNA < 17) (Table 1). A risk of malnutrition was detected in 23.4% of women and 27.1% of men and the malnutrition rate was 1.4% in men and 4.1% in women.
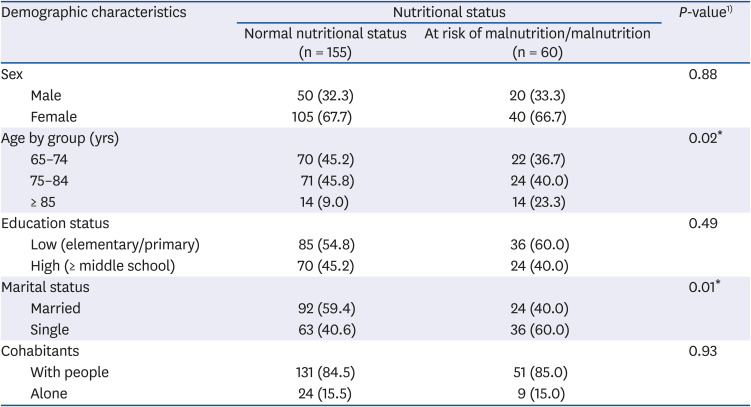
Table 1
Evaluation of demographic characteristics according to subjects' nutritional status
![]()
We examined the relationships between various sociodemographic characteristics of the study group and the groups' nutritional status. The risk of malnutrition and malnutrition itself were significantly associated with 2 sociodemographic characteristics of the participants: age (χ2 = 7.852; P < 0.05) and marital status (single) (χ2 = 6.522; P < 0.05) (Table 1).
Some health problems, as well as nutritional and physical activity habits of the study groups were evaluated according to their nutritional status (Table 2). In our study, the risk of malnutrition and malnutrition itself were significantly associated with a poor appetite (χ2 = 55.370; P < 0.001), difficulty in chewing/swallowing (χ2 = 24.217; P < 0.001), tooth loss (χ2 = 8.605; P < 0.001), hypertension diagnosis (χ2 = 5.598; P < 0.001), depression diagnosis (χ2 = 4.197; P < 0.001), meal skipping (χ2 = 5.694; P < 0.001) and regular physical activity (χ2 = 5.611; P < 0.001).
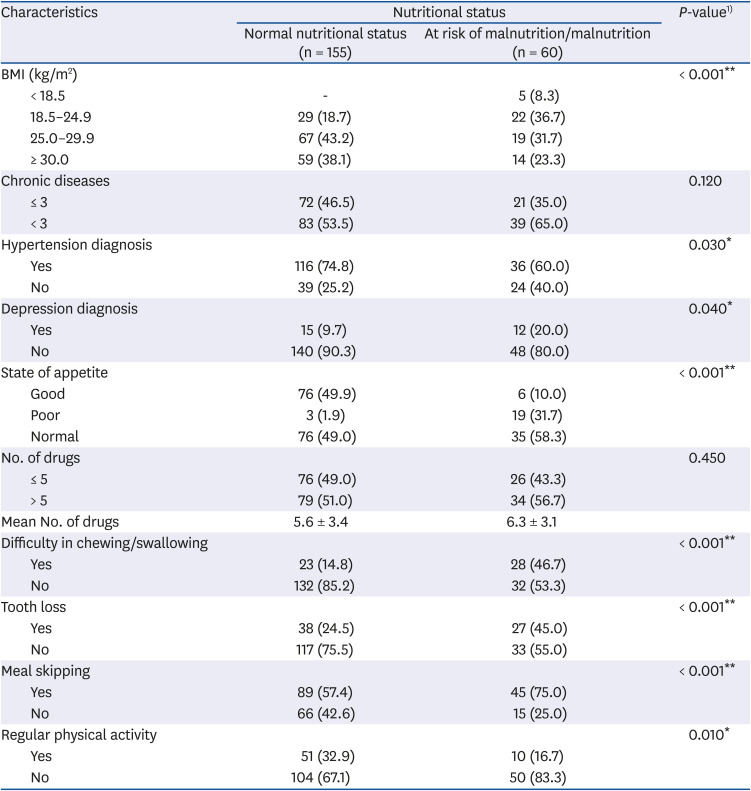
Table 2
Evaluation of health problems, physical activity, and eating habits of the study population according to nutritional status
Values are presented as number (%) or X̄ ± SD.
BMI, body mass index.
1)The χ2 test.
Significant at *P < 0.05, **P < 0.01.
![]()
Anthropometric values
Anthropometric values, according to nutritional status, are summarized in Table 3. While the mean waist-to-hip ratio of individuals with normal nutritional status was similar to the malnutrition and malnutrition risk group, mean body weight, BMI, MUAC, CC, and waist circumference were higher in the normal group. Statistically significant differences between the nutritional status groups were detected for mean body weight, BMI, MUAC, CC, and waist circumference (P < 0.01).
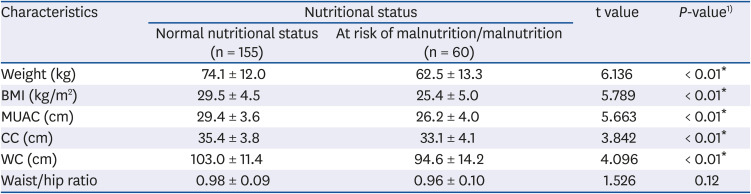
Table 3
Evaluation of anthropometric measurements in the study group according to nutritional status
Values are presented as X̄ ± SD.
BMI, body mass index; MUAC, mid-upper arm circumference; CC, calf circumference; WC, waist circumference.
1)Student's t-test.
*Significant at P < 0.01.
![]()
Nutrient intakes
Among the individuals with malnutrition or malnutrition risk, the mean protein intake was similar to individuals with a normal nutritional status. In contrast, mean daily energy, carbohydrates, fat, fiber, vitamin E, vitamin B1, vitamin B2, vitamin B6, vitamin C, folates, potassium, magnesium, phosphorus, iron, and water consumption values were lower in the malnutrition and malnutrition risk group (P < 0.05) (Table 4).
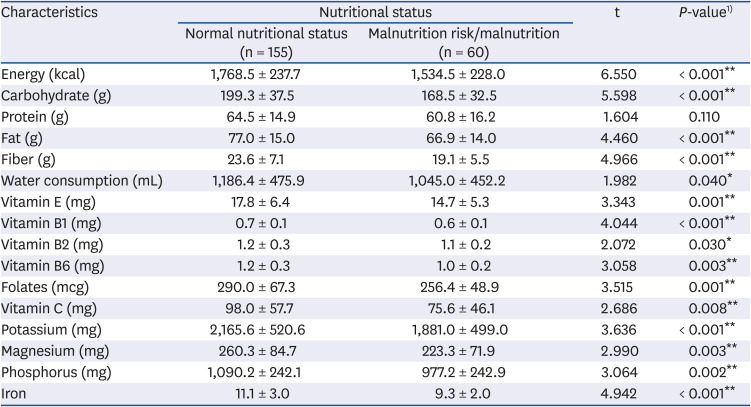
Table 4
Energy and nutrient intake according to nutritional status of study population
![]()
Risk factors related to malnutrition
The nutritional status of elderly individuals was significantly different according to their age, marital status, appetite status, difficulty in chewing/swallowing, meal skipping, tooth loss, depression diagnosis, several anthropometric measurements, and all daily energy and macronutrient intakes except for protein intake. Multivariate regression analysis using these parameters was performed to exclude confounding factors. The results of the analysis showed that factors associated with the nutritional status of the participants who were at risk of malnutrition and malnutrition were being married (odds ratio [OR], 0.44; confidence interval [CI], 0.20–0.97; P = 0.04), indicating that being married has a preventive effect on malnutrition or malnutrition risk. However, loss of teeth (OR, 3.12; CI, 1.35–7.20; P = 0.008), poor appetite status (OR, 9.3; CI, 2.3–37.19; P = 0.002), and a diagnosis of depression (OR, 4.58; CI, 1.52–13.77; P = 0.007) were associated with increased malnutrition and malnutrition risk (Table 5).
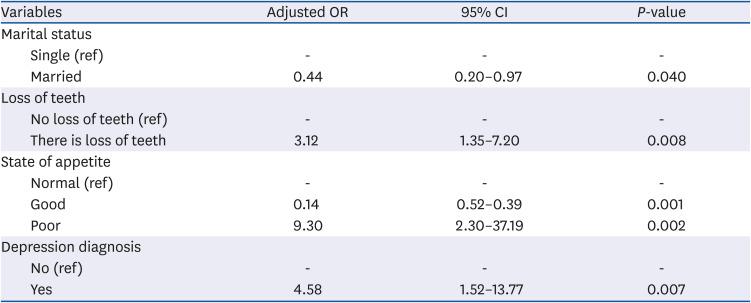
Table 5
Factors associated with nutritional status based on multivariate regression analyses
![]()
Go to :
DISCUSSION
Based on the MNA evaluation, we have shown that 24.7% of Turkish patients of this study were at risk for malnutrition and 3.3% of them were malnourished. In another study conducted in Turkey, malnutrition risk was detected in 29.1% of the elderly individuals, and malnutrition was found in 19% of these patients [17]. In a study conducted by Mitri et al. [18] that evaluated nutritional status and risk factors affecting elderly individuals (n = 905) in Lebanon, malnutrition risk was present in 45.5% of the individuals, and malnutrition was present in 2.8% of them. In a study conducted by Agarwalla et al. [19], the nutritional status of 360 Indian older individuals' was evaluated; 15% of them were malnourished, and 55% of them had a risk of malnutrition. In a study conducted by Damayanthi et al. [20] in Sri Lanka, malnutrition was present in 12.5% of 999 elderly individuals (mean age 70.8 years), and malnutrition risk was detected in 52.5% of them.
Although the results of our study are similar to the results of other studies, we have detected several malnutrition risk factors. In this study, among the sociodemographic variables, older age and being single from were associated with a poor nutritional status. Other studies have reported an association between older age, lower education, inadequate income [21], being single [22], and social isolation [23] and the risk of malnutrition. In a study conducted by Kalan et al. [15], malnutrition was detected in 6.6%, and malnutrition risk was detected in 31.6% of Turkish patients in Turkey. In their malnourished group, self-perception of health (87.9%), protein intake (86.4%), and taking at least 3 medications (77.3%) per day were the parameters associated with the greatest decrease in MNA score [15]. In the same study, protein intake (86.7%), health perception (74.7%), and taking at least 3 medications per day (65.2%) were the 3 parameters that were associated with the greatest decrease in MNA score in patients at risk of malnutrition [15].
In our study, statistically significant differences were detected between nutritional status and mean body weight, BMI, MUAC, CC, waist circumference, and hip circumference (P < 0.01). Although there are differences between the anthropometric values of the patients in both groups when classified according to MNA score, it is apparent that they have normal or high values according to standard reference values (Table 3). We suggest that this may be related to the similar protein intake levels in the 2 groups (Table 4). A poor nutritional status was not only present in the low-weight elderly categories as expected, but was also observed in subjects that were overweight or obese. In addition, although the waist/hip ratio was higher in the group with normal nutritional status than in the other group, in both groups, the value was higher than the standard reference value. We suggest that this result parallels that for the BMI data. These results indicate that malnutrition may occur if nutritional counseling of obese or overweight elderly adults is not performed correctly. The right advice should be directed towards a balanced and nutritious diet that meets both macro- and micronutrient needs, rather than focusing on weight loss. In a study conducted in Tarragona, Spain, the mean MNA score of 190 older individuals (67.5% female) with an average age of 85 years was 20, and 21% of them were underweight while 43.2% of them were overweight or obese [24]. According to a study conducted in Northern Cyprus, BMI, MUAC, and CC values of patients in the malnutrition/malnutrition risk group (mean age 73 years) averaged 28.6 kg/m2, 29.3 cm, and 34.1 cm, respectively, while the averages in patients with a normal nutritional status were 31.3 kg/m2, 31.6 cm, and 35.5 cm, respectively [25]. According to a study in Brazil, BMI, MUAC, and CC values of patients in the malnutrition/malnutrition risk group (mean age 72.9 years) averaged 21.6 kg/m2, 25.7 cm, and 31.1 cm, respectively, whereas the averages in patients with a normal nutritional status (mean age 69.1 years) were be 26.7 kg/m2, 30.3 cm, and 33.9 cm, respectively [26]. These observations suggest that anthropometric measurements of elderly individuals should be obtained routinely, and individuals with high anthropometric measurements should be considered at risk for poor nutrition status.
In our study, we could not find a statistically significant difference between the number of chronic diseases or the number of drugs taken and the nutritional status of the patients. However, when chronic diseases were selectively examined, hypertension and depression were found to be associated with a poor nutrition status. The proportion of individuals diagnosed with depression or hypertension was higher in the group of individuals with a risk of malnutrition or malnutrition. Depression is often manifested by changes in eating behavior and weight loss in geriatric populations or geriatric institutions in the community. Physical weakness, which is associated with loss of appetite, personal care, apathy, and depression, may also contribute to malnutrition in older adults [22].
In this study, it was observed that the patients with malnutrition or malnutrition risk were older than those with a normal nutrition status; moreover, their appetite was worse, dental loss was more frequent, chewing/swallowing difficulty was more frequent, skipping meals was more frequent, and they had less regular physical activity.
Anorexia of aging, an important factor related to malnutrition and malnutrition risk, was significantly associated with a poor nutritional status in our study. According to a study in the USA, 21.8% of individuals (average age 74.5 years) responded that they had a poor appetite. A poor appetite is an important independent predictor of low macro- and micronutrient intakes and is associated with the low dietary quality and decrease in food diversity consumed by older adults [27].
During the aging process, increased disease prevalence, oral and dental health problems, chewing and swallowing function problems, and social difficulties in obtaining food affect food intake quality and quantity. In Sweden, a study by Hägglund et al. [28] reported that 63% of 391 participants (mean age 84 years) had swallowing dysfunctions, and 23% were malnourished. According to a logistic regression analysis, there is increased risk of malnutrition among elderly people with abnormal swallowing capacity [28]. Patients in geriatric outpatient clinics should be screened routinely on their nutritional status to determine those who need nutritional support and to apply effective nutrition interventions. In order to reduce the risk of malnutrition, all elderly patients should be questioned about oral and dental health, and appropriate guidance should be given.
In our study, food consumption records of the patients were obtained via a daily recall method. Moreover, a food catalog was used to facilitate a patient's recall so that detailed information could be obtained. According to the results of our analysis, daily energy, carbohydrate, fat, fiber, vitamin B1, vitamin B6, vitamin C, folate, potassium, magnesium, phosphorus, and iron intake averages and water consumption levels were significantly lower in patients with malnutrition or malnutrition risk than in patients with a normal nutrition status. These observations indicate the importance of these factors on the development of malnutrition risk and malnutrition. In another study, data from 5 nutrition-related studies of elderly individuals living in Finland were combined (n = 900), and individuals with malnutrition (mean age 85 years) or malnutrition risk (mean age 82.4 years) exhibited insufficient daily energy, protein, carbohydrate, fiber, fat, vitamins B1, C, E, A, D, folate, calcium, iron, and zinc intakes compared to those in individuals with normal nutritional status (average age 78.5 years); moreover, the differences were statistically significant [29].
The results of our regression analysis revealed that malnutrition risk was associated with loss of teeth, being single, appetite status, and a depression diagnosis. In another study in Turkey, an age > 84 years, a low BMI, low educational background, presence of comorbidities, and high scores on depression tests were factors that were independently related to malnutrition [17]. According to another study in Lithuania, malnutrition risk and malnutrition are related to increased age, low economic status, being single, living alone, chronic and intermittent pain, chewing difficulties, swallowing disorders, dental problems, and drug use [21]. A study in Lebanon showed that a high number of chronic diseases, bad oral and dental health, depressive disorders, higher BMI values, and disability were variables that were significantly associated with a malnutrition status [18]. However, in a study in Assam, India, the relationships between nutritional status, increased age, female sex, loss of appetite, chewing and swallowing difficulty, dependent functional status, inadequate financial status, and daily caloric intake were found to be significant [19]. According to a study in the West Bengal region of India, females were significantly more malnourished than males [30]. Being older, having a lower income, a lower level of literacy, a reduced food intake, or a low food consumption level were independently associated with a low MNA score [30]. In a study conducted Hirose et al. [31], the nutritional status of Japan elderly individuals living in the community and in nursing homes (n = 1,098, mean age 81.2 years) was screened by applying the MNA-short form, and malnutrition was detected in 21.4% of the individuals. Malnutrition and individuals with malnutrition risk had more difficulty in swallowing, loss of appetite, cognitive impairment, mobility disorder, and falling history compared to those in normal nutritional status individuals, and statistically significant differences were detected (P < 0.001) [31]. In addition, patients whose nutritional status is deemed “good” (63.3%) have more hypertension frequency compared to those with malnutrition (43.3%), and a statistically significant difference was found [31]. Researchers in Sri Lanka found that increasing age, hypertension, and alcohol consumption were positively related to the presence of malnutrition [20]. Similar results were obtained in our study, with hypertension present in 74.8% of individuals with good nutritional status and in 60% of individuals with malnutrition, a statistically significant difference.
One of the main strengths of the study is the relatively large sample size of elderly adults living in urban areas of Turkey. This study also evaluated a wide range of sociodemographic, health and nutrition behavior, and functional status factors that could have a potentially adverse effect on nutritional status.
Some limitations of our study should be taken into consideration while interpreting our results. First of all, the study included subjects from only one center, a university geriatric outpatient clinic in Istanbul. Secondly, except for anthropometric measurements, all data were self-reported and subjective. As a consequence, the generalizability of our results may be limited; however, they highlight the importance of determining malnutrition risk and malnutrition status in elderly patients.
A basic strategy for keeping elderly adults healthy is to prevent chronic diseases and decrease various related complications, including malnutrition. Nutrition is a complex issue that can affect the incidence and the progression of chronic diseases, as well, it has an important role in the quality of life. The elderly are particularly sensitive to malnutrition when they have chronic mental or physical diseases. Therefore, they should be screened for malnutrition risk, and, based on the results of this study, an appropriate care plan should be developed. If nutritional deficiencies cannot be diagnosed and treated in a timely manner, the self-sufficiency of a patient can deteriorate, increasing the need for institutionalization, treatment costs, and the risk of death. In order to maintain and improve the functional status of the elderly, efforts should be undertaken to help them adopt healthy eating and lifestyle practices.
Go to :
 XML Download