

 PDF
PDF Citation
 Print
Print


INTRODUCTION
Vitamin D plays an important role in regulating bone metabolism by stimulating the intestinal absorption of calcium and phosphorus. Severe vitamin D deficiency causes rickets in children and osteomalacia in adults [1]. Besides, this long-standing role in bone metabolism, vitamin D has become increasingly recognized for its role in the pathophysiology of various non-skeletal health outcomes [234]. With the growing body of evidence on the role of vitamin D and widespread of vitamin D deficiency [5], the North American Institute of Medicine (IOM) was requested to update the dietary reference intakes (DRI) for vitamin D. In 2011, IOM updated the DRIs for vitamin D for individuals aged 1–70 yrs from adequate intake of 5 µg/day to estimated average requirement (EAR) of 10 µg/day and Recommended Dietary Allowance of 15 µg/day [67].
The IOM 2011 report has become the core report, which other authoritative agencies used as a reference to establish their DRIs and dietary reference values (DRV). Following the publication of IOM report, several authoritative agencies including European Food Safety Authority [8], UK Scientific Advisory Committee on Nutrition [9], and Nordic Council of Ministers [10] had also updated their dietary recommendations for vitamin D. Current dietary recommendations by these authoritative agencies for adults are ranged from 5 µg to 15 µg/day [11]. In Malaysia, the recommended nutrient intakes (RNI; defined as the average daily dietary intake level that is sufficient to meet the nutrient requirements of 97.5% of each population group) for vitamin D for population aged 1–70 yrs has also updated and increased from 5 µg/day (RNI 2005) [12] to 15 µg/day (RNI 2017) [13].
Pregnant women are considered as group at risk of vitamin D deficiency for reasons of increasing vitamin D requirement, poor dietary vitamin D intake or poor sun exposure [1415]. However, it is important to mention that, no evidence has indicated that the vitamin D requirement for pregnant women is higher than non-pregnant [67]. Therefore, current DRI/DRV value for vitamin D for pregnant women is largely same as non-pregnant population. In countries of northern region such as Europe [910], Canada [16], and United States [17] pregnant women are recommended to consume supplementary vitamin D.
Over the decades, mandatory vitamin D fortification of margarine have been regulated under legislation in countries like Singapore, Australia, and Canada. In countries like Norway, Sweden, Finland and United States, fortification of staple food such as milk, breakfast cereal and orange juice with vitamin D have been introduced, either in mandatory or voluntary basis [181920]. In accordance with current revising and increasing DRV for vitamin D, some countries have re-evaluated and updated their food fortification strategies. For instances, in 2016, the Food and Drug Administration (FDA) permitted voluntary “doubling” of fortification of vitamin D in milk: from 1.05 µg/100 g to 2.1 µg/100 g [21].
In Malaysia, margarine is the only food which mandates to fortify with vitamin D [22]. Besides, there is no existing vitamin D supplementation recommendation for pregnant women in Malaysia. Prior to the release of updated Malaysian RNI (RNI 2017), 2 reports revealed that the prevalence of inadequate vitamin D intake (RNI < 5 µg/day) among Malaysian pregnant women was 44.9% [23] and 25.5% [24]. Nevertheless, it is unsure whether the current vitamin D food fortification policy is sufficient to supply adequate vitamin D to Malaysian pregnant women. Data on the contribution of all sources to daily vitamin D intake are required for establishing strategies to prevent inadequate intake.
Evidence has shown population-specific of the effectiveness of fortification of milk and dairy in protecting against vitamin D deficiency [2526]. Nevertheless, limiting the fortification to a single staple was demonstrated not to increase the vitamin D intake in non-consumers [2627]. A previous study suggested that diversity in food consumption pattern across culture and levels of additions should be considered carefully when developing fortification strategies [28]. Before the implementation of food fortification strategies, it is suggested to estimate the effect of different scenarios of vitamin D fortification on vitamin D intake for a given population, particularly groups at highest risk of profound vitamin D deficiency (e.g. pregnant women) by mathematical model.
Therefore, the current study is aimed to assess the vitamin D intake and the adequacy of vitamin D intake based on revised Malaysian RNI (RNI 2017). Additionally, the contribution of food and supplements on the total intake of vitamin D is described. Besides, the food consumption data from this study is used to model the impact of several dietary strategies to increase vitamin D intake in pregnant women, group at risk of vitamin D deficiency. With consideration besides milk, the malted drink could be the popular drinks consumed by the Malaysian population. Therefore, the impacts of vitamin D fortification in milk and malted drinks as compared to universal provision of multivitamin supplement were modelled in this study.
SUBJECTS AND METHODS
Participants
Ethical approval was obtained from the Medical Research and Ethics Committee Ministry of Health Malaysia with the ID: NMRR-15-786-24865. A total of 217 pregnant women were recruited at the labour suite's Patient Assessment Center at the Department of Gynaecology and Obstetrics Hospital Serdang, Selangor, Malaysia, between October 2015 and February 2017. The inclusion criteria were Malaysian, aged 19 to 40 yrs, singleton pregnancy and pregnancy in gestational age ≥ 37 weeks during the recruitment. Pregnant women who were diagnosed with pre-existing systemic disease or pregnancy complications and had a history of bone and renal disorders, as well as infants born with congenital anomalies, were excluded from this study.
Dietary vitamin D assessment
A vitamin D-specific semi-quantitative food frequency questionnaire composed of a list of vitamin D rich food was used to assess the dietary vitamin D intake of pregnant women. The FFQ was adapted from an FFQ, which was previously developed and validated for assessing vitamin D intake among Malaysia pregnant women [29]. The FFQ was administered by a trained interviewer. Consumption of natural vitamin D rich food (fish, poultry and poultry products, egg, and mushroom) and commercial vitamin D fortified food (milk and dairy products, beverages, biscuit, confectionery and savoury snacks, creamer, fat spread) were recorded. Pregnant women were asked to recall the brand (for commercial food), frequency and serving size of listed food they had consumed over the past 1 month. Data regarding dietary and prenatal supplement use were collected. Pregnant women were requested to provide information regarding their supplement (e.g. brand name, type of supplement, and specific nutrient), frequency and dosage of intake in the past 1 month.
The vitamin D values of raw foods were obtained from Singapore Energy and Nutrient Composition of Food Database [30] or the United States Department of Agriculture National Nutrient Database for Standard [31]. Vitamin D content in commercial products was obtained from the product labels. Vitamin D content of the supplements was obtained from the companies' product labels and website. The vitamin D intake for each food or supplement (µg/day) for each pregnant woman was calculated by multiplying the vitamin D content of the food (or supplement) with portion size (or dosage) and the frequency of consumption. The vitamin D intake from each food group was summed up, and total vitamin D intake from food sources as well as supplements was calculated. Total vitamin D intake was calculated by summing vitamin D intake from food sources and from supplements. The adequacy of vitamin D intake was assessed by comparing the individual total vitamin D intake with RNI. The proportions of pregnant women who had intake below Malaysian RNI 2017 (15 µg/day), RNI 2005 (5 µg/day) and IOM estimated average intakes (EARs) or 67% of RNI 2017 (10 µg/day) was calculated. The percentage of contribution of each food group to total dietary vitamin D intake was calculated for individual cases.
Covariates
Information on maternal age, gestational age, last menstrual period (LMP), first booking (date, weeks, and ultrasound scan), gravidity, pre-pregnancy weight and heights were obtained from the electronic medical record and antenatal card of each study participant. Gestational age was determined by LMP and confirmed by the first dating scan. Body mass index was calculated as body weight divided by squared body height (kg/m2). Data on maternal ethnicity, education level, employment status and household income were collected.
Modelling of vitamin D intake
The potential impact of mandatory food-fortification scenarios on vitamin D intake was assessed by recalculating the vitamin D intake following hypothetical modifications to the food composition data of vitamin D by using the consumption data. The amount of vitamin D in milk and malted drink found in the market in Malaysia are as follows: prenatal milk powder contains 1.2–2 µg/serving (250 mL or a cup), all milk contains 0–7.5 µg/serving (250 mL or a cup) and malted contains 0–5.6 µg/serving (250 mL or cup). For the modelling purposes, all milk and malted drink were assumed to be fortified with a single level of 2.5 µg/serving or 5 µg/serving of vitamin D. These values are levels commonly used in other countries [18] and maximum level allowed by FDA [20], respectively, in milk vitamin D fortification. Six fortifications scenarios were modelled: 1) milk at concentration of 2.5 µg per serving, 2) milk at concentration of 5.0 µg per serving, 3) malted drink at concentration of 2.5 µg per serving, 4) malted drink at concentration of 2.5 µg per serving, 5) simultaneous milk and malted drink at concentration of 2.5 µg per serving, and 6) simultaneous milk and malted drink at concentration of 5.0 µg per serving. Besides, the potential impact of 2 supplementation scenarios was modelled: 1) universal provision of 5 µg of vitamin D containing supplement per day and 2) universal provision of 10 µg of vitamin D containing supplement per day.
Statistical analyses
All statistical analyses were performed using IBM SPSS version 21.0 (IBM Corp., Armonk, NY, USA). Characteristics of the study participants were described as No. (%) for categorical variables. Continuous variables were tested for normality using Smirnov-Kolmogorov test and skewness (≤ +2 or ≤ −2) and were described as mean and standard deviation or median and interquartile range. Mann-Whitney U test was used to compare the vitamin D intake among vitamin D supplement users and non-users. The χ2 test was used to compare the adequacy of vitamin D intake among supplement users and non-users. Statistical significance was set at P < 0.05.
RESULTS
Characteristics of participants
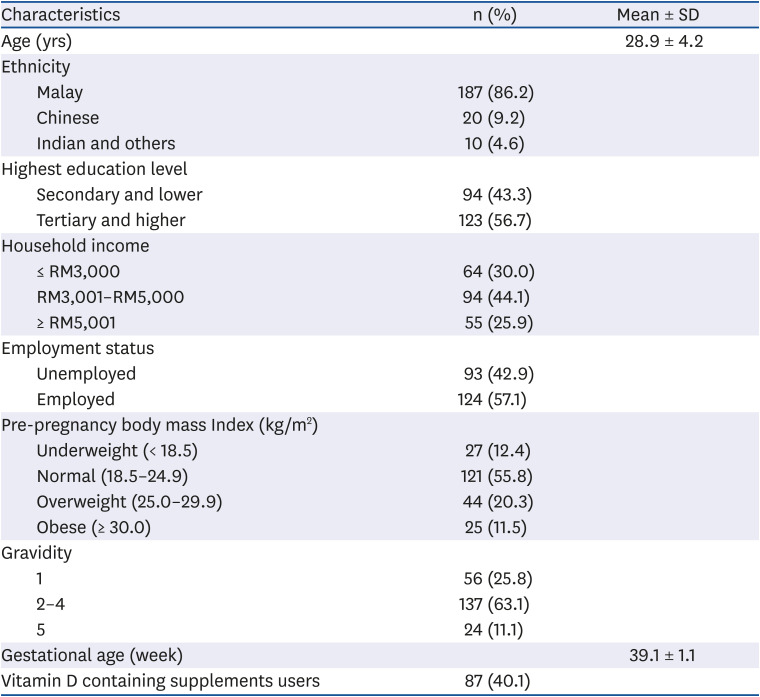
This study included a total of 217 Malaysian pregnant women with a mean age of 29 ± 4 yrs (Table 1). Malaysia is a multi-ethnic country, comprising 3 major ethnic groups; Malay is the largest ethnic group, followed by Chinese and then Indian. In the present study, the majority of the study participants (86.2%) were Malays with approximately half of the respondents had tertiary education (56.7%) or higher and were employed (57.1%) (Table 1). Less than half of the respondents (40.1%) reported consuming vitamin D containing supplements.
Table 1
Characteristic of study participants
Dietary vitamin D intake
As shown in Table 2, the mean vitamin D intake from all sources was 12.1 ± 7.2 µg/day or 80.7% of RNI. Supplement users had significantly higher mean total vitamin D intakes (17.5 ± 6.4 µg/day) compared to non-supplement users (8.4 ± 5.1 µg/day) (P < 0.001). When considering all sources, 67.7% of respondents failed to meet the RNI cut-offs for vitamin D (RNI 2017) of 15 µg/day, and nearly half (46.1%) failed to meet 67% of RNI for vitamin D (EAR) level of 10 µg/day. Nonetheless, only a low percentage (19.2%) of pregnant women failed to meet the former RNI (RNI 2005) of 5 µg/day. The proportion of respondents who did not meet RNI and EAR of vitamin D was significantly higher in supplement non-users in contrast to supplement users (< RNI: 87.7% vs. 37.9% and < EAR: 68.5% vs. 12.6% P < 0.001).
Table 2
Dietary vitamin D intake by supplement user and non-user
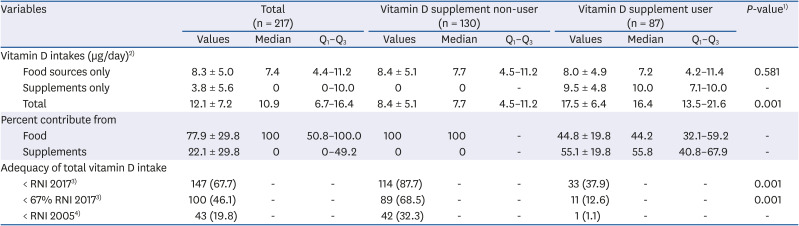
Values are presented as mean ± SD or n (%).
Q1, the 1st quartile; Q3, the 3rd quartile; RNI, recommended nutrient intakes.
1)P-value indicates the statistical difference between supplement user and non-user.
2)Vitamin D conversion: 1 µg = 40IU.
3)Based on RNI 2017, RNI for vitamin D for pregnant women is 15 µg/day.
4)Based on RNI 2005, RNI for vitamin D for pregnant women is 5 µg/day.
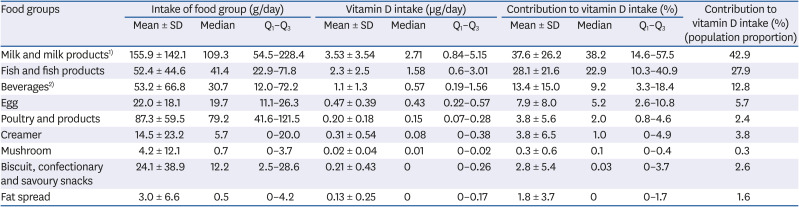
Table 3 describes the median values and the percentiles (25th and 75th percentiles) of the daily intake, vitamin D intake and contribution by food groups. Milk and milk product contributed to approximately 40% of daily vitamin D intake from food, followed by fish/fish products (22.9%), beverages (9.2%) and egg (5.2%). Poultry and poultry products contributed to a very substantial amount (2%) regardless of the median intake of about 1 serving (80 g) per day. For food groups (creamer, mushroom, biscuit confectionery and savoury snack) median values for their contribution to vitamin D intake were near to zero as these foods had low vitamin D content. The percent of contribution of fat spread to total dietary vitamin D intakes were ranged from 0–1.7%.
Table 3
Intake of food group and vitamin D
Modelling of vitamin D intake
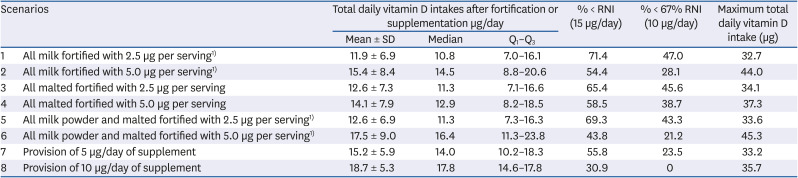
Under modelling scenarios of 2, 4, and 6, there was an increase in mean vitamin D, and led to an expected decrease in the proportion with intake below the RNI when compared with scenarios 1, 3, and 5 (Table 4). Scenario 6 represented a great increase in vitamin D intake (17.5 ug/day) over current intake (12.1 µg/day) and with no individual exceeding the upper intake of 100 µg/day (highest total intake level of 45.3 µg/day). As expected, when universal provision of vitamin D containing supplement at 10 µg/day scenario (scenario 8) was assumed, the greatest improvement in mean total vitamin D can be achieved.
Table 4
Potential food fortifications and supplementation scenarios on total vitamin D intake of pregnant women
DISCUSSION
Previous studies have demonstrated a small percentage of inadequate vitamin D intake in Malaysian pregnant women [24]. However, these studies were published prior to the release of new Malaysian RNI (RNI1 2017). In the current study, using updated Malaysian RNI (RNI 2017) of 15 µg/day to define inadequate intake, we reported more than half (67.7%) of inadequate intake in the study participants. This finding indicates that current food fortification policy is unrealistic to supply vitamin D at 15 µg/day, which is 3 folds higher than the previous RNI. This finding is in agreement with studies conducted in Belgian [32], Canadian [33], British [34], which revealed that current food fortifications in their countries are insufficient to ensure their population to achieve DRI/DRV.
Overall, mean vitamin D intake of the pregnant women in this study (12.1 ± 7.2 µg/day) was comparable with the finding from a previous study, which demonstrated that mean total vitamin D intake of 11.5 µg/day among pregnant women in Malaysia [24]. The mean total vitamin D intake reported in this study was higher compared to a study conducted among pregnant women in Sweden (9.3 µg/day) [35], Japan (5.5 µg/day) [36], Indonesia (7.9 µg/day) [37], and the Netherlands (5.9 µg/day) [38], but was lower compared to pregnant women in Canada (17.2 µg/day) [39]. The variation in average vitamin D intake may be due to variation in food fortification practices in which fortification may be implemented by national legislation or voluntarily by manufacturers. Despite this, supplement intake is an important determinant, resulting in the variation of intake amounts between countries. For instance, the high prevalence of supplement intake was also reported in a study conducted in Canada in which 78.5% of respondents used multivitamin [39].
In the current study, vitamin D supplement users had significantly higher total vitamin D intake (17.5 µg/day) compared to non-users (8.4 µg/day) (P < 0.05). However, there was no significant difference in vitamin D intake from food among supplement users (8.0 µg/day) and non-users (8.4 µg/day). This finding suggests that higher vitamin D intake among supplement users compared to non-users is attributed to the consumption of supplements and not due to any differences in dietary habits. Also, we found that the prevalence of inadequate vitamin D intake (< RNI 2017) was lower among supplement user (37.9%) as compared to non-user (87.7%). This finding supports previous studies that demonstrated dietary supplement could significantly improve the total vitamin D intake [3940].
In Malaysia, the provision of prenatal multivitamin is not universal but dependent on the availability and the requirement of pregnant women. There were less than half (40.1%) of our participants took a supplement. To assess the potential impact of universal provision of prenatal multivitamins on total vitamin D intake, the scenario was modelled where all pregnant women were given daily multivitamin, which contains 5 µg and 10 µg per capsule of vitamin D. As expected, the findings revealed that the improvement in vitamin D intake is dependent on the dose of vitamin D in supplement. The universal provision of 5 µg/day of vitamin D containing prenatal multivitamin reduced the percent of inadequacy intake modestly (≈11%) to 55.8%. Nonetheless, the universal provision of 10 µg/day of vitamin D containing prenatal multivitamin would reduce the percent of inadequacy intake to one third (30.9%). Nonetheless, this modelling could not be accountable for the problem of adherence and cost incurred of implementing this strategy. Additionally, food fortification may be a better strategy considering its wider benefit: increasing vitamin D intake of pregnant women and general population [4142].
Itkonen et al. [18] demonstrated that milk products contribute substantially (about 50%) to total vitamin D intake in countries with a wide policy for fortification. However, in countries like Norway and Sweden where fluid milk is fortified with a low amount of vitamin D, fluid milk contributed to as low as 4% and 12% of total vitamin D intake, respectively [18]. In Malaysia, pregnant women are recommended to take 2 servings of milk or dairy products per day [43]. Thus, in the current study, a quarter of pregnant women take at least one serving of milk per day, and milk and dairy products were the main sources of vitamin D, contributing to about 40% of vitamin D intake from food. However, the mean total vitamin D intake of the pregnant women in the study was still lower than RNI as in Malaysia, milk is not mandatorily fortified with vitamin D. Despite margarine is mandatorily fortified with vitamin D at level of 6.5–7.5 µg/100 g, median contribution of fat spread to total vitamin D intake was zero (0–1.7%), which could be explained by low intake of fat spread among the study participants (median intake of 0.5 µg/day, Table 3). Taken together, findings from our study and study by Itkonen et al. [18] showed that the effectiveness of food fortification strategies is a function of food quantity consumed, level of fortification and the fortification strategies (mandatorily or voluntarily). When fortification is voluntary, and uptake is far less, there is a lower impact of vitamin D fortification on total intake [26].
Vitamin D fortification is non-systematic and standardized in Malaysia. Some products are highly fortified with vitamin D while some are not. Several brands of milk available in the Malaysian market have vitamin D content of more than 5 µg/serving, and some contain up to 7.5 µg/serving. The level of more than 5 µg/serving and 7.5 µg of vitamin D per serving is higher than the maximum level that is allowed by U.S. FDA (5 µg/serving) [20] and Health Canada (2.9 µg/serving) [44]. Despite having some of the respondents taking milk with vitamin D higher than 5 µg/day, none of the study participants had total vitamin D intake above upper level of 100 µg/day. This data could serve as evidence towards the feasibility of voluntary vitamin D fortification strategies in the milk of 5 µg/serving and up to 7.5 µg/serving.
The findings demonstrated that modelling fortification at of milk and/or malted drinks at a single level of 2.5 µg/day, level set by in US and Canada, decreased the total intake. This is likely due to several brands of milk and malted drink consumed by the respondents are fortified at a level higher than 2.5 µg/serving. Hypothetical modifications of milk and malted drinks indicated that vitamin D content of higher than 2.5 µg/serving to 2.5 µg/serving reduced the total vitamin D intake. While hypothetical fortification at level 5 µg/day for milk or malted drink slightly increased the vitamin D intake, hypothetical fortification of both milk and malted significantly increased the vitamin D intake. This finding is in agreement with a previous study (Madsen et al. [45]) indicated that a 2-strand approach in fortification is more efficient in improving the total vitamin D intake.
A recent randomized controlled trial suggested that 30 µg/day is required to maintain the maternal 25-hydroxyvitamin D (25OHD) concentration of ≥ 50 nmol/L in 97.5% of pregnant women and umbilical cord 25OHD concentration of ≥ 25–30 nmol/L in 95–99% newborn [46]. If the recommended vitamin D intake for pregnant women was set at 30 µg/day, almost all the study participants would not meet this recommended intake. Nonetheless, more evidence is required to demonstrate that maternal vitamin D requirement is higher compared to non-pregnant women.
The study had the limitation as the data was collected in a public hospital in which the study finding may not be generalized to the pregnant women who attend the private hospitals. Owing to limited resources, the sample size of this study is small. In addition, the use of FFQ may underestimate total vitamin D intake as it is subjected to uncertainties owing to many factors that affect estimates of food intake: the depth and nature of probing carried out to obtain the information on food consumption, the ability of a person to recall and estimate their intakes accurately. Nonetheless, the FFQ was administered by only 1 trained interviewer. Therefore, the bias on depth and nature of probing was reduced. In addition, there is a lack of local food composition data for analysis of vitamin D intake, hence food composition data from Singapore was used. Despite these limitations, this study demonstrated that the current status of vitamin D intake based on the latest RNI (RNI 2017). The results on vitamin D intake, adequacy of intake and modelling dietary strategies can inform public health professionals and policymakers to re-evaluate current Malaysian food fortification policies. The findings from this study can provide information for formulating new nutritional recommendations not only to Malaysian population but other population with recent updated DRV/DRI for vitamin D.
Previous local studies showed a mean daily milk intake of 0.5–2 serving for children aged 4–10 yrs old [47] and median malted intake of about 0.6 serving [48]. However, most of the children were reported to have inadequate vitamin D intake, suggesting that milk and malted drinks consumed by the children are poor sources of vitamin D [48]. Thus, it is likely that systemic or mandatory milk could potentially benefit children, one of the vitamin D deficiency at-risk group. However, further studies warrant to access the possibility the fortification strategy to expose other population particularly children with high vitamin D level.
In conclusion, the present study revealed suboptimal total vitamin D intake among Malaysian pregnant women in which more than half of the pregnant women had intake lower than newly updated RNI (RNI 2017) of 15 µg/day. Notably, current food fortification policy is insufficient to ensure pregnant women to achieve the updated RNI for vitamin D, which is 3 folds higher than the former RNI. While the universal provision of supplements is a potential strategy to increase vitamin D intake, the cost incurred, and the compliance should be investigated further. Alternatively, mandatorily fortification of both milk and malted drink would substantially increase mean vitamin D intake in pregnant women and benefit the wider Malaysian population. Nevertheless, the efficacy of these strategies should be validated in randomized controlled trials where the effect of these strategies on circulating maternal 25OHD should be assessed.
 XML Download