

 PDF
PDF Citation
 Print
Print


INTRODUCTION
Overweight and obesity are conditions of energy imbalance in a person. Energy is obtained from food and beverages consumed, and if unused, this reserved energy will be stored in the form of fat. Excess fat in the body causes multiple health problems and results in degenerative diseases. Such individuals are very susceptible to dyslipidemia or the occurrence of fat metabolism abnormalities, characterized by increased indicators including total cholesterol, low-density lipoprotein cholesterol (LDL-C), and triglycerides (TGs), and decreased levels of high-density lipoprotein cholesterol (HDL-C) [1].
Based on the data from the Ministry of Health, Republic of Indonesia (2013), obesity and overweight cases are continuously increasing in the world, both in developing as well as developed countries. In Indonesia, the prevalence of obese events is steadily increasing children. The prevalence of overweight school children has increased rapidly (9.2–18.8%) [2].
A cross-sectional study in Brazil reported that nutritional status (body mass index [BMI]-for-age) is significantly associated with lipid profile of the child. If the child's nutritional status was in the 85th percentile, they had twice the risk of having dyslipidemia [3]. Another study reported that obese children tended to have higher total cholesterol, TGs, and LDL-C levels than those with normal nutritional status [4].
Lipid profile measurement is one of the methods used to predict dyslipidemia in an individual. It was reported that in Indonesia, obese children tend to have higher total levels in the blood than normal nutritional status individuals. Total cholesterol is one of the lipid profile components used in biochemical assessment of the nutritional status. The total cholesterol level is affected by the type of dietary intake. One food that increases the cholesterol levels in blood is a high-fat food. High fat and high calorie foods available around schools are generally sold by local traders. These foods are assumed to be the cause of high fat intake in children, affecting their cholesterol levels caused by eating and snacking habits at school every day [5]. Dyslipidemia cases are associated with the risk of several degenerative diseases such as heart disease and stroke [6]. The risk of dyslipidemia among overweight and obese children is caused by the food consumed, Chiu et al. [7] who explained that a high intake of saturated fat increases the total cholesterol in blood, and a high intake of carbohydrates causes an increase in total cholesterol levels [8].
The nutritional status of obese or overweight children has a shift in energy balance, which is assumed to be caused when their dietary intake is higher than their energy expenditure. Junk food is known to contribute to high energy, imparting a high-energy surge effect, especially in obese and overweight children.
Physical activity is known as a risk factor for dyslipidemia among children [9]. Sedentary physical activity is known to trigger obesity. These types of activities are observed in children that spend little energy, such as using mobile phones and laptops to play games, and watching television. A study stated that sedentary activity in children based on nutritional status was not significantly different, either during the holidays or school days [10]. Brugnara et al. [11] reported that physical activity in the active and sedentary groups show differences between TG and HDL levels.
One step to decrease the incidence of dyslipidemia is through lifestyle intervention. Lifestyle intervention counseling is known to alter an individual's behavior in a better direction, and has a significant effect on the control of lipid profiles [1112]. In a school setting, counseling can be classified into nutrition counseling or education targeting obese and overweight schoolchildren in classical ways, and providing material related to dyslipidemia. A study by Abdallah et al. [13] showed that nutrition education intervention in children with dyslipidemia decreases the lipid profiles (total cholesterol and TG levels). Besides nutrition education, the improvement in dyslipidemia can be achieved by performing physical activity-related interventions [1]. The type of physical activity in question is aerobic exercise [14]. The recommended frequency for aerobic exercise is more than 5 times a week, with an intensity of 40–75% of heart rate reserve (HRR) and an exercise duration ranging from 50–60 min.
Previous studies have had varying results. In one study, the intervention conducted was physical activity intervention given to obese children for 1 month, with 5 types of exercise programs and a 1-h duration for each program a day. The intervention, combined with reduction in energy intake, showed significant results in decreasing the total cholesterol, TGs, and LDL-C levels in obese children [15]. Another study on overweight and obese children conducted by Li et al. [16] in Chanping, Beijing, China, used a non-randomized controlled trial design. The intervention was moderate to vigorous physical activity (MVPA) with a 60-min duration. Second- and third-grade students practiced rope jumping and ball throwing. Sprint, jump rope, and endurance running were practiced by the fourth- and fifth-grade students. The middle school students practiced endurance running (1,000 m for boys and 800 m for girls), high jump, and basketball. The results of the non-randomized controlled trial showed that school-based physical activity intervention in children aged 7–15 yrs for 12 weeks, significantly reduced the prevalence of overweight and obesity, BMI levels, skinfold thickness, and blood fasting glucose levels, and significantly increased MVPA duration. However, no significant differences were obtained in lipid profiles between the intervention and control groups. The current study aims to analyze the effect of nutrition education and traditional game-based physical activity.
SUBJECTS AND METHODS
This research is an experimental study with a split-plot design and randomized block design. The study design was determined owing to the fact that the selected sample cannot be randomized perfectly, due to samples originating from various schools situated in urban areas of the West Java Province of Indonesia. This study was conducted from October 2016 to May 2017, and examines the results of nutrition education interventions and the traditional games of West Java in Indonesia. An ethical clearance permit was obtained from the Faculty of Public Health, Diponegoro University, Semarang Number 271/EC/FKM/2016.
Inclusion and exclusion of samples
The subjects of this study were elementary school students with obese and overweight nutritional status. The z-score of BMI based on the age of children was: range > 1 SD − 2 SD, elementary school, no history of chronic illness, and willingness of parents and students to follow each stage in the intervention process by signing an informed consent after receiving an explanation of the study.
Factors include the independent variables analyzed in the experiment as compilers of the intervention structure. An experimental study is characterized by replication, which is the allocation of certain interventions on several experimental units under uniform conditions [17]. A total of 11 students were used for the replication in each intervention, and 10% of subjects were added to prevent drop-out. Thus, the replication of 12 elementary school children was obtained for each treatment.
Intervention
Nutrition education interventions
Subjects were divided into 2 types of nutrition education interventions: P1 (with nutrition education interventions) and P2 (without nutrition education). Nutrition education is one way to manage the decline in dyslipidemia patients, and includes counseling interventions for improving life behavior by principally initiating changes in a positive direction for controlling the lipid profile [12]. In a more structured setting such as a school, the counseling process is achieved with classical counseling using specific material related to dyslipidemia.
Totally, 9 sessions of the nutrition education intervention process were conducted over 3 months, each lasting for 45 min (January to March 2017). Physical activity interventions were alternately conducted during the same period. These materials of nutrition education were presented every week, consecutively for 9 meetings on 12 weeks.
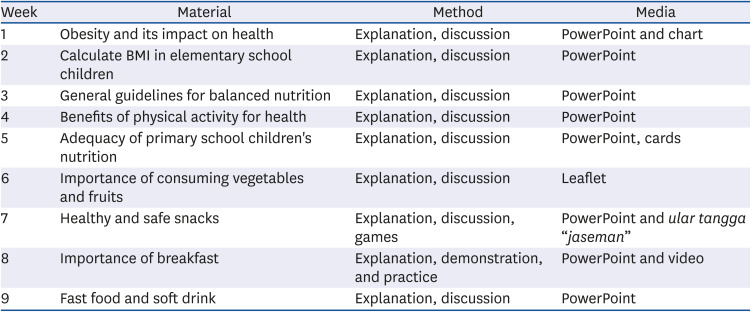
All interventions were conducted outside the study hours, adjusted to the school hours of the subjects. If subjects went to school in the morning, intervention activities were conducted in the afternoon after school ended. The material was adapted to the research concept of obesity and overweight, and was delivered by a trained study team. The direct face-to-face method was used during intervention in the classroom. The instruments used were visual media such as charts, PowerPoint slides, leaflets, and educational game tools (snakes and ladders game and quartet card game). Different materials were given once every week. Messages conveyed by the materials during child nutrition education intervention at school were obesity and its impact on health, BMI calculation for elementary school children, general guidelines of a balanced diet, benefits of physical activity for health, nutritional adequacy of elementary school children, the importance of fruit and vegetable consumption, healthy and safe snacks, and the importance of breakfast, fast food, and soft drinks. Table 1 presents the educational intervention based on counseling material.
Table 1
Counseling material during educational interventions in elementary school students
Physical activity intervention
This intervention was evaluated in 61 male and female subjects in the last section, and was not distinguished by sex. This is based on preliminary studies, measuring the aerobic physical activity and traditional games which are similar in both genders. The physical activities were divided into 3 kinds of intervention: traditional game, aerobic exercise, and no physical activity intervention. Interventions were performed within the 12 weeks experimental period, conducted once a week for 3 months (January to March 2017). The three treatments were performed differently in each school.
Physical activity interventions were divided into 3 different treatment groups: O0 (subjects without physical activity treatment), O1 (gymnastics activity), and O2 (traditional games). The intervention process was not distinguished by sex, after considering that measurement of aerobic physical activity and traditional games do not distinguish by gender. The treatment interventions were carried out as 6 varying processes:
1. P1O2: Receives nutrition education interventions and physical activity of traditional games.
2. P1O1: Receives nutrition education intervention and exercises intervention.
3. P1O0: Receives nutrition education interventions and are not given physical activity interventions.
4. P0O2: Do not receive nutrition education interventions and are given physical activity interventions in traditional games.
5. P0O1: Do not receive nutrition education intervention and are given the physical activity intervention of gymnastics.
6. P0O0: Do not receive nutrition education intervention and are not given intervention in physical activity.
Traditional game activities
The traditional games executed as physical activity intervention in overweight and obese children were galasin, ucing kup, luncat tinggi, and sapintrong/jump rope using rubber bands produced in the West Java Province. These four traditional games were chosen on the results of energy expenditure measurement and high intensity of the games. Galasin is a team game where one team consists of at least 2 people. This game requires a 9 × 4 m2 rectangular field which is divided into 6 parts using chalk. Ucing kup does not require any tools. It only uses the field to play, and is not a team game. The last game used for the intervention was sapintrong, also called as jump rope. Two people hold and stretch the rope from the lowest height to the highest position; i.e., knee, abdomen, shoulder, and head. The highest position was performed by raising the hands. This game is played in teams, with each person taking turns to play for their respective team. If the person is unable to jump over the rope, he fails. The game continues until there is no one left in the group (Fig. 1). Luncat tinggi similar enough with sapintrong, performed by two children by stretching the rope from both sides. The level starts from the lowest height which is knee height until the rope is stretched over the head. If all team members are able to pass the rope, then the game is carried out to the highest level. Usually the height of the rope starts from the knees, stomach, shoulders and head to the level of the raised hand. If it fails, then the team changes to play.

Galasin is categorized as a vigorous-intensity activity which increases the heart rate by 82.4 ± 7.2%, while ucing kup and sapintrong are categorized as moderate-intensity activities. Ucing kup increases the heart rate by 75.5 ± 11%, while sapintrong and luncat tinggi increase the heart rate by 68.1 ± 2.1%. The physical activity intervention was conducted three times a week for a 60-min duration per session. The traditional game intervention was carried out for a 60-min duration consisting of 5-10 min warm-up, 40 min core exercise in the form of the traditional game, and ending with 5–10 min cool down. The World Health Organization (WHO, 2010) recommends that children aged 5–17 yrs should do MVPA aerobic exercise 3 times a week for 60 min [18]. Based on the American Institute for Cancer Research (2014), MVPA is an activity that increases 60-75% of the maximum heart rate using aerobic metabolism [19].
Aerobic exercise intervention
Aerobic exercises were performed three times a week for 30-min per session, consisting of 5-min warm-up, 20-min core exercise, and 5-min cooldown. Selection of the duration for the group receiving the 30-min aerobic exercise intervention was based on the calculation of intensity and energy expenditure that was performed, by measuring the overweight and obese children. The mean increase in heart rate was 65.86 ± 3.7%, while the mean energy expenditure was 149.62 ± 59.66 kcal. The intensity and energy expenditure of traditional West Java games were collected by direct observation in overweight and obese children using a Beurer type PM18 heart rate monitor. Each subject was fitted with a wristwatch measuring device before commencing the activity. Each child measured his heart rate for 60 s before starting an aerobic physical activity or traditional game. After concluding the physical activity, the subject again measured his heart rate, intensity, and energy expenditure using a heart rate monitor. Calculation of the number of steps describes the number of calories expended, while the heart rate describes the categorical intensity of physical activity [9]. The WHO (2010) recommends that children aged 5–17 yrs should perform MVPA or aerobic physical activity 3 times a week for 60 min [18].
Data types and collection methods
Data types of this study are primary data, consisting of measured variables (baseline lipid profile: total cholesterol, TGs, HDL, and LDL) as initial data for intervention, and social demographic variables (parent's name, education, occupation, and parental income) collected as additional information analyzed descriptively.
The research data consisted of responses and confounding variables. The response variable in this study was the measured lipid profile consisting of total cholesterol, TGs, LDL-C, and HDL-C. The measurement of the response variable of blood lipid profiles was performed by collecting blood samples of overweight and obese children before and after the intervention. All blood samples were simultaneously collected in the morning, after fasting 10 h overnight. The confounding variable that significantly affected the lipid profiles in this study was physical activity.
Data collection lipid profile
Total cholesterol, HDL-C, LDL-C, and TG levels were measured through the examination of fasting blood samples. Health personnel from a certified laboratory (Prodia Clinical Laboratory, Surakarta, Indonesia) collected 5 mL of venous blood samples from each subject, stored in tubes, and then put into an icebox to be analyzed in the laboratory. Total cholesterol, HDL-C, LDL-C, and TG levels were analyzed using the enzymatic colorimetric method.
Data processing and analysis
Blood samples collected from the research subjects were evaluated for their lipid profile levels. Data were analyzed based on the cut-off values suggested by the National Heart, Lung and Blood Institute; total cholesterol: acceptable (< 170 mg/dL), borderline (170–199 mg/dL), and high (≥ 200 mg/dL); HDL-C: acceptable (> 45 mg/dL), borderline (40–45 mg/dL), and high (< 40 mg/dL); TGs: acceptable (< 90 mg/dL), borderline (90–129 mg/dL), and high (≥ 130 mg/dL) [20].
The processed data are presented as mean values, standard deviation, and percentages. Descriptive and inferential statistics were used to analyze the data with a significance level of 5%, which shows that the rejection limit of the null hypothesis is P-value < 0.05. The effect of nutrition education and physical activity interventions was determined by analysis of covariance (ANCOVA) followed by Duncan's test, using the SPSS IBM version 21 (IBM Corp., Armonk, NY, USA).
RESULTS
Subject lipid profile: base- and end-line studies
As supporting data, based on the nutritional status of children showed the ANOVA test on a descriptive study of variable lipid profiles changed in baseline and end-line showed on the Table 2, presenting differences obtained in the lipid profile indicators. The results of ANOVA in each category of nutritional status and type of intervention reveals that total cholesterol is significantly not different in each intervention group. Results of the baseline study indicate that total cholesterol of subjects in the P1O1 (184.4 ± 50.3 mg/dL) and P1O0 (181 ± 37.6 mg/dL) groups are in the borderline category, whereas other groups fall in the acceptable category. End-line data shows that only the P1O2 (157.8 ± 32.9 mg/dL) group has lowest total cholesterol compared to other intervention groups.
Table 2
Baseline and end-line lipid profiles of the intervention groups
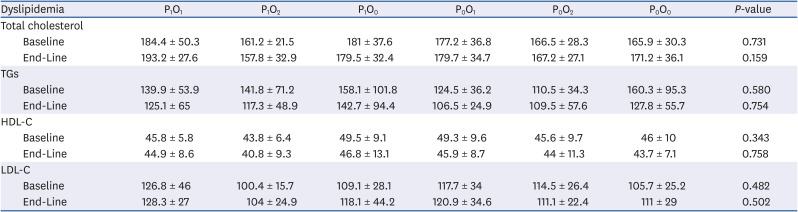
Based on the intervention group, the TG levels in the baseline and end-line studies were significantly not different. The mean TG levels of subjects reveal a decreasing trend at the end of the intervention compared to the baseline (≥ 130 mg/dL), but the results were not significant between the intervention groups (125.1 ± 65,117.3 ± 48.9 mg/dL, 142.7 ± 94.4 mg/dL, 106.5 ± 24.9 mg/dL, 109.5 ± 57.6 mg/dL, and 127.8 ± 55.7 mg/dL, respectively) based on the type of treatment (Table 2).
The HDL-C and LDL-C levels in each intervention group also show no significant difference, either in baseline or end-line values. Only the HDL-C levels in the P1O2 group are categorized as borderline. However, a decreasing trend is observed after the 3-month intervention, but is less significant in all intervention groups. The LDL-C levels in all intervention groups at the baseline and end-line belong to the borderline category.
Total cholesterol
Overweight and obese children are known to be at risk of having abnormal blood lipid profiles. One aim of this study was to prove the hypothesis that nutrition education and physical activity interventions exert significant effects on the blood lipid profiles (total cholesterol, TGs, HDL-C, and LDL-C). The results of this study indicate that the mean total cholesterol in all groups before intervention falls in the borderline category, and only P0O2 and P1O2 groups were in the acceptable category. The mean total cholesterol of each group was observed to increase at the end of the intervention, except for one group (P1O2) that showed decreased total cholesterol. The ANCOVA test is carried out to test the variables that most influence the reduction in total cholesterol. The results obtained indicate that the end-line total cholesterol levels in each intervention group are determined by the baseline total cholesterol levels (P < 0.0001).
The mean TG levels in each intervention group were in the borderline and high categories before intervention, with the P0O0 group having high TG level. The TG levels in the intervention groups showed a decreasing trend at the end of the intervention, and only the P0O2 group had increased TG levels. The results of ANCOVA reveal that the end-line TG levels in each intervention group were determined by the baseline TG levels (P < 0.0001).
The baseline LDL-C levels in the intervention groups were in the borderline and acceptable categories. The groups having acceptable LDL-C levels were P1O2 and P0O0. The LDL-C levels in each group tended to increase at the end of the intervention, except for the P0O2 group. The results of ANCOVA indicated that the end-line LDL-C level in each intervention group was determined by the baseline LDL-C level (P < 0.0001).
The mean HDL-C levels at the baseline in each intervention group belonged to the acceptable category, and only the P1O2 group belonged to the borderline category. The HDL-C levels in all intervention groups decreased at the end of the intervention. The results of ANCOVA showed that the end-line HDL-C level in each intervention group was determined by the baseline HDL-C level (P < 0.0001).
Nutrition education intervention for subjects (effects of nutritional education interventions on changes in lipid profile)
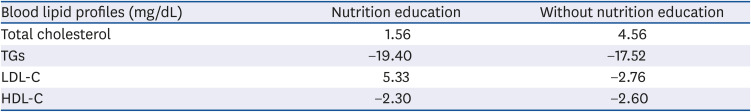
Overweight and obese children usually have high total cholesterol levels than normal children, due to greater consumption of food. One objective of nutrition education intervention was to provide knowledge about healthy and balanced nutrition, based on the general guidelines for balanced nutrition. Thus, after receiving information on balanced nutrition, the subjects were expected to apply the gained knowledge in their daily nutrition practices. The total cholesterol in the group receiving nutrition education intervention did not decrease, but tended to increase by 1.56 mg/dL, whereas the increase in total cholesterol in the group not receiving nutrition education (4.56 mg/dL) was higher than those receiving nutrition education (Table 3).
Table 3
Improvement of the response variables of blood lipid profiles based on nutrition education intervention
| Blood lipid profiles (mg/dL) | Nutrition education | Without nutrition education |
|---|---|---|
| Total cholesterol | 1.56 | 4.56 |
| TGs | −19.40 | −17.52 |
| LDL-C | 5.33 | −2.76 |
| HDL-C | −2.30 | −2.60 |
The intervention of nutrition education after 9 sessions in 12 weeks (± 3 months) interspersed with physical activity interventions, showed no significant results in the process of reducing cholesterol levels in obese and overweight children.
Duncan's test proved that there was no significant difference in the decrease in total cholesterol between the group receiving nutrition education and group not receiving nutrition education. These results differ from the study conducted by Abdallah et al. [13], who reported that nutrition education intervention conducted for 3 months in children with dyslipidemia in Cairo decreases the total cholesterol at the end of the intervention.
Physical activity intervention for subjects (effect of physical activity on changes in the lipid profile)
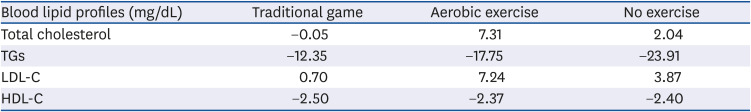
Traditional game-based physical activity intervention resulted in decreased total cholesterol levels in overweight and obese subjects. Total cholesterol levels of the subjects receiving the traditional game-based physical activity intervention decreased by 0.05 mg/dL at the end of the intervention. Meanwhile, total cholesterol levels in the group receiving aerobic exercise intervention, and the group not receiving exercise intervention, tended to increase at the end of the experiment (Table 4).
Table 4
Improvement of the response variables of blood lipid profiles based on physical activity intervention
| Blood lipid profiles (mg/dL) | Traditional game | Aerobic exercise | No exercise |
|---|---|---|---|
| Total cholesterol | −0.05 | 7.31 | 2.04 |
| TGs | −12.35 | −17.75 | −23.91 |
| LDL-C | 0.70 | 7.24 | 3.87 |
| HDL-C | −2.50 | −2.37 | −2.40 |
Results of Duncan's test indicate that even though the total cholesterol level in the traditional game group decreased, it was not significantly different from the aerobic exercise and no-exercise groups. These results are in line with the study results of Li et al. [16], who examined the 3-month school-based physical activity intervention. They reported that total cholesterol levels of the intervention group were significantly not different from the control group.
Total cholesterol level of children can be affected by several factors, such as physical activity and food consumption. Dietary fiber intake reduces cholesterol absorption, and water-soluble fiber binds fat in the intestine, thereby reducing blood cholesterol levels by 5% or more [20].
DISCUSSION
Nutrition education is an intervention aimed at changing behavior and habits, one of which is the behavior of eating or food habits. The eating habits of an individual who usually consumes fast food, is slowly altered to eating healthy foods.
TGs are a type of fat found in the blood and various organs of the body. TGs are formed from glycerol and fat derived from food with insulin stimulation, or by excess calories due to overeating. The nutrition education intervention could help decrease the TG levels in overweight and obese subjects. The decrease in TG levels in the group receiving nutrition education intervention was 19.40 mg/dL, while the group not receiving the intervention showed 17.52 mg/dL decrease (Table 3). This result was similar to results obtained by Abdallah et al. [13], who reported that nutrition education given to people with dyslipidemia reduces the TG levels at the end of intervention.
Duncan's test proved that nutrition education and physical activity interventions exerted no significant effects on the TG response variable. The lack of significant difference could possibly be that the group not receiving nutrition education also showed decreased TG levels. The result was similar to the study results of Li et al. [16] who found that mean TGs in the intervention group and the control group were not significantly different.
Statistical test results also showed that the decrease in TG levels in traditional game intervention subjects is not significantly different. This could be attributed to the level of compliance, meaning that the subject has a low level of compliance. Based on baseline data, around 59% of subjects showed < 4 times more exercise intensity in the past month. When compared to each survey group, more than 50% indicated that overweight and obese children had very poor exercise habits. In addition to the exercise habits of subjects, the level of adherence to nutrition education interventions and physical activity is thought to be due to the child's low self-motivation [9].
The traditional game-based physical activity intervention successfully decreased the TG levels in overweight and obese children at the end of the intervention. The TG levels in the traditional game intervention group decreased by 12.35 mg/dL, while the TG levels in the aerobic exercise group decreased by 17.75 mg/dL. In the non-exercise group, the decrease in TG levels was the highest (23.91 mg/dL), compared to the traditional game and aerobic exercise groups (Table 4).
LDL-C is also known as ‘bad cholesterol’ because elevated LDL-C levels in the blood are known to cause plaque formation in blood vessels, which eventually increases the risk of heart disease [21]. Nutrition education intervention conducted on overweight and obese subjects had not been successful in decreasing the LDL-C levels. This result is presented in Table 4, and indicates that the LDL-C levels at end of the intervention tends to increase in both groups: those receiving and those not receiving nutrition education intervention.
The traditional game-based physical activity intervention conducted on overweight and obese subjects for 12 weeks had no effect in decreasing LDL-C levels. In fact, the LDL-c tended to increase at the end of the intervention. However, from our observation, the increase in LDL-C levels in the traditional game group was lower than the aerobic exercise and non-exercise groups. The increase in LDL-C levels in the traditional game and aerobic exercise groups was 0.70 and 3.87 mg/dL, respectively. The highest increase (7.24 mg/dL) was found in the non-exercise group (Table 4).
Duncan's test proved that nutrition education and physical activity interventions exerted no different effect on the LDL-C response variable, possibly because LDL-C levels increased at the end of the intervention in all groups. This result was in line with the study results of Li et al. [16], who reported that mean LDL-C levels in the intervention and control groups were not significantly different.
LDL-C levels of children are affected by several factors, such as dietary intake, obesity, and heredity. This study shows that the intake of energy, protein, fat, and carbohydrates has no significant association with LDL-C levels in overweight and obese children.
The elevated LDL-C levels at the end of intervention might be due to the nutritional status and body fat composition at the end of the intervention. The results of data processing indicate that nutritional status and body fat composition has no significant relationship with the elevated cholesterol levels in overweight and obese children. The heredity factor was not examined in this study, and could possibly explain the elevated LDL-C levels obtained at the end of the study.
HDL-C is often called the ‘good cholesterol’ because it protects from the risk of heart disease. Its levels can be increased through exercise. A study by Hengkengbala et al. [22] found that 3-week static cycling with an exercise intensity of three times a week increases the HDL-C levels in overweight men.
The 12-week nutrition education intervention conducted on overweight and obese children was unable to increase HDL-C levels, with levels in overweight and obese children showing a tendency to decrease. Despite the decline, the decrease in HDL-C levels in the group receiving nutrition education intervention was lower than the group not receiving nutrition education (Table 3).
The physical activity intervention conducted in this study also could not increase the HDL-C levels in overweight and obese children. The HDL-C levels in each intervention group tended to decrease at the end of the intervention. The highest decrease (2.5 mg/dL) in HDL-C levels was found in the traditional game group (Table 4).
Duncan's test proved that nutrition education and physical activity interventions exert no difference on the HDL-C response variable. This result was similar to results obtained by Li et al. [16], who found that the mean HDL-C levels in the intervention and the control groups were significantly not different. However, the result of this study was different from several other studies conducted. A literature review conducted by Paes et al. [23] revealed that exercise intervention helps increase HDL-C levels.
Nutrition education interventions imparted are expected to change the knowledge, attitudes, and nutritional practices of children, to ultimately affect their eating habits. The intervention of physical activity undertaken is expected to increase the duration of physical activity in children, so that a positive energy balance due to too much intake can be balanced with the energy expended through physical activity.
Compliance of children to participate in nutrition education intervention programs and physical activity is expected to be the key to the success of nutrition and health improvement programs for overweight and obese children. The possible reason why the results obtained were not significant might be due to the compliance in this study regarding the level of attendance of children in the intervention program by the schedule given and agreed upon between researchers, teachers (schools), and parents.
The nutrition education and physical activity interventions in this study showed no significant effect on improving the blood lipid profiles in overweight and obese children. The insignificant effect of nutrition education intervention on the improvement of blood lipid profiles in overweight and obese children might be caused by the frequency of intervention, which was performed only once a week in the 9-week study period. The results of this study also showed that the compliance level of children participating in nutrition education intervention was 84.1 ± 19.6%. The results of a study by Hardy et al. [24] reported that the nutrition education intervention conducted twice a week with a 13-week intervention period improves the total cholesterol, TGs, LDL-C, and HDL-C levels.
The physical activity intervention showed no significant effect in improving blood lipid profiles since the frequency of physical activity performed by the subjects was lacking. In the implementation of this study, the physical activities (either aerobic exercise or traditional games) were performed three times a week, with 30-min duration for aerobic exercise and 60-min duration for the traditional game. The American College of Sports Medicine recommends that to maximize energy expenditure, physical activity therapy for people with dyslipidemia should be performed with a frequency of more than five times a week, with a duration of 30–60 min or 50–60 min [14]. The recommended exercise intensity is 40–75% of HRR. This study merely combined the nutrition education and physical activity interventions, which could be a possible cause of the insignificant effect of physical activity intervention on blood lipid profile improvement. The method used in this study was different from the previous study conducted by Zlatohlávek et al. [15], who combined physical activity intervention with reduction of energy intake, thereby successfully decreasing the total cholesterol, TGs, and LDL-C levels in obese children.
In the current study, nutrition education and traditional game-based physical activity interventions were unable to improve blood lipid profiles in overweight and obese children. Even though total cholesterol and TGs tended to decrease at the end of the interventions, the results were not significantly different from other intervention groups. It is necessary to increase the time of physical activity intervention to maintain the lipid profile in another study.
 XML Download