

 PDF
PDF Citation
 Print
Print


INTRODUCTION
Adipogenesis is caused by the proliferation of adipose tissue through hyperplasia and hypertrophy, which increase the number and size of adipocytes [1]. To receive the nutrients and oxygen necessary for the differentiation of adipocytes, extensive changes in extracellular matrix (ECM) remodeling have been reported [2]. Vascular endothelial growth factor (VEGF) and matrix metalloproteinases (MMPs), angiogenic factors, have an important role in the initiation of angiogenesis [34]. VEGF induces endothelial cell proliferation and vascular permeability [5]. Although VEGF binds to receptors in both vascular endothelial growth factor receptor (VEGFR) 2 and VEGFR-1, VEGFR-2 is the primary signaling receptor for VEGF [6]. MMPs are proteases that break down various components in the ECM, such as collagen, laminin, and fibronectin [7]. A recent study reported that MMP promotes the binding of VEGF and its receptors in endothelial cells, consequently increasing endothelial cell differentiation [4]. These findings suggest a potential mechanism for the regulatory role of MMPs in adipogenesis and angiogenesis of adipocytes [7].
Quercetin is a flavonoid commonly present in onion peels, wine, and tea [8]. Quercetin is known to be effective in controlling anti-inflammatory, antioxidant, and immune responses [8910]. Quercetin treatment in adipocytes activates the apoptosis pathway through AMP-activated protein kinase (AMPK) regulation [11] or inhibits the expressions of adipocyte differentiation transcription factors such as peroxisomal proliferator-activated receptors (PPAR)-γ, CCAAT/enhancer-binding protein (C/EBP) α, fatty acid-binding protein 4, and adipocyte protein 2 (aP2) [12]. On the other hand, quercetin has been reported to inhibit the metastasis of cancer cells by reducing the expression of MMP-2 and MMP-9 in cancer cells [13141516]. Thus, it can be hypothesized that if the activity of MMPs in adipocytes by quercetin can be inhibited, then the angiogenesis process is associated with adipocyte differentiation. To date, however, there have been no reports on the relationship between quercetin and angiogenesis (or MMPs activity) in adipocytes. Therefore, the purpose of this study was to elucidate the mechanism associated with the anti-obesity effects of quercetin, which include the inhibition of angiogenesis and MMP activity.
Go to : 
MATERIALS AND METHODS
Materials & reagents
Quercetin and all reagents were purchased from Sigma (St. Louis, MO, USA). For reagents not purchased from Sigma, the sources such as the company name, company location, and country have been specified. Dulbecco's modified Eagle's medium (DMEM), bovine serum albumin (BSA), penicillin/streptomycin (P/S), trypsin-ethylenediaminetetraacetic acid (EDTA), fetal bovine serum (FBS) were purchased from WelGENE (WelGENE, Daegu, Korea) [17]. SYBR Green PCR Master Mix (Applied Biosystem, Foster City, CA, USA) and HiSenScript™ RH[−] RT PreMix Kit (iNtRON Biotechnology, Seongnam, Korea) were also purchased.
Cell culture
The 3T3-L1 cells (Korean Cell Line Bank, Seoul, Korea) used in this experiment were mouse-derived preadipocytes. Cells were incubated with media containing DMEM, 10% BSA, 100 U/mL penicillin/streptomycin. After 2 days, when the cells attained 70–80% confluence, the cells were washed twice with PBS and subcultured by treatment with trypsin-EDTA; the media were replaced every 2 days [17]. To differentiate cells into adipocytes, 3T3-L1 cells were cultured in a differentiation media containing DMEM, 10% FBS, P/S, 1 μM dexamethasone (Dex), and 0.5 mM isobuthylmethylxanthine. After differentiation, adipocytes were maintained in post-differentiation media consisting of DMEM, 10% FBS, P/S, and 10 μg/mL insulin. Quercetin was dissolved in 99.9% ethyl alcohol and diluted in post-differentiation media at concentrations of 0, 5, 10, or 20 μM.
Cell proliferation
The 3-(4,5-dimethylthiazol-2-yl)-2,5-diphenyltetrazolium bromide (MTT) assay (Duchefa Biochemie, Haarlem, The Netherlands) was used to observe the degree of cell proliferation according to the concentration of quercetin [17]. After differentiation of adipocytes, the MTT assay was performed at 0 h before quercetin treatments and at 24, 48, and 96 h after quercetin treatments at concentrations of 0, 5, 10, or 20 μM. Culture media were changed once every 2 days. The experiment was independently repeated 3 times.
Glycerol-3-Phosphate Dehydrogenase (GPDH) activity
A GPDH Assay Kit (Abcam, Cambridge, United Kingdom) was used to measure GPDH activity. The cells are collected and spun-down for 24 h after treatment with various concentrations of quercetin. After removing the supernatant, 200 μL of the GPDH buffer included in the assay kit were added and the mixture homogenized. After centrifugation, the supernatant was collected and incubated at 37°C for 30 min in accordance with the assay procedure. Absorbance was measured at 450 nm with a microplate reader (Infinite 200, Groedig, Austria). The experiment was independently repeated three times.
mRNA expressions of transcription factors related to adipocyte differentiation
Total mRNA expressions of genes related to adipocyte differentiation were determined by performing real-time polymerase chain reaction (PCR) as previously described [1718]. The reagents (Tri reagent, chloroform, and isopropanol) were purchased from Sigma. Quercetin diluted with post differentiation media at concentrations of 0, 5, 10, or 20 μM were added to adipocytes. After 24 h, the culture solution was removed, washed, and 1 mL of Tri reagent was added. Then, the cells were collected, 200 μL of chloroform was added, and the mixture was centrifuged. The supernatant was combined with 500 μL of isopropanol, left at room temperature for 10 min, then centrifuged for 15 min. After washing and drying the obtained pellet, RNase-free dH2O was added, and RNA purity and concentration were calculated at 260/280 nm using a microplate reader (Infinite 200).
To obtain cDNA, HiSenScriptTM RH[−] RT PreMix Kit (iNtRON Biotechnology) and RNase-free dH2O were added to a sample to achieve a total of 20 μL. The reaction was carried out at 85°C for 10 min. After dispensing the cDNA sample into a strap tube, nuclease-free water, 2X SYBR green Master mix, and primers (Table 1) were added. Using the reverse transcription-polymerase chain reaction (RT-PCR) system (version 2.1; Applied Biosystems, Foster City, CA, USA), samples were activated with 95°C for 10 min, 95°C for 15 min, 60°C for 1 min, 95°C for 15 min, 60°C for 1 min, and 95°C for 15 min for 40 cycles, which were repeated twice. The analysis was conducted using the ΔΔCT method. The experiment was independently repeated three times.
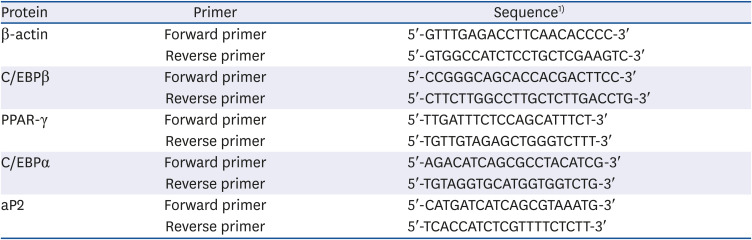
Table 1
Primer sequences of transcription factors related to adipogenesis
C/EBP, CCAAT/enhancer-binding protein; PPAR-γ, peroxisome proliferator-activated receptor-γ; aP2, adipocyte protein 2.
1)T, thymine; A, adenine; C, cytosine; G, guanine.
![]()
Neovascularization factors and MMPs mRNA expression
The mRNA expressions of VEGFs and MMPs, which have an important role in angiogenesis, also determined by performing real-time PCR in the same way as above. Forward and reverse primers were conducted as shown in Table 2. The experiment was independently repeated 3 times.
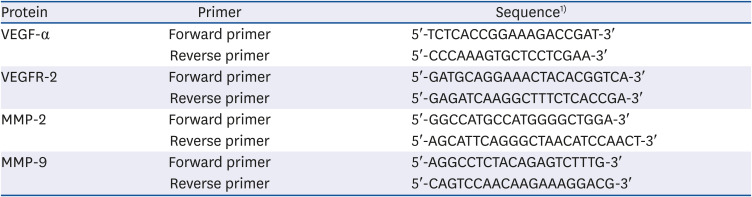
Table 2
Primer sequences for transcription factors related to angiogenesis
VEGF, vascular endothelial growth factor; VEGFR, vascular endothelial growth factors receptor; MMP, matrix metalloproteinase.
1)T, thymine; A, adenine; C, cytosine; G, guanine.
![]()
Concentration and activity of MMPs
After preadipocyte differentiation, adipocytes were treated with 0, 5, 10, or 20 μM of quercetin and incubated for 24 h. Then, the culture solution was collected in a tube and centrifuged at 3,000 r/min at 4°C for 10 min. The supernatant was used for the assay of MMP concentrations and was performed by using the Mouse MMP2 ELISA Kit (LSBio, Seattle, WA, USA) and the Mouse MMP9/Gelatinase B ELISA Kit (LSBio). To measure MMP activity, the above supernatant was transferred into centrifugal filter units (Merck Millipore, Billerica, MA, USA) and concentrated at 3,500 r/min at 4°C for 30 min. MMP activity was measured using the MMP-2 colorimetric drug discovery kit and the MMP-9 colorimetric assay kit (Both from Enzo Life Science, Farmingdale, NY, USA). The experiment was independently repeated 3 times.
Statistical analysis
The experiments within this study were independently repeated three or more times, and the statistical analysis was conducted using SPSS Statistics (version 23; IBM, Armonk, NY, USA). The results are expressed as mean and standard error values. After analysis of variance, a post-test was conducted using Duncan's multiple range test to verify differences between groups, with significance accepted at the P < 0.05 level.
Go to :
RESULTS
MTT assay
MTT assays were performed to observe the degree of proliferation of adipocytes. When quercetin was treated with 0, 5, 10, or 20 μM, there were no significant differences in cell proliferation until 24 h of incubation time, but after 48 h, cell proliferation was decreased by the 20 μM quercetin treatment (Fig. 1). Thus, to determine the effect of quercetin in a cell-state that does not affect cell proliferation, the following experiments were conducted with a quercetin treatment time of 24 h.
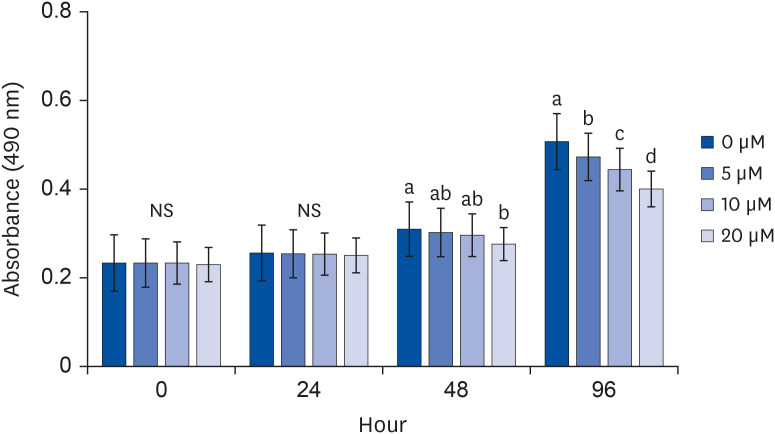 | Fig. 1Effect of quercetin on cell proliferation in 3T3-L1 cells.After differentiation induction, as described in Methods, a cell monolayer was incubated in post-differentiation medium with 0, 5, 10, or 20 μM quercetin. Viable cell numbers were estimated by MTT assay at 0, 24, 48, and 96 h after quercetin treatments. Each bar represents the mean ± SE. Comparisons among different concentrations of quercetin that produced significant differences (P < 0.05) are indicated by different letters above each bar.
MTT, 3-(4,5-dimethylthiazol-2-yl)-2,5-diphenyltetrazolium bromide.
|
GPDH activity assay for fat accumulation
Whether lipid formation during adipocyte differentiation was inhibited by quercetin treatment was investigated (Fig. 2). Quercetin was treated at 0, 5, 10, or 20 μM concentrations, and GPDH activity decreased with the increase in quercetin concentration, but the only statistically significant difference was between control and 20 μM quercetin-treated samples (P < 0.05).
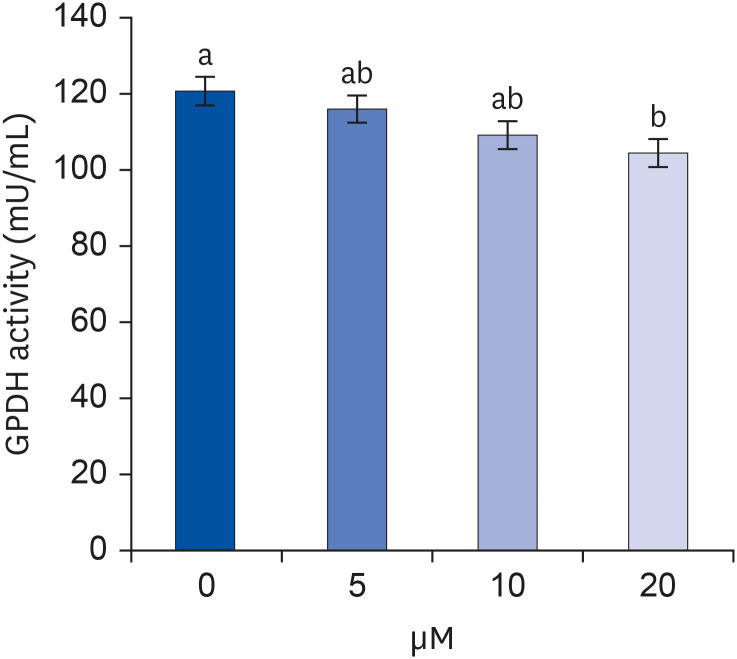 | Fig. 2Effect of quercetin on GPDH activity in 3T3-L1 cells.After differentiation induction, the cell monolayer was incubated in post-differentiation medium with 0, 5, 10, or 20 μM quercetin for 24 h. GPDH activity was estimated by using a commercial GPDH activity assay kit. Each bar represents the mean ± SE. Comparisons among different concentrations of quercetin that produced significant differences (P < 0.05) are indicated by different letters above each bar.
GPDH, glycerol-3-phosphate dehydrogenase.
|
mRNA expressions of transcription factors related to adipocyte differentiation
The mRNA expressions of C/EBPα, PPAR-γ, and aP2 decreased in a quercetin concentration-dependent manner compared to that in the control treatment (0 μM quercetin). Compared to the control, the C/EBPα mRNA expression was significantly decreased to 22.4%, 84.3%, and 94.6% levels under 5, 10, and 20 μM quercetin treatments, respectively (P < 0.05) (Fig. 3). The C/EBPβ expression was also significantly decreased by quercetin treatment, but the decreases were not concentration-dependent. With 5 and 10 μM quercetin treatment, C/EBPβ mRNA expressions decreased by 38.3% and 43.6%, respectively, compared to the control group, but there was no significant difference between the decreases in those two treatment groups. Treatment with 20 μM quercetin significantly reduced C/EBPβ mRNA expression (65.1% reduction) compared to the control group (P < 0.05). Compared to the control group, the mRNA expressions of PPAR-γ following 5, 10, and 20 μM quercetin treatments were significantly reduced by 34.7%, 70.5%, and 86.1%, respectively, indicating quercetin dose-dependency (P < 0.05). The mRNA expression of aP2 was significantly reduced from that in the control group in a quercetin dose-dependent manner (39.1%, 78.2%, and 93.9%; P < 0.05).
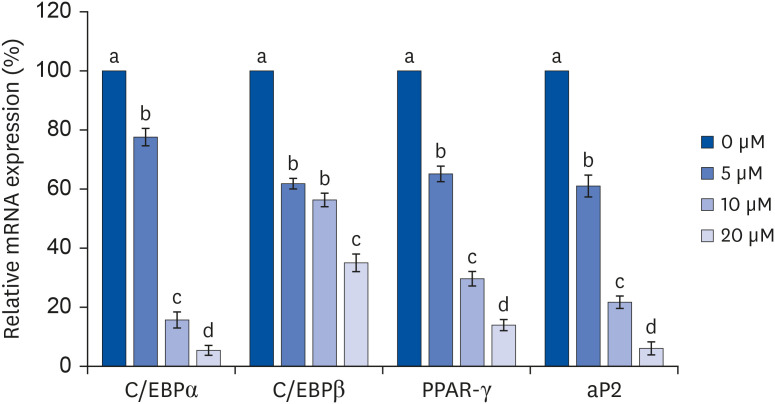 | Fig. 3Effect of quercetin on C/EBPα, C/EBPβ, PPAR-γ, and aP2 mRNA expressions in 3T3-L1 cells.After differentiation induction, the cell monolayer was incubated in post-differentiation medium with 0, 5, 10, or 20 μM quercetin for 24 h. Total RNA was isolated, and real-time PCR was performed. β-actin levels were compared, acting as the equal loading control. Each bar represents the mean ± SE. Comparisons among different concentrations of quercetin that generated significant differences (P < 0.05) are indicated by different letters above each bar.
C/EBP, CCAAT/enhancer-binding protein; PPAR, peroxisomal proliferator-activated receptors; aP2, adipocyte protein 2; PCR, polymerase chain reaction.
|
mRNA expressions of vascular remodeling factors related to adipogenesis
The mRNA expressions of VEGF-α and VEGFR-2 were significantly reduced in a quercetin dose-dependent manner (Fig. 4). When quercetin was treated at 0, 5, 10, and 20 μM concentrations for 24 h, the mRNA expressions of VEGF-α were significantly reduced by 34.9%, 70.7%, and 89.5%, respectively, compared to the control (P<0.05), while the mRNA expression of VEGFR-2 was decreased by 30.2%, 64.6%, and 89%, respectively (P < 0.05).
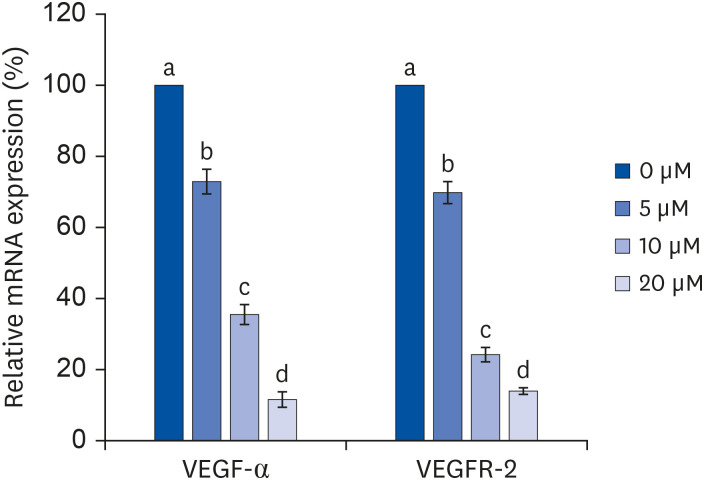 | Fig. 4Effect of quercetin on VEGF-α and VEGFR-2 mRNA expressions in 3T3-L1 cells.After differentiation induction, the cell monolayer was incubated in post-differentiation medium with 0, 5, 10, or 20 μM quercetin for 24 h. Total RNA was isolated, and real-time PCR was performed. β-actin levels were compared, acting as the equal loading control. Each bar represents the mean ± SE. Comparisons among different concentrations of quercetin that produced significant differences (P < 0.05) are indicated by different letters above each bar.
VEGF, vascular endothelial growth factor; VEGFR, vascular endothelial growth factor receptor; PCR, polymerase chain reaction.
|
MMP-2 and MMP-9 mRNA expressions in the quercetin-treated groups were also decreased in a quercetin concentration-dependent manner (MMP-2: 57.9%, 80.9%, and 90.1%; MMP-9: 38.7%, 77.8%, and 91.8%) compared to the control treatment (0 μM quercetin; P < 0.05) (Fig. 5).
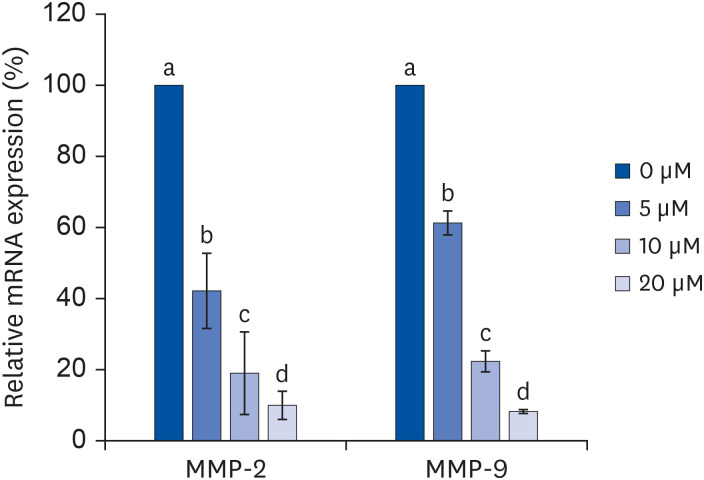 | Fig. 5Effect of quercetin on MMP-2 and MMP-9 mRNA expressions in 3T3-L1 cells.After differentiation induction, the cell monolayer was incubated in post-differentiation medium with 0, 5, 10, or 20 μM quercetin for 24 h. Total RNA was isolated, and real-time PCR was performed. β-actin levels were compared, acting as the equal loading control. Each bar represents the mean ± SE. Comparisons among different concentrations of quercetin that resulted in significant differences (P < 0.05) are indicated by different letters above each bar.
MMP, matrix metalloproteinase; PCR, polymerase chain reaction.
|
Enzyme activity and concentrations of MMP-2 and MMP-9
The enzyme activity of MMP-2 and MMP-9 were decreased significantly as the concentration of quercetin increased (P < 0.05) (Fig. 6). Following the treatment by 5 μM quercetin, the enzyme activities of both MMP-2 and MMP-9 decreased significantly compared to the control. At all quercetin concentrations, the MMP-2 concentration decreased to a greater extent than that of MMP-9.
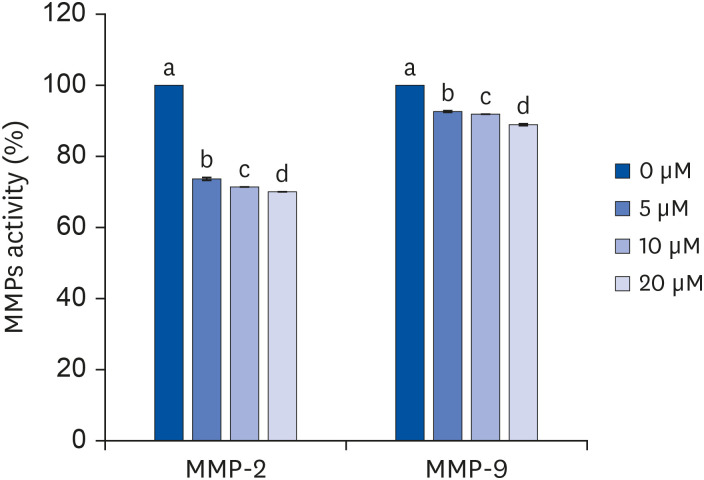 | Fig. 6Effect of quercetin on activity of MMP-2 and MMP-9 in 3T3-L1 cells.After differentiation induction, the cell monolayer was incubated in post-differentiation medium with 0, 5, 10, or 20 μM quercetin for 24 h. The MMP-2 and MMP-9 activity levels were estimated by colorimetric assay. Each bar represents the mean ± SE. Comparisons among different concentrations of quercetin that produced significant differences (P < 0.05) are indicated by different letters above each bar.
MMP, matrix metalloproteinase; PCR, polymerase chain reaction.
|
The concentration of MMP-2 decreased according to the concentration of quercetin treatment, and statistical significance of the decrease was observed following the 10 μM quercetin treatment. Following 20 μM quercetin treatment, the concentration of MMP-2 decreased the most compared to that in the control group. In the case of MMP-9, quercetin treatment at 10 μM (P < 0.05) and 20 μM (P < 0.05) significantly decreased the MMP-9 concentration compared to that after the 5 μM quercetin treatment. There was no significant difference between the decreases following the 10 and 20 μM quercetin treatments (Fig. 7).
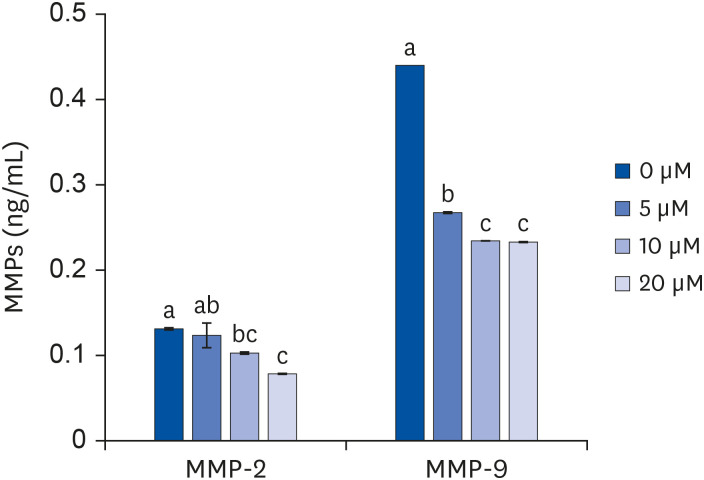 | Fig. 7Effect of quercetin on concentrations of MMP-2 and MMP-9 in 3T3-L1 cells.After differentiation induction, as described in Methods, the cell monolayer was incubated in post-differentiation medium with 0, 5, 10, or 20 μM quercetin for 24 h. The MMP-2 and MMP-9 concentrations were estimated by using ELISA kits. Each bar represents the mean ± SE. Comparisons among different concentrations of quercetin that resulted in significant differences (P < 0.05) are indicated by different letters above each bar.
MMP, matrix metalloproteinase; PCR, polymerase chain reaction.
|
Go to :
DISCUSSION
Adipose tissue is highly vascularized, and each adipocyte is nourished by an extensive capillary network [1]. The development of obesity is associated with extensive adipose tissue modifications associated with adipogenesis and angiogenesis through ECM remodeling [23]. Degradation of the ECM is reported to be the first step in the angiogenic process and MMPs, especially MMP-2 and -9 have important roles in this process [456]. Few studies are available regarding quercetin's role in regulating the angiogenic processes and the degradation of the ECM, especially during adipocyte differentiation [13141516]. Therefore, this study aimed to investigate whether quercetin inhibits fat accumulation in 3T3-L1 adipocytes and determine if its mechanism is related to inhibition of VEGF or MMP activity.
In this study, there was no significant difference in adipocyte viability at all quercetin concentrations after 24-h treatments, compared to the control group. Thus, in this study, to avoid affecting adipocyte survival, quercetin was treated to adipocytes for 24 h. Previous in vitro studies have been performed with various quercetin doses (10 to 500 µM) [12131415161718]. Harwood et al. [19] reported that a 34 µM quercetin treatment was the minimum dose that produced and experimental effect without showing toxicity in mouse lymphoma L5178Y cells. In addition, a 10 µM or more quercetin treatment showed statistically significant reductions in fat accumulation in mature adipocytes [20]. Based on previous research, the maximum treatment concentration of quercetin used in this study was set at 20 μM. In this study, 20 µM quercetin treatment and 48-h incubation and all quercetin concentrations after 96-h incubation, produced decreased adipocyte viability compared to that of the control group, but it does not indicate adipocyte death. This indicates that quercetin exerts an anti-obesity effect by inhibiting adipocyte proliferation in preadipocytes and by reducing the number of adipocytes in mature adipose tissue [21].
In this study, to observe the effect of quercetin treatment on the accumulation of fat, the enzyme activity level of GPDH was determined. GPDH activity was significantly decreased, compared to the control group, with the 20 μM quercetin treatment (P < 0.05). Triglyceride synthesizes via an ester reaction between activated fatty acids and glycerol-3-phosphate. In adipose tissue and muscles, glycerol-3-phosphate is generated by the action of GPDH from glucose (as a form of dihydroxyacetone phosphate). In several studies, GDPH activity and its expression levels have been used as indicators of adipocyte differentiation or fat accumulation in cells [1720212223].
In this study, quercetin reduced the expressions of transcription factors (C/EBPα, C/EBPβ, PPAR-γ, and aP2) specifically expressed in adipocyte differentiation, thereby inhibiting fat production in adipocytes. PPAR-γ regulates adipocyte differentiation with co-expressions of members of the C/EBP family [1215]. C/EBPα expression is induced at later stages and is active in mature adipocytes, while C/EBPβ is expressed in the early stage of adipocyte differentiation [24]. The gene aP2 is overexpressed in mature adipocytes; aP2 acts like adipokine regulating metabolism in the late stage of differentiation [12]. Previous studies have shown that quercetin treatment reduced the production of triglycerides in adipocytes by suppressing the expression of C/EBPα, C/EBPβ, PPAR-γ, and aP2 [111222].
It has been suggested that adipogenesis (formation of adipocytes) is related to angiogenesis (formation of new blood vessels) [23456]. Many studies reported that activation of MMPs results in the up-regulation of VEGFR-2 expression, activated VEGF-α by increasing the binding of VEGFR-2 to VEGF-α, thereby enhancing the proliferative responses in endothelial cells [4513] and 3T3-L1 adipocytes [122526272829]. Therefore, angiogenesis inhibitors are thought to be useful indicators when treating obesity and obesity-related diseases. However, there have been no reports on the relationships between quercetin and MMPs, VEGFs, or angiogenesis in 3T3-L1 adipocytes.
In this study, as the quercetin treatment concentration increased, the concentrations of MMPs decreased, and MMP enzyme activity was inhibited. Based on the RT-PCR assay results, the mRNA expressions of MMPs were inhibited in a quercetin concentration-dependent manner. During the differentiation of adipocytes, the synthesis and release of MMP-2 and MMP-9 are continuously at high levels, and adipocyte differentiation is activated [30]. In this study, the concentrations of MMPs were lowered by quercetin treatment, indicating that the synthesis and release of MMPs in adipocytes were inhibited; thus, MMPs enzyme activities and mRNA expressions of MMPs were decreased, suggesting that both adipocyte differentiation and angiogenesis were inhibited. This result is supported by additional results of this study that showed the inhibition of fat accumulation, resulting in decreased gene expressions of C/EBPα, C/EBPβ, PPAR-γ, and aP2, as well as gene expressions of VEGF-α and VEGFR-2, which are vascular endothelial growth factors, by quercetin treatment. Therefore, the inhibition of MMPs by quercetin could be a regulator of obesity, suggesting that quercetin may contribute to adipogenesis and angiogenesis during the development of obesity.
A typical dietary intake of quercetin is about 20 to 1,000 mg/day, and humans who consume enough fruits and vegetables may consume up to 250 mg of quercetin daily [31]. In several human or rodent studies, a quercetin intake of 20–50 mg/day resulted in a quercetin plasma concentration of 0.1 to 2 µM [193233]. Several clinical trials have reported that 150–500 mg/day of high purity quercetin can be consumed for a long period (up to 3 mon) without side effects [313435]. In a study of a 500 mg quercetin intake for 6 day, the plasma concentrations of quercetin as aglycone and nonmethylated quercetin conjugates were 15 and 450 μg/L, respectively [35]. Based on studies of quercetin's bioavailability [3132333435], the effective quercetin dose used in this study was assumed to be above 5 µM, which can be obtained by consuming 100–150 mg of quercetin daily. Quercetin has a long half-life in the body (11 to 28 h), so if taken repeatedly, it can accumulate in the body and produce a cumulative effect [36]. Thus, the maximum quercetin dose of 20 µM used in this study is considered a level that can be safely consumed when repeatedly ingesting foods rich in quercetin.
In conclusion, quercetin decreased fat accumulation in 3T3-L1 adipocytes by inactivating mRNA expressions of C/EBPα, C/EBPβ, PPAR-γ, and aP2. In addition, quercetin reduced the mRNA expressions of VEGF-α and VEGFR-2, and the mRNA expressions, activity, and concentrations of MMP-2 and MMP-9 in adipocytes. The results of this study indicate that quercetin inhibits adipogenesis and angiogenesis in 3T3-L1 cells, and its effects appear to be achieved via expression downregulation of MMPs (MMP-2 and MMP-9).
Go to :
 XML Download