INTRODUCTION
The introduction of temporary anchorage devices (TADs) has enabled the intended movement of dentition, and has helped realize the clinical importance of distalization in nonextraction treatment. Several studies have suggested that predictive and effective treatment is possible regardless of patient cooperation during mandibular distalization using TADs.
1,2 Although TADs allow orthodontists to move teeth farther than conventional methods do, the movement is not indefinite and anatomical limitations exist.
3-6
The importance of anatomical limitations to tooth movement, i.e., the alveolar bone housing, has historically been of interest to orthodontists. The posterior limit was thought to be the maxillary tuberosity in the maxillary arch and the anterior border of the ramus in the mandibular arch.
7-9 However, a recent study using three-dimensional cone-beam computed tomography (CBCT) reported that the mandibular posterior anatomic limit (MPAL), a bone limitation of the mandibular second molar during distalization, was the lingual cortex of the mandibular body. The main limitation of this precedent study was that it included only patients with skeletal Class I malocclusion with a normodivergent pattern.
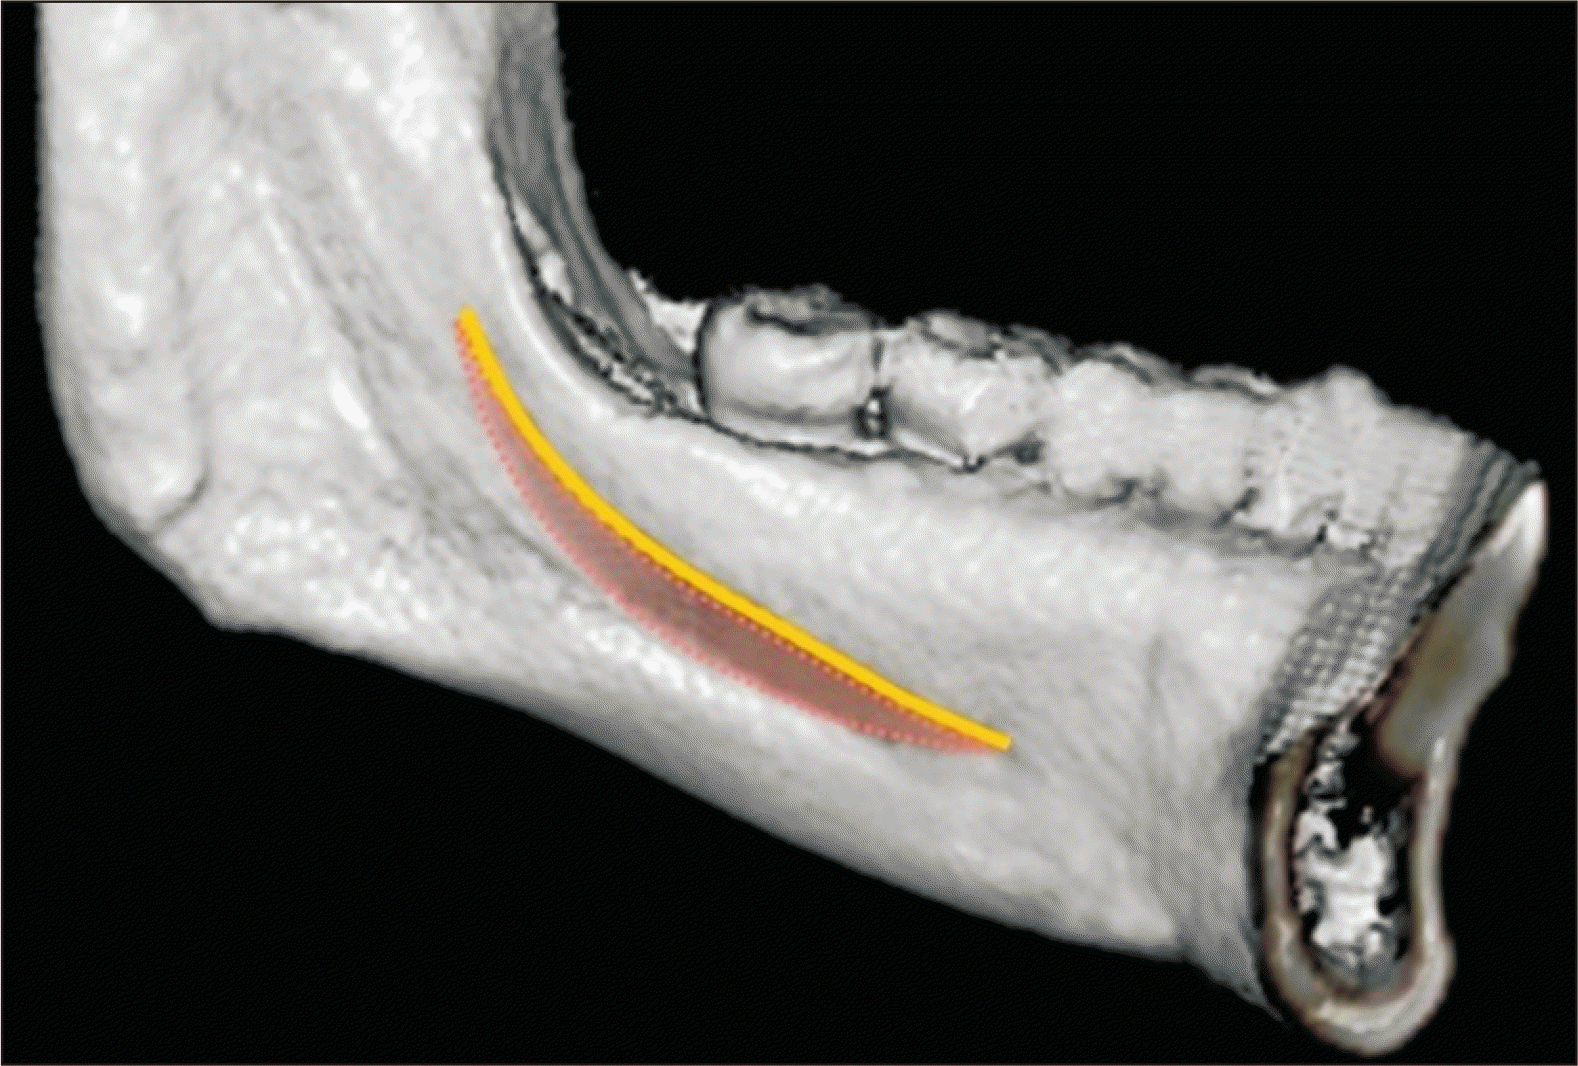
3 The anatomical morphology of the mylohyoid ridge and submandibular fossa, which determine the MPAL, can vary across different skeletal patterns (
Figure 1).
10
 | Figure 1Cone-beam computed tomography-reconstructed image of the left lingual side of the mandible. Mylohyoid ridge (yellow line) and submandibular fossa (dotted red line). 
|
The distalization of the mandibular arch is usually required in patients with skeletal Class III malocclusion. This type of malocclusion occurs relatively frequently in Asians, with a prevalence of up to 15.8%, who find Class III camouflage treatment acceptable.
11,12 In 2018, Choi et al.
13 compared the MPAL in patients with Class I and III malocclusions and concluded that patients with Class III malocclusion had greater retromolar space.
The mandibular skeletal structures may vary according to the vertical as well as anteroposterior skeletal patterns. According to Horner et al.,
14 the thickness of the cortical bone and alveolar ridge was greater in the hypodivergent pattern. Masumoto et al.
15 also reported a complex relationship between the structures of the mandibular body and vertical facial types.
The purpose of this study was to compare the differences between MPAL distances stratified by the vertical patterns in patients with skeletal Class III malocclusion by using CBCT. The null hypothesis was that MPAL distances in patients with hyperdivergent, normodivergent, and hyperdivergent skeletal Class III malocclusions would not be different.
Go to :

MATERIALS AND METHODS
The sample size was calculated using an effect size set of 0.5852, α of 0.05 and power (1-β) of 0.80 using G*power software ver. 3.1.9.4 (Franz Faul, Universitat Kiel, Germany). On the basis of these parameters, a sample of 12 patients per group was needed.
This retrospective study was approved by the Institutional Review Board (IRB) of Dankook University Dental Hospital (IRB: 2020-02-003). All patients who underwent full-skull CBCT for orthodontic diagnosis at Dankook University Dental Hospital between April 2015 and August 2019 were investigated. The inclusion criteria were as follows: (1) Class III malocclusion (Angle Class III molar relationship and A point-Nasion-B point (ANB) angle < 1°); (2) age between 18 and 30 years; (3) acceptable skeletal asymmetry (i.e., menton deviation < 4 mm, as assessed using a frontal view CBCT image with a midsagittal reference plane); and (4) crowding < 7 mm in the lower arch. The exclusion criteria were (1) the presence of a prosthesis or missing teeth, except for the third molars in the lower arch; (2) pathologic periodontal state with alveolar bone loss; (3) root anomalies of the mandibular second molar; (4) history of orthodontic treatment; and (5) congenital craniofacial anomalies. The study ultimately included 48 patients (33 male and 15 female) with a mean age of 22.8 ± 3.2 years.
The patients were classified into three groups according to their vertical skeletal patterns based on the mandibular plane angle (sella-nasion to gonion-gnathion angle) angle: Group 1 comprised 12 male and 4 female with a hypodivergent pattern (mandibular plane angle < 28°); Group 2 comprised 11 male and 5 female with a normodivergent pattern (28° < mandibular plane angle < 36°); and Group 3 comprised 11 male and 5 female with a hyperdivergent pattern (36° < mandibular plane angle) (
Table 1). The mandibular plane angle criterion was based on the mean values reported in previous studies.
16
Table 1
Clinical characteristics of the patients in each group
|
Characteristic |
Group 1
(hypodivergent) |
Group 2
(normodivergent) |
Group 3
(hyperdivergent) |
|
Sex |
|
|
|
|
Male (n = 34) |
12 |
11 |
11 |
|
Female (n = 14) |
4 |
5 |
5 |
|
Age (yr) |
22.5 ± 1.9 |
22.9 ± 3.6 |
23.1 ± 3.7 |
|
ANB (°) |
−2.7 ± 1.8 |
−1.5 ± 1.6 |
−2.5 ± 2.7 |
|
Mandibular plane angle (°) |
25.3 ± 3.3 |
33.0 ± 1.8 |
39.8 ± 2.4 |

The CBCT device (Alphard VEGA; Asahi Roentgen Ind. Co. Ltd, Kyoto, Japan) was used for scanning with the following parameters: 80 kV, 50 mA, and a field of view of 200 × 179 mm, resulting in a 0.39-voxel resolution. Each patient was seated in an upright position with the Frankfort horizontal plane parallel to the ground. The CBCT scan data were exported in DICOM files, and MPAL distances were measured using InVivo Dental 5 software (Anatomage, San Jose, CA, USA).
The CBCT images were reorientated using the coronal and sagittal views. To set the horizontal reference plane, the axial view line was rotated parallel to the mandibular occlusal plane connecting the mandibular central incisor tips and the mesiobuccal cusp of the right and left mandibular first molars.
MPAL distances were measured on the axial slices of the CT images, as proposed by Kim et al.
3 and Choi et al.
13 As mandibular dentition moves along the posterior occlusal line (POL) connecting the buccal cusps of the mandibular first and second molars, the POL was used as a reference line. While parallel to the POL, the shortest linear distances from the most lingual point of the distal root of the mandibular second molar to the inner cortex of the mandibular body were measured at depths of 4, 6, and 8 mm (D
4mm, D
6mm, and D
8mm, respectively) from the cementoenamel junction (CEJ) (
Figure 2). The measurements were performed on the right and left sides, and all measurements and analyses were performed by one investigator (S.H.K ).
 | Figure 2Measurement of mandibular posterior anatomic limit (MPAL) distance. A, Axial slice at the crown level; dotted red line, posterior occlusal line (POL). B, Axial slice at the root level; orange line, MPAL distance. C, Close-up view of the black box in B; white line, inner cortex; dotted white line, outer cortex of the mandibular body. 
|
Statistical analysis
All data were analyzed using IBM SPSS Statistics for Windows, ver. 25.0 (IBM Corp., Armonk, NY, USA). To evaluate the measurement and random errors, 10 randomly selected samples were remeasured after 2 weeks to assess intraexaminer reliability. The Dahlberg error, Bland-Altman plots, and intraclass correlation coefficients (ICCs) were computed. The Dahlberg error was less than 0.4 mm. The Bland-Altman plots of the mean difference for the two separate assessments are shown in
Figure 3. All ICCs were above 0.971, indicating high reproducibility.
 | Figure 3
Intraexaminer agreements in mandibular posterior anatomic limit distance measurements by using the Bland-Altman plots. A, Depth of 4 mm, D4mm. B, Depth of 6 mm, D6mm. C, Depth of 8 mm from the cementoenamel junction, D8mm. “95% limit of agreement (LoA)” represents the mean difference ± 1.96 standard deviations.
T1, the first measurement; T2, the second measurement, 2 weeks after T1.

|
To compare the differences between the right and left sides, the independent t-test and Mann–Whitney U test were conducted depending on data normality. The results confirmed that the laterality of the measurements did not act as a confounding factor for any of the variables (p > 0.05). In addition, the mean differences between the left and right measurements were not significant (p = 0.649, 0.625, 0.592 for D4mm, D6mm, and D8mm, respectively), thereby indicating that the sides were independent of all the other factors. On the basis of the above findings, the data from both sides were combined to obtain 32 samples for each group.
After deriving descriptive statistics, the Shapiro–Wilk test was used to evaluate normality, and Levene’s test was used to evaluate the homogeneity of distribution. To assess the tendencies of D4,6,8mm in the total sample, the Kruskal–Wallis test with Bonferroni correction was conducted. Multivariate analysis was performed to confirm the interactions between each group, sex, and the presence and absence of the third molar. An independent t-test was used to evaluate MPAL differences by sex and the presence of the third molar. The Kruskal–Wallis test with Bonferroni correction was conducted to compare MPAL differences based on the vertical patterns. Pearson correlation analysis was performed to analyze correlations. A significance level of p < 0.05 was used.
Go to :

RESULTS
The mean ages of the patients in the hypodivergent, normodivergent, and hyperdivergent groups were 22.5 ± 1.9 years, 22.9 ± 3.6 years, and 23.1 ± 3.7 years, respectively (
Table 1). The mean ages, sex distribution, asymmetry, and crowding showed no significant differences in the three groups. Only the mandibular plane angles in the three groups showed a significant difference (
p < 0.0001).
The mean MPAL distances at 4, 6, and 8 mm apical to the CEJ in all the samples and the Kruskal–Wallis test with Bonferroni correction results are shown in
Table 2 and
Figure 4. The results indicated that MPAL distances tended to decrease as they approached the root apex.
 | Figure 4
Comparison of mandibular posterior anatomic limit distances between the groups. A, Depth of 4 mm, D4mm. B, Depth of 6 mm, D6mm. C, Depth of 8 mm from the cementoenamel junction, D8mm.
Significant differencese are indicated by asterisk (**, ***).

|
Table 2
Comparison of mandibular posterior anatomic limit distances (mm) between the different root levels
|
D4mm
|
D6mm
|
D8mm
|
|
Mean |
5.31a,c
|
4.24a,b
|
3.16b,c
|
|
Standard deviation |
2.57 |
2.53 |
2.41 |

Considering the confounding factors, the multivariate linear regression model showed no interactions between each group, sexes, and the presence of the third molar. No independent variable acted as a confounding factor, and the
p-value was high (
p > 0.9). The results of the independent t-test for comparing MPAL distances based on sex and the presence of the third molar are shown in
Tables 3 and
4. Unlike sex, MPAL distances did not change according to the presence of the third molar. MPAL distance was approximately 2 mm longer in male than in female at the 8-mm root level.
Table 3
Descriptive analysis of mandibular posterior anatomic limit distances (mm) between the root levels, groups according to the vertical patterns, sex, and the presence of the third molar
|
n |
Mean |
Standard deviation |
Median |
Minimum |
Maximum |
|
D4mm
|
Vertical pattern |
Hypodivergent |
32 |
6.49a
|
2.83 |
5.48 |
2.00 |
12.49 |
|
|
Normodivergent |
32 |
5.60b
|
2.41 |
5.18 |
2.30 |
9.93 |
|
|
Hyperdivergent |
32 |
3.72a,b
|
1.62 |
3.07 |
1.71 |
7.44 |
|
Sex |
Male |
68 |
5.98*
|
2.72 |
5.50 |
1.93 |
12.49 |
|
|
Female |
28 |
3.71*
|
1.31 |
3.64 |
1.71 |
6.15 |
|
Third molar |
Presence |
60 |
5.41 |
2.46 |
5.22 |
1.71 |
12.49 |
|
|
Absence |
36 |
5.05 |
2.82 |
4.05 |
1.93 |
12.22 |
|
D6mm
|
Vertical pattern |
Hypodivergent |
32 |
5.52c
|
2.83 |
4.78 |
1.67 |
11.59 |
|
|
Normodivergent |
32 |
4.43d
|
2.33 |
3.77 |
1.11 |
9.15 |
|
|
Hyperdivergent |
32 |
2.77c,d
|
1.49 |
2.30 |
0.79 |
6.51 |
|
Sex |
Male |
68 |
4.95*
|
2.66 |
4.09 |
1.26 |
11.59 |
|
|
Female |
28 |
2.68*
|
1.21 |
2.44 |
0.79 |
5.04 |
|
Third molar |
Presence |
60 |
4.31 |
2.41 |
3.85 |
0.79 |
11.59 |
|
|
Absence |
36 |
4.12 |
2.76 |
3.07 |
1.26 |
11.17 |
|
D8mm
|
Vertical pattern |
Hypodivergent |
32 |
4.36e
|
2.84 |
3.47 |
0.00 |
10.13 |
|
|
Normodivergent |
32 |
3.32f
|
2.21 |
2.81 |
0.00 |
8.39 |
|
|
Hyperdivergent |
32 |
1.79e,f
|
1.19 |
1.39 |
0.00 |
4.94 |
|
Sex |
Male |
68 |
3.78*
|
2.57 |
3.01 |
0.00 |
10.13 |
|
|
Female |
28 |
1.78*
|
1.16 |
1.48 |
0.00 |
4.21 |
|
Third molar |
Presence |
60 |
3.14 |
2.34 |
2.66 |
0.00 |
10.13 |
|
|
Absence |
36 |
3.18 |
2.55 |
2.36 |
0.61 |
9.14 |

Table 4
Comparison of the root levels according to the groups categorized by vertical patterns, sex, the presence of the third molar, and interactions between each variable
Root
levels |
p-value |
|
Comparison between groups |
|
Group |
Sex |
3rd molar |
Group × sex |
Group × 3rd molar |
Sex × 3rd
molar |
Group × sex
× 3rd molar |
Hypodivergent vs. Normodivergent |
Normodivergent vs. Hyperdivergent |
Hypodivergent vs. Hyperdivergent |
|
D4mm
|
< 0.001***
|
< 0.001***
|
0.307 |
0.104 |
0.396 |
0.158 |
0.948 |
|
0.813 |
0.007**
|
< 0.001 |
|
D6mm
|
< 0.001***
|
< 0.001***
|
0.378 |
0.149 |
0.371 |
0.163 |
0.886 |
|
0.330 |
0.006**
|
< 0.001 |
|
D8mm
|
< 0.001***
|
< 0.001***
|
0.910 |
0.085 |
0.435 |
0.194 |
0.821 |
|
0.494 |
0.002**
|
< 0.001 |

The descriptive statistics for MPAL distances of the groups are shown in
Table 3. At all root levels, a significant difference was observed between the hypodivergent and hyperdivergent groups as well as between the normodivergent and hyperdivergent groups. Although not statistically significant, the hypodivergent group had a greater retromolar space than did the normodivergent group.
In terms of the correlation between groups and MPAL distances, the mandibular plane angle highly correlated with MPAL distances at all root levels (
Figure 5).
 | Figure 5
Scatter plots of depths according to the mandibular plane angles. A, Depth of 4 mm, D4mm. B, Depth of 6 mm, D6mm. C, Depth of 8 mm from the cementoenamel junction, D8mm.
PCC, Pearson correlation coefficient.
**Correlation is significant at the 0.01 level.

|
Go to :

DISCUSSION
The anatomic limitations of tooth movement are important from the treatment planning stage. The alveolar bone housing, or the orthodontic wall, is a cortical plate of the alveolar bone surrounding the tooth, which limits orthodontic tooth movement. To date, it is considered to be the anterior portion of the palate and maxillary tuberosity in the maxilla and the symphysis and lingual cortex of the mandibular body in the mandible.
3,5 When the tooth is in contact with the cortical plate, orthodontic tooth movement slows down.
17 If the tooth moves farther, the periodontal tissue gets compromised, resulting in a poor prognosis for the long-term function of the tooth.
18 As the above complications start when the tooth comes in contact with the inner cortical plate, we assessed the inner lingual cortex of the mandibular body in this study.
As MPAL distances to the root apex shorten, the available amount of distalization is determined at the root apex. This tendency is due to the anatomical morphology of the mandible.
3,12 The mylohyoid ridge, which determines the posterior limits, disturbs not only distalization but also the intrusion of the mandibular second molar.
10 Since this is also a mandibular lower anatomic limit within the posterior area, orthodontists need to pay careful attention to the mylohyoid ridge and submandibular fossa.
In the present study, the hypodivergent group showed longer MPAL distances than did the hyperdivergent group. This observation may have several explanations. First, patients with a hypodivergent pattern have a stronger masticatory force, leading to a longer mandibular body
19,20 and greater bone apposition in the lingual cortical area of the mandible. A narrower symphysis and thinner buccal shelf in patients with a hyperdivergent pattern
21,22 may be related to these factors. Second, in patients with the same occlusal plane angle and mandibular body length, a steeper mandibular plane angle is associated with a shorter distance of the retromolar space. Third, some genetic factors related to a long face may affect the genetic traits determining the retromolar space.
While MPAL distances showed a tendency to decrease as the mandibular plane angle increased, a portion of the hypodivergent group had shorter MPAL distances than did the hyperdivergent group. The relatively high standard deviation in our study should be considered when interpreting this result. The mean differences between male and female were 2.27, 2.27, and 2.0 mm for the 4-mm, 6-mm, and 8-mm root levels, respectively. Since these are greater than the standard deviations for the female, the differences are meaningful. However, the results should be carefully interpreted considering the high standard deviation of the values in male. Moreover, the standard deviations are much higher than the mean differences between the vertical skeletal patterns. Individual variations exist, and CBCT examinations may be needed for the precise treatment planning of distalization in patients with Class III malocclusion. Kim et al.
3 recommended performing CBCT when the posterior available space is less than 3.9 mm on lateral cephalograms.
In addition, the line of action for the distalization of the lower dentition should be considered. As distalization is usually performed using buccal TADs, the line of action passes outside the POL, leading to the buccal expansion of the mandibular archwire. Subsequently, uncontrolled tipping of the posterior teeth occurs, resulting in lingual root torque. Therefore, in clinical situations, the MPAL may be less than the results reported in this study. Nevertheless, the POL line used in prior studies was set as a reference line for reproducibility.
3,12 To prevent the above unwanted tooth movement, a stiff archwire is needed to guide tooth movement and place a lingual crown torque to achieve, at least, the controlled tipping of the posterior teeth. Likewise, the intrusive movement of the tooth makes the root move towards the lingual cortex. Uncontrolled buccal tipping and intrusion of the mandibular molars should be avoided to maintain MPAL distances.
Although soft tissue was not considered as a factor in our study, it is another critical limitation when distalizing the mandibular arch. The impingement of thick soft tissue overlying the retromolar area during distalization could impede tooth movement or result in subsequent relapse. In addition, inflammation can occur as the distal crown of the mandibular second molar is buried in soft tissue. To overcome these complications, a gingivectomy should be performed or, if necessary, the tooth should be slowly moved by applying a weak force to induce soft-tissue remodeling.
23
Significant differences were found between the sexes in our study. Vinay et al.
24 reported that the mandibular length, bigonial width, and bicondylar width showed significant differences between the sexes, and these may affect MPAL distances. However, the presence of the third molar did not affect MPAL distances, which is in agreement with the results of a previous study.
3 Though the third molar does not seem to affect the retromolar space, the timing of extraction of the third molar should be considered during distalization treatment. If the third molar poses no problems, it is optimal to strategically extract it just before distalization. After extraction, the mylohyoid ridge around the third molar begins to decrease in width and height, resulting in an overall decrease in volume and a decrease in MPAL distance.
25,26 In addition, the teeth can be distalized faster via the regional acceleratory phenomenon.
27
In terms of the tooth contacting the inner lingual cortex, Kim et al.
3 reported that a third of the mandibular second molar roots were in contact in patients with the Class I normodivergent pattern. However, in this study, only four roots were in contact. This may be due to the longer mandibular body length in patients with Class III malocclusion. Choi et al.
13 reported an MPAL distance of 2.7 ± 2.8 mm at 6 mm apical to the furcation. The average length of the root trunk is 3 mm,
28 which is similar to the distance at 8-mm depth apical to the CEJ in this study, i.e., 3.16 ± 2.41 mm.
In previous reports on mandibular distalization in patients with Class III malocclusion,
29-31 the amount of molar distalization varied from 3.2 mm to 4.9 mm including distal tipping. Thus, without distal tipping, the available space found in our study appears to be appropriate, thereby supporting the feasibility of distalization treatment.
As a limitation of retrospective research, the number of male was greater in all groups. Therefore, the differences between MPAL distances between the sexes require careful interpretation, and further studies with similar numbers of male and female are needed. In addition, our sample size for each group was insufficient, even if it exceeded the minimum sample size calculated using the power test. Another limitation of our study was the voxel size of 0.4 mm used in the CBCT images. It could be considered less accurate, as 0.4 mm is a relatively large voxel size. However, when evaluating linear measurements, Torres et al.
32 found no differences between the voxel sizes of 0.2, 0.3, and 0.4 mm. In addition, the ICC of this study showed high reliability and reproducibility. The other limitation was that MPAL distances were two-dimensional measurements, and the volumetric information for the posterior area of the mandible available from CBCT was not considered.
Prior studies have suggested that incisor characteristics could be related to the retromolar space, albeit with a relatively low statistical significance, indicating that they may not have a direct relationship.
12 However, the correlations between incisor characteristics, arch dimensions, and molar inclinations and the retromolar space are unclear. Additionally, the reaction of bone remodeling when moving the tooth beyond the alveolar bone housing remains unknown. Further studies on the possible factors related to the MPAL and remodeling of the mylohyoid ridge are needed.
Go to :

CONCLUSION
The MPAL has the following features in patients with Class III malocclusion:
1. MPAL distance shortens towards the root apex, and the mean distance is approximately 3.16 mm at the 8-mm root level below the CEJ.
2. MPAL distance is approximately 2 mm longer in male than in female at the 8-mm root level below the CEJ.
3. MPAL distance tends to decrease as the mandibular plane angle increases, and it has a shorter retromolar space in patients with a hyperdivergent pattern than in those with a normodivergent pattern.
Clinical implications
According to the “as low as reasonably achievable” (ALARA) principle, it is unethical to routinely perform CBCT in all patients. The following findings could be a reference for orthodontic diagnosis and treatment planning in patients with Class III malocclusion.
1. In general, approximately 3 mm of distalization per side in the mandibular arch could be assumed in Class III malocclusion. However, CBCT examination may be needed for precise treatment planning considering individual variations.
2. Distalization of the lower dentition could be limited in female with a hyperdivergent pattern.
Go to :


 PDF
PDF Citation
 Print
Print


 XML Download