Journal List > Korean J Orthod > v.51(4) > 1147286

Oh, Lee, Choi, Kim, Hwang, and Nelson: Quantitative cone-beam computed tomography evaluation of hard and soft tissue thicknesses in the midpalatal suture region to facilitate orthodontic mini-implant placement

Abstract

Objective

To identify the most favorable sites that optimize the initial stability and survival rate of orthodontic mini-implants, this study measured hard and soft tissue thicknesses in the median and paramedian regions of the palate using cone-beam computed tomography (CBCT) and determined possible sex- and age-related differences in these thicknesses.

Methods

The study sample comprised CBCT images of 189 healthy subjects. The sample was divided into four groups according to age. A grid area was set for the measurement of hard and soft tissue thicknesses in the palate. Vertical lines were marked at intervals of 0, 1.5, and 3.0 mm lateral to the midpalatal suture, while horizontal lines were marked at 2-mm intervals up to 24 mm from the posterior margin of the incisive foramen. Measurements were made at 65 points of intersection between the horizontal and vertical lines.

Results

The palatal hard tissue thickness decreased from the anterior to the posterior region, with a decrease in the medial-to-lateral direction in the middle and posterior regions. While the soft tissue was rather thick around the lateral aspects of the palatal arch, it formed a constant layer that was only 1–2-mm thick throughout the palate. Statistically significant differences were observed according to sex and age.

Conclusions

The anterolateral palate as well as the midpalatal suture seem to be the most favorable sites for insertion of orthodontic mini-implants. The thickness of the palate differed by age and sex; these differences should be considered while planning the placement of orthodontic mini-implants.

INTRODUCTION

Temporary skeletal anchorage devices have enabled three-dimensional movement of teeth without special intraoral or extraoral appliances.1 Moreover, transverse expansion of the palate can be achieved without side effects that are expected when only the teeth are used for anchorage to facilitate expansion. Recently, tissue/bone-borne palatal expanders, such as the C-expander,2 and tooth-and-bone-borne palatal expanders, such as the miniscrew-assisted rapid palatal expansion (MARPE)3 device, are widely advocated for the management of maxillary transverse deficiency. These expanders enable more skeletal expansion than do traditional tooth-borne palatal expansion devices by applying the expansion force directly to the palatal bone through mini-implants.4
The median and paramedian regions of the palate are the most suitable areas for mini-implant placement for several reasons,3-5 including good accessibility and a lower risk of damage to anatomical structures such as blood vessels, nerves, and tooth roots. The gingiva covering the palate is keratinized, so it is less susceptible to inflammation. The median area of the palatal bone is composed of high-quality cortical bone, which helps in securing the initial stability of the mini-implant. The palatal soft tissue thickness can influence the overall success rates and biomechanical stability of mini-implants, and this affects the orthodontist’s decision regarding the mini-implant length.6 Some clinicians make an incision in the palatal mucosa to eliminate concerns regarding the soft tissue thickness; however, this method causes patient discomfort and increases the risk of inflammation.7 In summary, both hard and soft tissue thicknesses of the palate should be considered before mini-implant insertion into the palate.
Because male and female patients have different growth patterns, the patient’s age and sex are important factors for determining the optimal implant placement site. Although several studies8,9 have evaluated the hard tissue thickness of the palate, few have assessed the thickness of the soft tissue in the median and paramedian regions of the palate or investigated the influences of age and sex in terms of mini-implant insertion in these regions. Therefore, the objectives of this study were to measure the hard and soft tissue thicknesses in the median and paramedian regions of the palate, which are primarily favored for mini-implant insertion, and to evaluate the influences of age and sex on these thicknesses.

MATERIALS AND METHODS

Subjects

The study sample comprised cone-beam computed tomography (CBCT) images of 189 patients (108 female and 81 male patients; age, 7 to 87 years) who visited the orthodontic department at Kyung Hee University Dental Hospital from 2011 to 2020. All images were acquired using the Alphard vega-3030 CBCT device (Asahi Roentgen, Kyoto, Japan) in the craniofacial mode (tube voltage: 80 kVp, scanning time: 17 seconds, voxel size: 0.38 mm). Patient classification by age was based on the dental development stages proposed by Björk et al.10: Group 1, mixed dentition; Group 2, permanent dentition (10's); Group 3, permanent dentition (20's); Group 4, permanent dentition (over 30's) (Table 1). Radiology reports showed that all subjects had intact maxillary jaws without tongue contact with the midpalatal region. The scans were selected according to the following exclusion criteria: (1) abnormalities such as cysts or tumors in the maxilla, (2) craniofacial or congenital abnormalities such as cleft lip and palate, (3) missing teeth or inadequate soft tissue in the maxilla, and (4) previous history of orthodontic treatment. The study design was reviewed and approved by the Institutional Review Board of Kyung Hee University Dental Hospital (IRB No. KH-DT20010).

Measurement

OnDemand software ver.1.0 (Cybermed Inc., Seoul, Korea), a volumetric imaging software, was used for reorientation and measurements. The sagittal plane was adjusted such that it was parallel to the line connecting two points on the anterior and posterior nasal spines, while the axial plane was adjusted such that it was parallel to the orthodontic occlusal plane (Figure 1). A grid area was set for measurement of the hard and soft tissue thicknesses in the median and paramedian regions of the palate. For the vertical lines, the midpalatal suture was set as the “0” line, and lines marked 1.5 and 3.0 mm away from the “0” line on the right and left sides were set as the “1.5” and “3.0” lines, respectively. For the horizontal lines, the posterior margin of the incisive foramen was set as the “0” line, and 13 lines were marked at 2-mm intervals up to a distance of 24 mm from the “0” line. Measurements were made at 65 points of intersection between the vertical and horizontal lines (Figure 2). In addition, the anterior–posterior area was divided into three groups according to the horizontal lines: anterior area, 0 to 8 lines; middle area, 8 to 16 lines; and posterior area, 16 to 24 lines.

Statistical analysis

For intraexaminer reliability testing, 20 randomly selected scans from each group were assessed by the same individual at a 2-week-interval, and intraclass correlations were determined to assess the reliabilities of the measurements. Patient variables included sex and age (four age groups). The Shapiro–Wilk normality test was used to examine the normality of distribution of the measured outcomes. It revealed normal distribution; therefore, analysis of covariance with false discovery rate adjustment was used to determine the significance of differences between various sites measured in the experimental groups. *p < 0.05, **p < 0.01, and ***p < 0.001 were considered statistically significant.

RESULTS

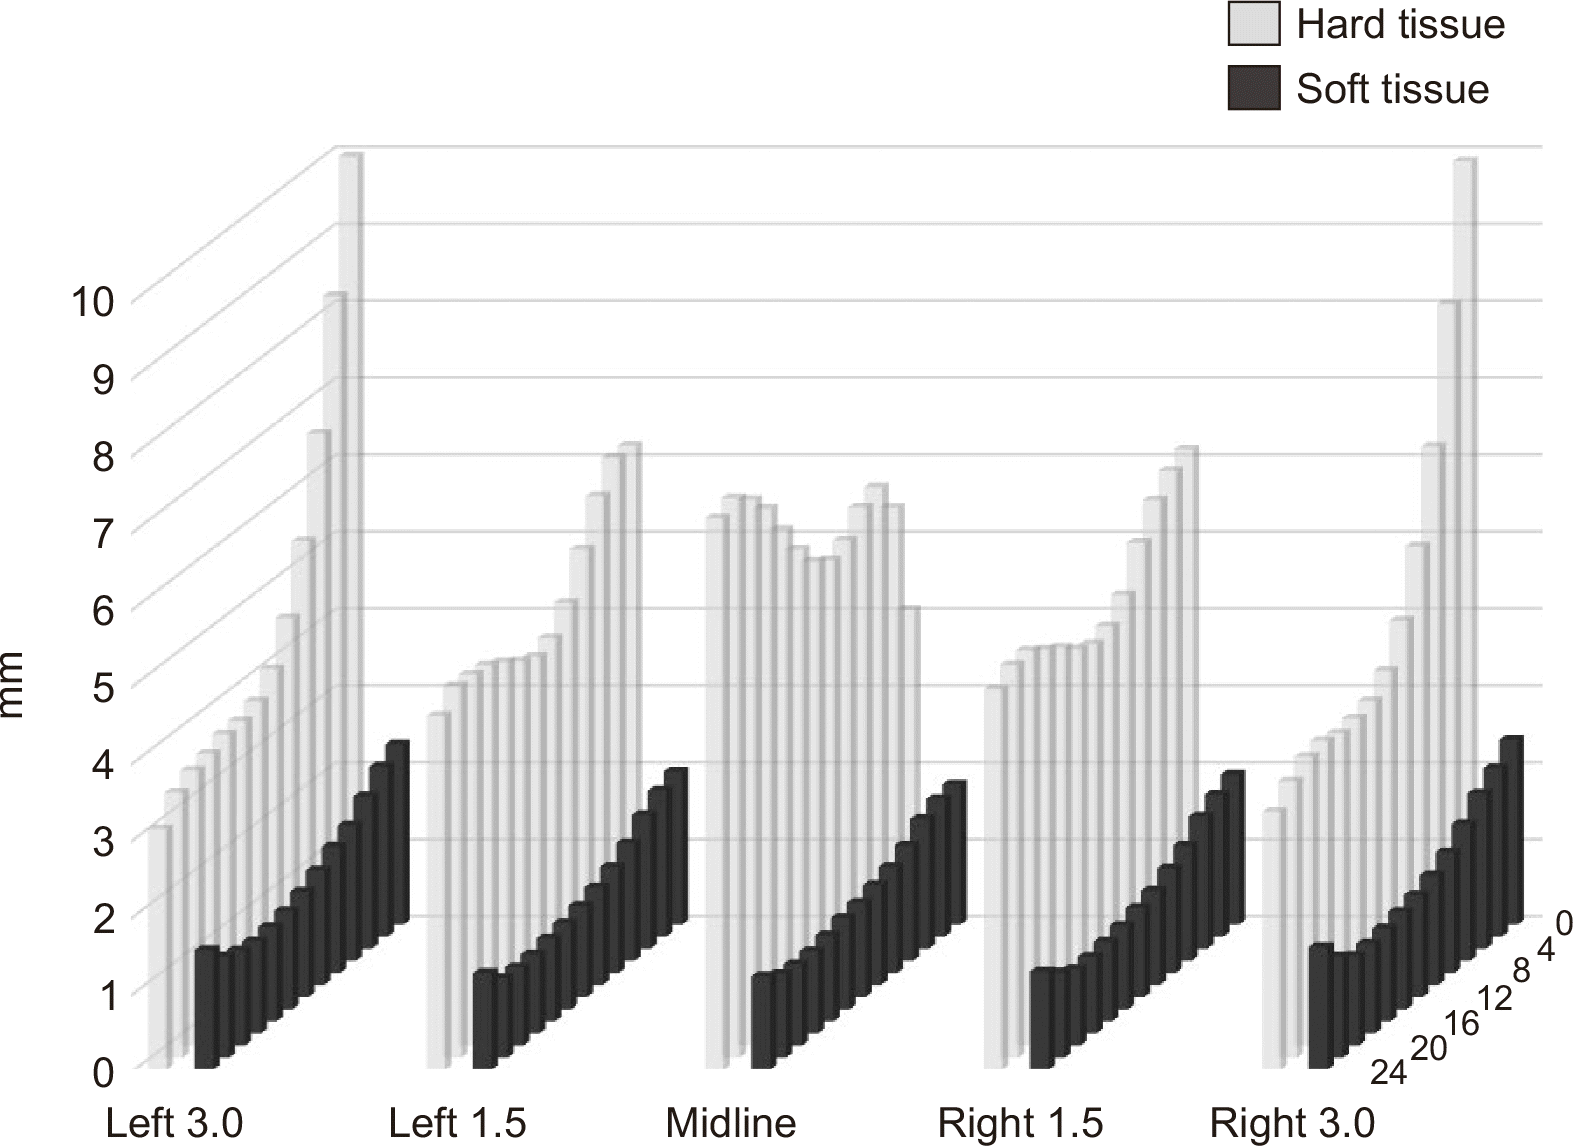
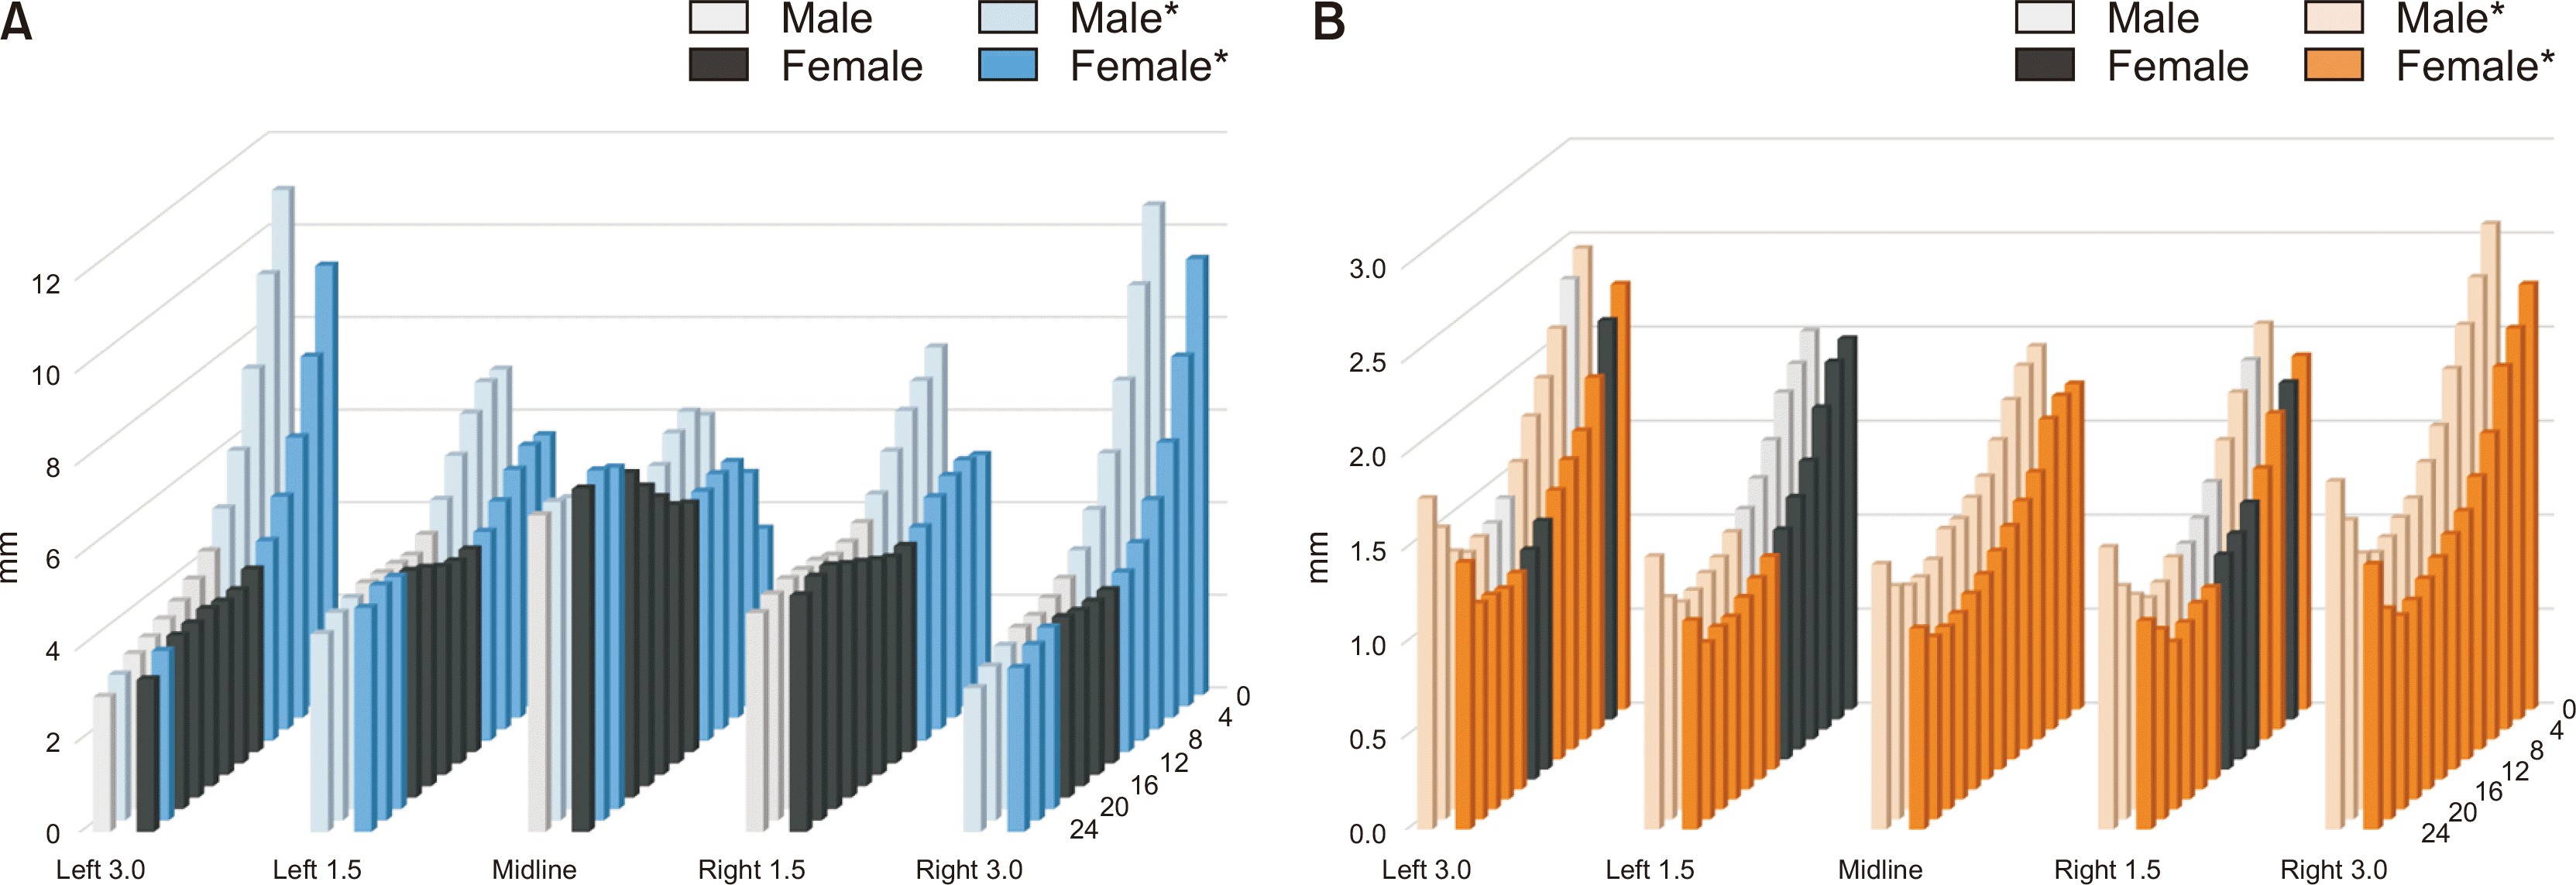
Intraclass correlation coefficient analysis showed high reliability between the two evaluations (> 0.980). Mean and standard deviation values for the hard and soft tissue thicknesses of the palate in the entire group, male and female groups, and different age groups are shown in Tables 2, 3, and 4, respectively. Some notable patterns were observed. As shown in Figure 3 and Table 2, the hard tissue thickness in the midsagittal area (midline-lateral [ML] = 0) initially increased, then slightly decreased, and increased again toward the posterior region. The paramedian area (ML = 1.5 and 3.0) showed different findings. The hard tissue tended to be even thinner posteriorly and laterally, with mean values posterior to anterior-posterior (AP) = 8 being consistently lower than those at the medial adjacent points. The soft tissue thickness decreased from AP = 0 to AP = 20 and increased from AP = 20 to AP = 24. Among all sagittal sections, the soft tissue thickness was the maximum at ML = 3.0, followed by ML = 0 and ML = 1.5. The Wilcoxon rank sum test revealed that the palatal hard tissue in the anterior region was significantly thicker in male than in female subjects; the opposite was observed for the posterior region. The soft tissue in all regions was significantly thicker in male than in female subjects (Figure 4, Table 3).
There was a statistically significant age-related difference in the hard tissue thickness in the anterior region of left ML = 3.0 and right ML = 3.0. In particular, highly significant differences were observed between groups 1 and 4 and groups 2 and 4, with no significant between-group differences in any other section. In the anterior region of all sagittal sections, the soft tissue thickness showed significant differences according to age. In particular, a highly significant difference was observed between group 4 and the other groups (Table 4).

DISCUSSION

Insufficient bone thickness at the site of mini-implant placement may weaken the intrabone stability and lead to invasion of peripheral anatomical structures such as the incisive canal and nasal cavity. In cases of a severely narrow maxilla and V-shaped palatal vault, it is difficult to place the conventional MARPE device or other bone-borne expanders. In this study, we evaluated the maximum hard and soft tissue thicknesses in the midpalatal and paramedian regions in order to investigate the suitability of these regions for orthodontic mini-implant placement. The findings showed that the hard tissue thickness decreased in a medial-to-lateral direction in the middle and posterior regions. In the anterior region, the area lateral to the midpalatal suture showed the maximal thickness, with a gradual decrease in thickness toward the posterior region. In agreement with our study, Kang et al.11 and Ryu et al.12 reported that the bone thickness in the palate decreased laterally and posteriorly. This feature could be attributed to embryonic development. During development, the palate is divided into the primary palate formed in the embryonic period and the secondary palate formed in the early fetal period. The secondary palate is formed by the medial growth of the two palatine shelves and their mutual fusion at the midline. It represents a large part of the adult hard palate in the area posterior to the incisive fossa.13
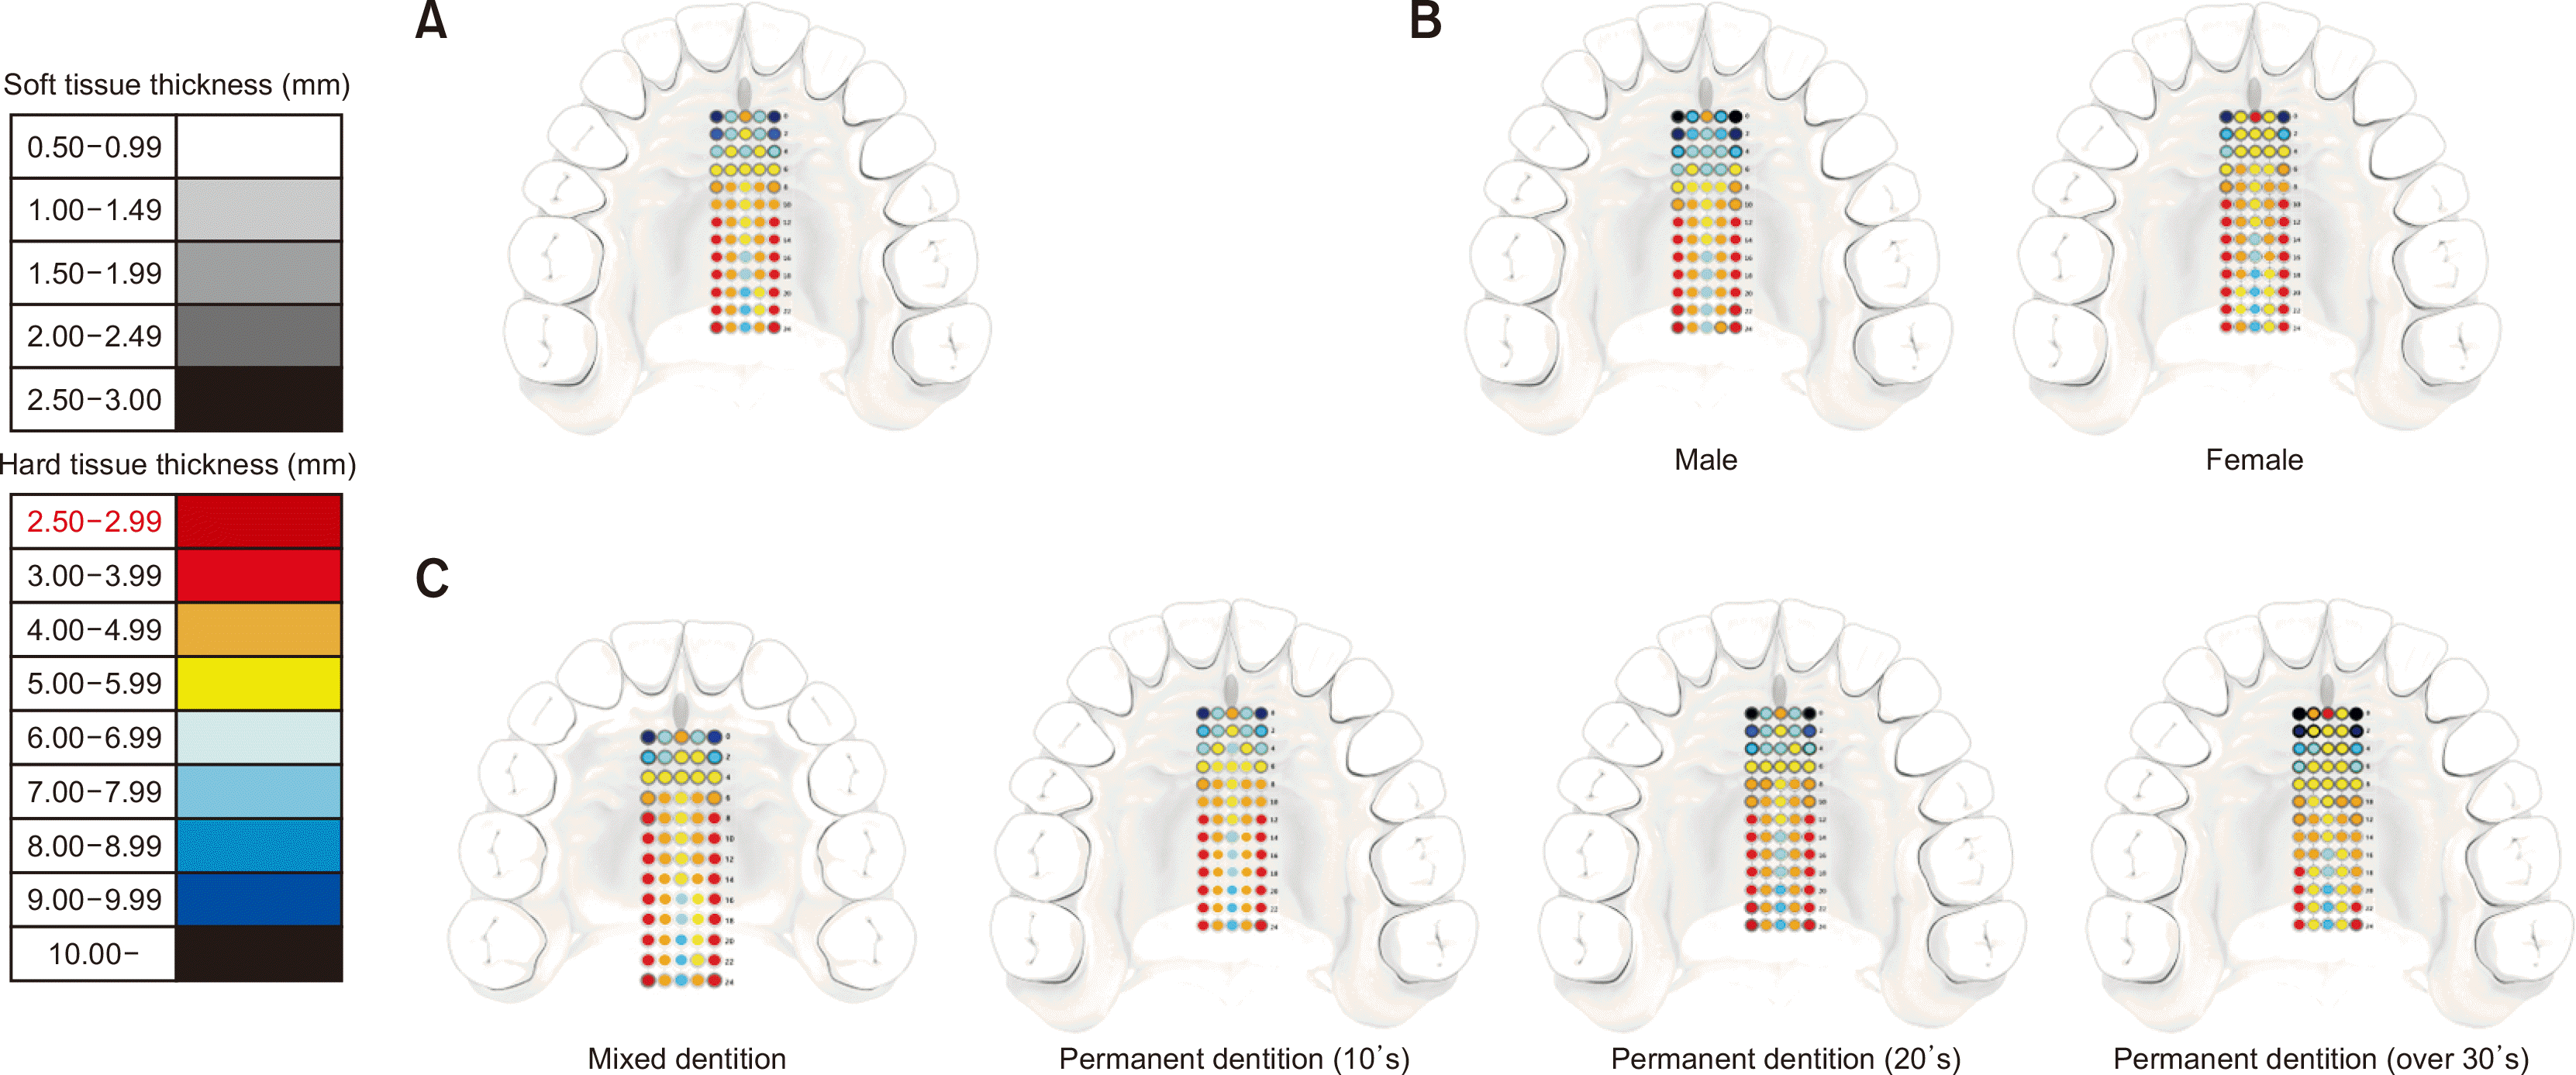
A minimum palatal bone thickness of 4–5 mm is preferred for orthodontic mini-implant placement.14 According to the results of this study, the midpalatal suture and the anterolateral region of the palate are suitable insertion sites for orthodontic implants (Figure 5A). Some authors suggest that the midpalatal suture is not suitable for mini-implant placement because of incomplete calcification, even in adults; the possibility of connective tissue interposition between the screws and bone could reduce the primary stability.15,16 However, a midpalatal suture region with sufficient hard tissue thickness can be recommended for the insertion of only one miniscrew, with application of symmetric forces for upper posterior intrusion or anterior retraction. In case of MARPE, placement of mini-implants in the paramedian palatal region has been recommended because of the adequacy of cortical bone and thin keratinized soft tissue, particularly in younger patients.11,17 Previous studies have recommended bicortical skeletal anchorage for the proper functioning of the MARPE device, because it increases the stability of the miniscrews.18 However, in thin palatal bone, strong expansion forces on bicortial screws placed more than 3 mm lateral to the midpalatal suture may tear through the bone instead of opening the midpalatal suture.
We found a significant difference in the hard tissue thickness between male and female subjects (Figure 5B), with male subjects tending to show higher mean values. However, this result does not mean that the hard tissue in all regions is thicker in males than in females. In the posterior region, women tended to have thicker bone than did men. Several studies11,19 have reported that male individuals have significantly greater palatal bone thickness than female individuals, consistent with our results. Cassetta et al.20 showed statistically significant differences between their male and female groups, with men showing greater palatal thickness at all measurement points.
The hard tissue thickness in all areas except the anterior region of ML = 3.0 (3.0 mm lateral to the midpalatal suture) showed no statistically significant difference. This result indicated that there was no great difference among age groups (Figure 5C). However, Ryu et al.12 showed that there were significant between-group differences according to age; there was significantly thinner bone in adolescents than in adults. This inconsistency can probably be attributed to differences in the experimental methodology. In the present study, all patients with a mixed dentition (group 1) were in the late mixed dentition stage, whereas previous studies12 evaluated patients in both early (mean age, 8.0 years) and late mixed dentition (mean age, 11.5 years) stages. The quality of the palatal gingiva, as well as the quality and quantity of bone, are important factors to consider in terms of the success of mini-implant anchorage. The soft tissue thickness of the palate showed a statistically significant difference between group 4 and the other groups, and it tended to increase with age.
Previous studies21,22 show that persistent inflammation of the soft tissue eventually degrades the bone around mini-implants. The authors concluded that inflammation around the mini-implant plays an important role in mini-implant failure. Baumgaertel23 found that thin soft tissue is preferred to reduce the incidence of inflammation around mini-implants. Because age is related to the thickness of the soft tissue, the patient’s age would be a key factor influencing the clinical success of mini-implants placed in the palate.
On the basis of the present study results, a clinically favorable length for palatal mini-implants can be suggested. More bone contact with the mini-implant provides higher stability. The soft tissue thickness will contribute to the selection of a favorable implant length. For example, when mini-implants are placed on the lateral side of the midpalatal suture in male patients, the soft tissue thickness would be > 2 mm. Accordingly, mini-implants with a minimum length of 7–8 mm should be used for better stability. In contrast, longer mini-implants might invade the nasal cavity in young patients; therefore, shorter ones are recommended. The use of CBCT can help determine the appropriate screw length. Optimal force application often dictates implant placement laterally or posteriorly rather than at the midpalatal suture. In our study, the soft tissue showed a tendency to thicken in the lateral and posterior regions of the palate. By placing a mini-plate instead of single mini-implants, the mounting screws can be placed in thicker bone near the midpalatal region, while lateral extension arms can be positioned to provide a more favorable site for force application.24
The location and shape of the incisive foramen markedly varied. The distance from the anterior border of the incisive foramen to the buccal border of the alveolar crest is approximately 7 mm, and the diameter of the foramen is approximately 4 mm. In the present study, however, the anterior reference point of the incisive foramen was on the posterior border, and it was measured more posteriorly than expected. We located the foramen on the axial view of CBCT images by using the surrounding cortical bone for reference. It has been suggested that the cortical bone is thinner near the incisive foramen than within the canal.25 For this reason, the location of the incisive foramen in the present study was above the anatomical position, probably because of the quality of CBCT images. This can be considered a limitation of this study. Future studies should focus on finding a more precise incisive foramen location on CBCT images. One of the limitations of similar studies is that the anatomical thickness of the bone or tissue was measured only at specific points. This was also an inevitable concern in the present study, although we included a larger number of measurement points than did other studies. Moreover, we measured the hard and soft tissue thicknesses in accordance with a previous study.12 The measuring plane was not perpendicular to the bone or soft tissue surface in the anterior maxilla; it was relatively diagonal to the surfaces. As a result, the measured thickness might be greater than that measured using a measurement vector perpendicular to the bone surface. We anticipate that future studies will develop different methods to measure the hard and soft tissue thicknesses at consecutive locations.

CONCLUSION

1. The hard tissue thickness of the palate tends to decrease in the mediolateral and anteroposterior directions, showing a V-shaped pattern.
2. The midpalatal suture and the anterior region of the palate provide enough bone thickness for the placement of orthodontic mini-implants.
3. The soft tissue thickness of the palate differs by age and sex in nearly all regions, while the hard tissue thickness shows a significant difference according to sex in the anterior region. Therefore, age- and sex-related differences should be considered when determining the optimal sites for mini-implant placement.

Notes

CONFLICTS OF INTEREST

No potential conflict of interest relevant to this article was reported.

REFERENCES

1. Janssen KI, Raghoebar GM, Vissink A, Sandham A. 2008; Skeletal anchorage in orthodontics--a review of various systems in animal and human studies. Int J Oral Maxillofac Implants. 23:75–88. PMID: 18416415.
2. Seo YJ, Chung KR, Kim SH, Nelson G. 2015; Camouflage treatment of skeletal class III malocclusion with asymmetry using a bone-borne rapid maxillary expander. Angle Orthod. 85:322–34. DOI: 10.2319/031314-189.1. PMID: 25032737.
crossref
3. Lee KJ, Park YC, Park JY, Hwang WS. 2010; Miniscrew-assisted nonsurgical palatal expansion before orthognathic surgery for a patient with severe mandibular prognathism. Am J Orthod Dentofacial Orthop. 137:830–9. DOI: 10.1016/j.ajodo.2007.10.065. PMID: 20685540.
crossref
4. Celenk-Koca T, Erdinc AE, Hazar S, Harris L, English JD, Akyalcin S. 2018; Evaluation of miniscrew-supported rapid maxillary expansion in adolescents: a prospective randomized clinical trial. Angle Orthod. 88:702–9. DOI: 10.2319/011518-42.1. PMID: 30102085. PMCID: PMC8174075.
crossref
5. Kyung SH. 2004; A study on the bone thickness of midpalatal suture area for miniscrew insertion. Korean J Orthod. 34:63–70.
6. Kim HJ, Yun HS, Park HD, Kim DH, Park YC. 2006; Soft-tissue and cortical-bone thickness at orthodontic implant sites. Am J Orthod Dentofacial Orthop. 130:177–82. DOI: 10.1016/j.ajodo.2004.12.024. PMID: 16905061.
crossref
7. Keles A, Erverdi N, Sezen S. 2003; Bodily distalization of molars with absolute anchorage. Angle Orthod. 73:471–82. DOI: 10.1043/0003-3219(2003)073<0471:BDOMWA>2.0.CO;2. PMID: 12940570.
8. Poorsattar-Bejeh Mir A, Haghanifar S, Poorsattar-Bejeh Mir M, Rahmati-Kamel M. 2017; Individual scoring and mapping of hard and soft tissues of the anterior hard palate for orthodontic miniscrew insertion. J Investig Clin Dent. 8:e12186. DOI: 10.1111/jicd.12186. PMID: 26446347.
crossref
9. Lyu X, Guo J, Chen L, Gao Y, Liu L, Pu L, et al. 2020; Assessment of available sites for palatal orthodontic mini-implants through cone-beam computed tomography. Angle Orthod. 90:516–23. DOI: 10.2319/070719-457.1. PMID: 33378492. PMCID: PMC8028458.
crossref
10. Bjöerk A, Krebs A, Solow B. 1964; A method for epidemiological registration of malocclusion. Acta Odontol Scand. 22:27–41. DOI: 10.3109/00016356408993963. PMID: 14158468.
11. Kang S, Lee SJ, Ahn SJ, Heo MS, Kim TW. 2007; Bone thickness of the palate for orthodontic mini-implant anchorage in adults. Am J Orthod Dentofacial Orthop. 131(4 Suppl):S74–81. DOI: 10.1016/j.ajodo.2005.09.029. PMID: 17448390.
crossref
12. Ryu JH, Park JH, Vu Thi Thu T, Bayome M, Kim Y, Kook YA. 2012; Palatal bone thickness compared with cone-beam computed tomography in adolescents and adults for mini-implant placement. Am J Orthod Dentofacial Orthop. 142:207–12. DOI: 10.1016/j.ajodo.2012.03.027. PMID: 22858330.
crossref
13. Schoenwolf GC, Bleyl SB, Brauer PR, Francis-West PH. 2015. Larsen's human embryology. 5th ed. Churchill Livingstone;Philadelphia:
14. Chhatwani S, Rose-Zierau V, Haddad B, Almuzian M, Kirschneck C, Danesh G. 2019; Three-dimensional quantitative assessment of palatal bone height for insertion of orthodontic implants - a retrospective CBCT study. Head Face Med. 15:9. DOI: 10.1186/s13005-019-0193-9. PMID: 30935392. PMCID: PMC6442434.
crossref
15. Wehrbein H, Merz BR, Diedrich P, Glatzmaier J. 1996; The use of palatal implants for orthodontic anchorage. Design and clinical application of the orthosystem. Clin Oral Implants Res. 7:410–6. DOI: 10.1034/j.1600-0501.1996.070416.x. PMID: 9151610.
crossref
16. Wehrbein H, Merz BR, Diedrich P. 1999; Palatal bone support for orthodontic implant anchorage--a clinical and radiological study. Eur J Orthod. 21:65–70. DOI: 10.1093/ejo/21.1.65. PMID: 10191579.
17. Bernhart T, Freudenthaler J, Dörtbudak O, Bantleon HP, Watzek G. 2001; Short epithetic implants for orthodontic anchorage in the paramedian region of the palate. A clinical study. Clin Oral Implants Res. 12:624–31. DOI: 10.1034/j.1600-0501.2001.120611.x. PMID: 11737107.
18. Choi SH, Shi KK, Cha JY, Park YC, Lee KJ. 2016; Nonsurgical miniscrew-assisted rapid maxillary expansion results in acceptable stability in young adults. Angle Orthod. 86:713–20. DOI: 10.2319/101415-689.1. PMID: 26938955.
crossref
19. Yadav S, Sachs E, Vishwanath M, Knecht K, Upadhyay M, Nanda R, et al. 2018; Gender and growth variation in palatal bone thickness and density for mini-implant placement. Prog Orthod. 19:43. DOI: 10.1186/s40510-018-0241-1. PMID: 30393829. PMCID: PMC6215790.
crossref
20. Cassetta M, Sofan AA, Altieri F, Barbato E. 2013; Evaluation of alveolar cortical bone thickness and density for orthodontic mini-implant placement. J Clin Exp Dent. 5:e245–52. DOI: 10.4317/jced.51228. PMID: 24455090. PMCID: PMC3892271.
crossref
21. Chen YJ, Chang HH, Lin HY, Lai EH, Hung HC, Yao CC. 2008; Stability of miniplates and miniscrews used for orthodontic anchorage: experience with 492 temporary anchorage devices. Clin Oral Implants Res. 19:1188–96. DOI: 10.1111/j.1600-0501.2008.01571.x. PMID: 18983323.
crossref
22. Yao CC, Chang HH, Chang JZ, Lai HH, Lu SC, Chen YJ. 2015; Revisiting the stability of mini-implants used for orthodontic anchorage. J Formos Med Assoc. 114:1122–8. DOI: 10.1016/j.jfma.2014.08.001. PMID: 25260551.
crossref
23. Baumgaertel S. 2014; Hard and soft tissue considerations at mini-implant insertion sites. J Orthod. 41 Suppl 1:S3–7. DOI: 10.1179/1465313314Y.0000000104. PMID: 25138363.
crossref
24. Kim JS, Kim SH, Kook YA, Chung KR, Nelson G. 2011; Analysis of lingual en masse retraction combining a C-lingual retractor and a palatal plate. Angle Orthod. 81:662–9. DOI: 10.2319/100110-574.1. PMID: 21406002.
crossref
25. Kim YT, Lee JH, Jeong SN. 2020; Three-dimensional observations of the incisive foramen on cone-beam computed tomography image analysis. J Periodontal Implant Sci. 50:48–55. DOI: 10.5051/jpis.2020.50.1.48. PMID: 32128273. PMCID: PMC7040439.
crossref

Figure 1
A, A schematic illustration of the area for measuring the hard tissue and soft tissue thicknesses of the palate (so-called I-bar). B, Measuring grid for the palatal hard and soft tissue heights at the 65 evaluated sites, starting from the posterior border of the incisive foramen (occlusal view). C, Reference points and lines for measuring the palatal hard and soft tissue heights (sagittal view).
AP, anterior-posterior; ML, midline-lateral.
kjod-51-4-260-f1.tif
Figure 2
A sagittal section of a cone-beam computed tomography image of the palate. The image shows the measurement of the height of the soft (A) and hard (B) tissues of the palate at one reference point (the midpalatal suture [ML = 0], 4 mm from incisive foramen posteriorly [AP = 4]).
AP, anterior-posterior; ML, midline-lateral.
kjod-51-4-260-f2.tif
Figure 3
Mean palatal hard and soft tissue thicknesses (mm) at the 65 evaluated sites.
Midline, the line at the midpalatal suture; Left 1.5 and 3.0, the lines from left 1.5 and 3.0 mm from the midline; Right 1.5 and 3.0, the lines from right 1.5 and 3.0 mm from the midline.
kjod-51-4-260-f3.tif
Figure 4
Mean palatal hard (A) and soft (B) tissue thicknesses (mm) at the 65 evaluated sites in male and female patients. Hard and soft tissue thicknesses showing significant sex-related differences (*) are marked in blue and orange color, respectively.
Midline, the line at the midpalatal suture; Left 1.5 and 3.0, the lines from left 1.5 and 3.0 mm from the midline; Right 1.5 and 3.0, the lines from right 1.5 and 3.0 mm from the midline. In each line, the left and right rows indicate thickness in male and female patients, respectively.
kjod-51-4-260-f4.tif
Figure 5
Mean palatal hard and soft tissue thicknesses (mm) at the 65 evaluated sites were marked with a target shape. The inner circle color indicated the thickness of the hard tissue, and the outer circle color indicated the thickness of the soft tissue, referring to the color scale bar on the left. A, Whole group. B, Male and female groups. C, Mixed and permanent dentition groups.
kjod-51-4-260-f5.tif
Table 1
Classification of age groups based on the stage of dental development
Group Number Age (yr)
Group 1 (mixed dentition) 31 (M: 12, F: 19) 9.48 ± 1.67
Group 2 (permanent dentition [10's]) 76 (M: 29, F: 47) 15.12 ± 2.48
Group 3 (permanent dentition [20's]) 50 (M: 33, F: 17) 22.30 ± 1.91
Group 4 (permanent dentition [over 30's]) 32 (M: 7, F: 25) 43.97 ± 12.05

Values are presented as number only or mean ± standard deviation.

M, male; F, female.

Table 2
Mean palatal heights (mm) at the 65 evaluated sites
Distance from incisive foramen (mm) Hard tissue Soft tissue
Left 3.0 Left 1.5 Midline Right 1.5 Right 3.0 Left 3.0 Left 1.5 Midline Right 1.5 Right 3.0
0 9.98 ± 3.22 6.22 ± 3.62 4.09 ± 1.92 6.17 ± 3.51 9.92 ± 3.34 2.34 ± 0.68 1.99 ± 0.72 1.82 ± 0.64 1.95 ± 0.59 2.40 ± 0.72
2 8.32 ± 2.96 6.22 ± 2.30 5.58 ± 1.74 6.05 ± 2.42 8.22 ± 3.01 2.21 ± 0.83 1.90 ± 0.77 1.79 ± 0.64 1.85 ± 0.63 2.19 ± 0.73
4 6.70 ± 2.51 5.88 ± 1.94 6.00 ± 1.64 5.83 ± 1.97 6.52 ± 2.56 1.98 ± 0.75 1.74 ± 0.71 1.69 ± 0.68 1.72 ± 0.69 2.02 ± 0.75
6 5.45 ± 2.04 5.35 ± 1.69 5.89 ± 1.62 5.43 ± 1.70 5.38 ± 2.05 1.76 ± 0.67 1.53 ± 0.58 1.50 ± 0.45 1.50 ± 0.50 1.78 ± 0.72
8 4.61 ± 1.78 4.81 ± 1.53 5.62 ± 1.58 4.91 ± 1.59 4.58 ± 1.74 1.64 ± 0.67 1.38 ± 0.54 1.38 ± 0.42 1.36 ± 0.46 1.57 ± 0.51
10 4.11 ± 1.60 4.51 ± 1.52 5.52 ± 1.57 4.66 ± 1.57 4.08 ± 1.56 1.49 ± 0.64 1.27 ± 0.50 1.30 ± 0.38 1.23 ± 0.45 1.43 ± 0.49
12 3.87 ± 1.46 4.42 ± 1.48 5.66 ± 1.65 4.59 ± 1.54 3.85 ± 1.51 1.37 ± 0.55 1.19 ± 0.50 1.23 ± 0.41 1.16 ± 0.40 1.33 ± 0.46
14 3.75 ± 1.40 4.52 ± 1.46 5.97 ± 1.76 4.68 ± 1.57 3.78 ± 1.44 1.28 ± 0.55 1.12 ± 0.49 1.19 ± 0.42 1.09 ± 0.41 1.27 ± 0.47
16 3.73 ± 1.43 4.67 ± 1.46 6.39 ± 1.89 4.86 ± 1.68 3.74 ± 1.42 1.23 ± 0.58 1.08 ± 0.51 1.12 ± 0.44 1.04 ± 0.43 1.21 ± 0.48
18 3.64 ± 1.35 4.79 ± 1.52 6.82 ± 1.99 4.99 ± 1.81 3.80 ± 1.42 1.20 ± 0.56 1.03 ± 0.54 1.07 ± 0.44 1.00 ± 0.44 1.17 ± 0.52
20 3.58 ± 1.32 4.82 ± 1.53 7.09 ± 2.08 5.13 ± 1.85 3.75 ± 1.45 1.24 ± 0.62 1.02 ± 0.57 1.06 ± 0.47 1.00 ± 0.52 1.17 ± 0.62
22 3.45 ± 1.34 4.83 ± 1.52 7.27 ± 2.12 5.10 ± 1.91 3.59 ± 1.48 1.32 ± 0.69 1.04 ± 0.50 1.09 ± 0.53 1.11 ± 0.78 1.32 ± 0.80
24 3.13 ± 1.35 4.60 ± 1.54 7.17 ± 2.22 4.74 ± 1.92 3.35 ± 1.49 1.56 ± 0.87 1.26 ± 0.70 1.22 ± 0.75 1.28 ± 0.83 1.60 ± 1.06
Anterior 7.01 ± 2.28 5.70 ± 1.84 5.43 ± 1.37 5.68 ± 1.82 6.92 ± 2.30 1.99 ± 0.63 1.71 ± 0.60 1.63 ± 0.50 1.67 ± 0.51 1.99 ± 0.60
Middle 3.86 ± 1.42 4.53 ± 1.43 5.89 ± 1.63 4.70 ± 1.52 3.86 ± 1.43 1.34 ± 0.55 1.16 ± 0.48 1.21 ± 0.38 1.13 ± 0.39 1.31 ± 0.45
Posterior 3.45 ± 1.28 4.76 ± 1.45 7.09 ± 2.01 5.04 ± 1.81 3.63 ± 1.39 1.33 ± 0.62 1.09 ± 0.50 1.11 ± 0.49 1.10 ± 0.57 1.32 ± 0.69

Values are presented as mean ± standard deviation.

Midline, midpalatal suture line; Left 1.5 and 3.0, lines marked 1.5 and 3.0 mm from the midpalatal suture, respectively, on the left side; Right 1.5 and 3.0, lines marked 1.5 and 3.0 mm from the midpalatal suture, respectively, on the right side; Anterior, area from 0 to 8 mm; Middle, area from 10 to 16 mm; Posterior, area from 18 to 24 mm.

Table 3
Comparison of palatal heights (mm) between male and female
Midline-Lateral Sex Hard tissue Soft tissue
Anterior Middle Posterior Anterior Middle Posterior
Left 3.0 Male 7.77 ± 2.31 3.92 ± 1.46 3.22 ± 1.24 2.12 ± 0.71 1.43 ± 0.60 1.50 ± 0.69
Female 6.45 ± 2.09 3.81 ± 1.39 3.62 ± 1.28 1.89 ± 0.55 1.28 ± 0.50 1.21 ± 0.50
Adjusted p-value 0.0006*** 0.3413 0.1643 0.0068** 0.0675 0.0096**
Left 1.5 Male 6.34 ± 1.77 4.59 ± 1.49 4.49 ± 1.45 1.75 ± 0.54 1.23 ± 0.43 1.21 ± 0.50
Female 5.21 ± 1.74 4.49 ± 1.39 4.96 ± 1.43 1.68 ± 0.64 1.11 ± 0.50 1.00 ± 0.54
Adjusted p-value 0.0006*** 0.4515 0.1017 0.2242 0.1643 0.0189*
Midline Male 6.00 ± 1.31 5.93 ± 1.74 6.75 ± 2.22 1.72 ± 0.49 1.32 ± 0.37 1.25 ± 0.55
Female 5.01 ± 1.27 5.85 ± 1.55 7.34 ± 1.80 1.57 ± 0.51 1.13 ± 0.36 1.00 ± 0.41
Adjusted p-value 0.0006*** 0.8673 0.0687 0.0092** 0.0009*** 0.0021**
Right 1.5 Male 6.49 ± 1.79 4.83 ± 1.66 4.87 ± 1.97 1.75 ± 0.51 1.19 ± 0.40 1.24 ± 0.65
Female 5.07 ± 1.59 4.60 ± 1.41 5.17 ± 1.68 1.62 ± 0.50 1.09 ± 0.38 0.99 ± 0.47
Adjusted p-value 0.0006*** 0.2133 0.5365 0.0180* 0.0675 0.0035**
Right 3.0 Male 7.58 ± 2.25 3.96 ± 1.48 3.41 ± 1.47 2.15 ± 0.70 1.44 ± 0.50 1.53 ± 0.83
Female 6.43 ± 2.22 3.79 ± 1.40 3.79 ± 1.32 1.87 ± 0.49 1.22 ± 0.38 1.16 ± 0.51
Adjusted p-value 0.0009*** 0.2535 0.1150 0.0006*** 0.0010** 0.0010**

Values are presented as mean ± standard deviation.

Midline, midpalatal suture line; Left 1.5 and 3.0, lines marked 1.5 and 3.0 mm from the midpalatal suture, respectively, on the left side; Right 1.5 and 3.0, lines marked 1.5 and 3.0 mm from the midpalatal suture, respectively, on the right side; Anterior, area from 0 to 8 mm; Middle, area from 10 to 16 mm; Posterior, area from 18 to 24 mm.

Analysis of covariance with age as the covariate (false discovery rate adjustment); *p < 0.05, **p < 0.01, ***p < 0.001.

Table 4
Comparison of palatal heights (mm) among different age groups
Midline-Lateral Age
group
Hard tissue Soft tissue
Anterior Middle Posterior Anterior Middle Posterior
Left 3.0 1 6.16 ± 1.77a 3.49 ± 1.16 3.35 ± 1.17 1.93 ± 0.52 1.24 ± 0.45 1.30 ± 0.60
2 6.63 ± 2.00b 3.86 ± 1.29 3.52 ± 1.17 1.86 ± 0.60a 1.30 ± 0.59 1.21 ± 0.50
3 7.45 ± 2.46 3.81 ± 1.69 3.22 ± 1.46 2.01 ± 0.72b 1.38 ± 0.59 1.50 ± 0.76
4 8.08 ± 2.58ab 4.27 ± 1.42 3.73 ± 1.29 2.31 ± 0.60ab 1.47 ± 0.45 1.39 ± 0.65
Adjusted p-value 0.0013** 0.1151 0.5074 0.0068** 0.3917 0.3703
Left 1.5 1 5.37 ± 1.74 4.27 ± 1.18 4.82 ± 1.34 1.55 ± 0.35a 1.02 ± 0.29 1.00 ± 0.53
2 5.67 ± 1.77 4.45 ± 1.29 4.72 ± 1.36 1.55 ± 0.60b 1.06 ± 0.52a 0.99 ± 0.45
3 6.00 ± 2.03 4.56 ± 1.66 4.56 ± 1.58 1.75 ± 0.55c 1.29 ± 0.50 1.24 ± 0.53
4 5.58 ± 1.77 4.92 ± 1.54 5.11 ± 1.56 2.18 ± 0.63abc 1.34 ± 0.40a 1.17 ± 0.48
Adjusted p-value 0.6924 0.3083 0.7661 0.0005*** 0.0066** 0.1152
Midline 1 5.33 ± 1.26 5.73 ± 1.35 7.14 ± 1.91 1.52 ± 0.31a 1.07 ± 0.25ab 0.99 ± 0.56
2 5.54 ± 1.38 5.91 ± 1.51 7.04 ± 1.75 1.44 ± 0.37b 1.08 ± 0.28cd 0.99 ± 0.37a
3 5.48 ± 1.49 6.01 ± 1.97 7.09 ± 2.43 1.71 ± 0.43c 1.34 ± 0.40ace 1.26 ± 0.52
4 5.23 ± 1.29 5.79 ± 1.63 7.16 ± 2.03 2.10 ± 0.69abc 1.48 ± 0.45bde 1.27 ± 0.53a
Adjusted p-value 0.6967 0.9347 0.9347 0.0005*** 0.0005*** 0.0068**
Right 1.5 1 5.38 ± 1.46 4.58 ± 1.47 5.11 ± 2.01 1.52 ± 0.33a 0.98 ± 0.22a 1.05 ± 0.76
2 5.80 ± 2.06 4.66 ± 1.28 4.90 ± 1.31 1.51 ± 0.37b 1.02 ± 0.34bc 0.96 ± 0.33a
3 5.81 ± 1.77 4.69 ± 1.89 4.89 ± 2.15 1.73 ± 0.45c 1.22 ± 0.44b 1.17 ± 0.50
4 5.48 ± 1.61 4.93 ± 1.51 5.55 ± 2.06 2.14 ± 0.69abc 1.39 ± 0.40ac 1.35 ± 0.78a
Adjusted p-value 0.5060 0.4925 0.4301 0.0005*** 0.0005*** 0.0037**
Right 3.0 1 6.08 ± 1.68a 3.48 ± 1.21 3.42 ± 1.33 1.82 ± 0.38a 1.17 ± 0.24a 1.33 ± 0.91
2 6.72 ± 2.19b 3.86 ± 1.23 3.57 ± 1.10 1.86 ± 0.46b 1.23 ± 0.41b 1.22 ± 0.48
3 7.26 ± 2.47 3.89 ± 1.83 3.68 ± 1.81 2.07 ± 0.75c 1.40 ± 0.51 1.41 ± 0.62
4 7.72 ± 2.56ab 4.22 ± 1.34 3.88 ± 1.34 2.37 ± 0.66abc 1.51 ± 0.51ab 1.41 ± 0.94
Adjusted p-value 0.0235* 0.1652 0.4070 0.0005*** 0.0037** 0.3917

Values are presented as mean ± standard deviation.

Superscript lowercase letters in the same column indicate statistically significant differences between the groups.

Midline, midpalatal suture line; Left 1.5 and 3.0, lines marked 1.5 and 3.0 mm from the midpalatal suture, respectively, on the left side; Right 1.5 and 3.0, lines marked 1.5 and 3.0 mm from the midpalatal suture, respectively, on the right side; Anterior, area from 0 to 8 mm; Middle, area from 10 to 16 mm; Posterior, area from 18 to 24 mm; Age group 1, mixed dentition; Age group 2, permanent dentition (10's); Age group 3, permanent dentition (20's); Age group 4, permanent dentition (over 30's).

Analysis of covariance with sex as the covariate (false discovery rate adjustment); *p < 0.05; **p < 0.01; ***p < 0.001.

TOOLS
Similar articles