INTRODUCTION
METHODS
Experimental animals
Experimental design
Induction of type 2 diabetes
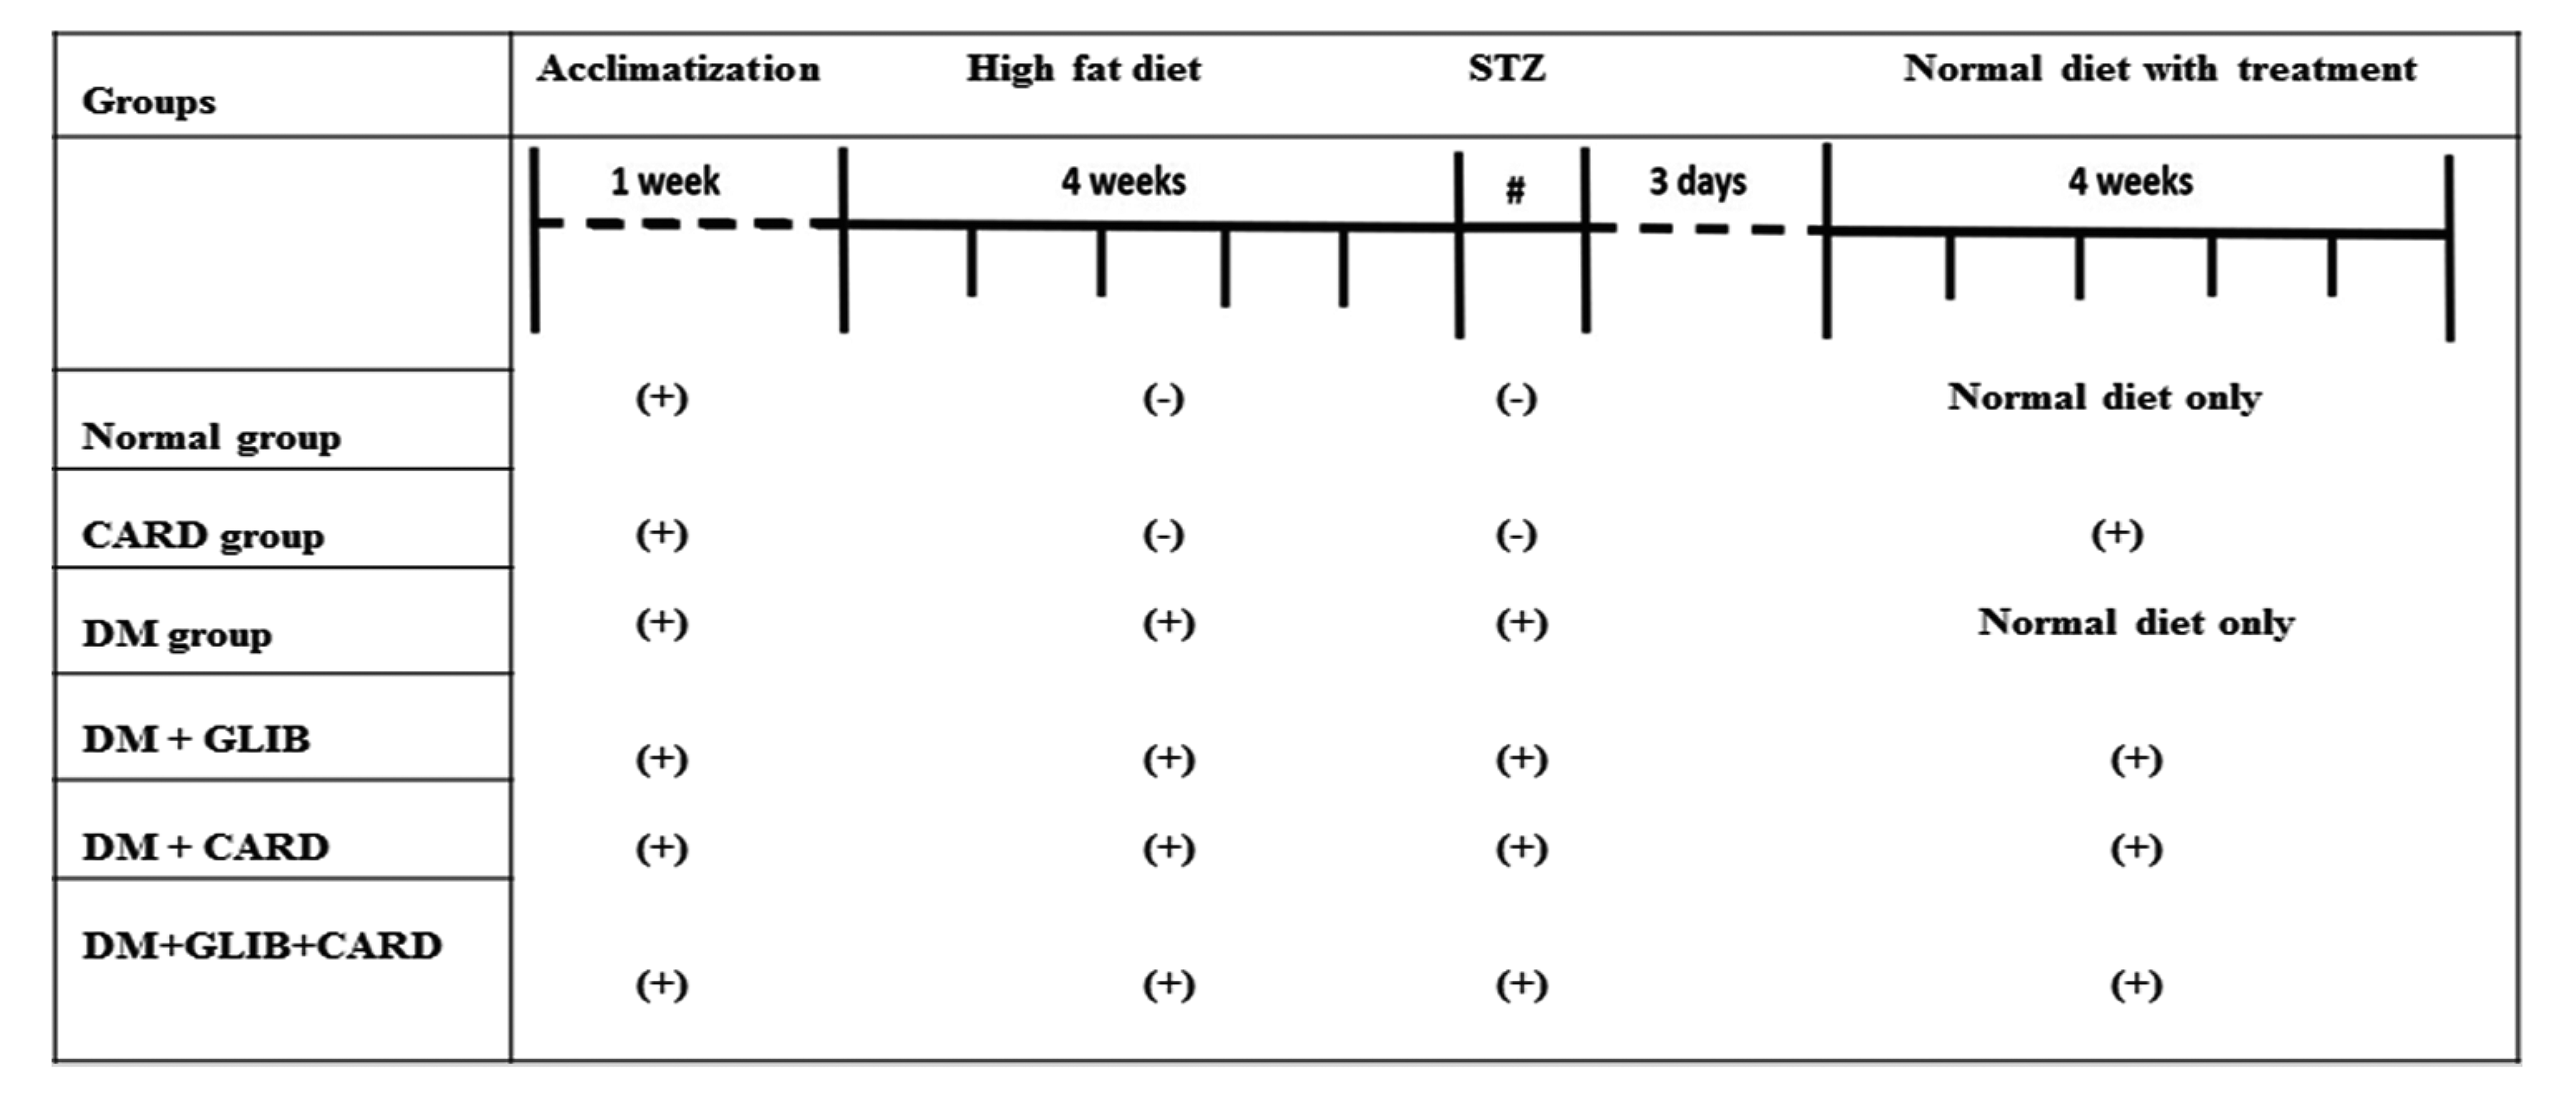 | Fig. 1Time schedule for the experimental design.CARD, normal rats supplemented with cardamonin; DM, untreated diabetic group; DM + GLIB, diabetic rats treated with glibenclamide; DM + CARD, diabetic rats treated with cardamonin; DM + GLIB + CARD, diabetic rats treated with both glibenclamide and cardamonin. #Represents the administration of STZ.
|
Measurement of fasting blood glucose and insulin levels and Homeostatic Model Assessment of Insulin Resistance (HOMA-IR)
Estimation of key testicular androgenic enzyme activities
Estimation of testicular TBARS and antioxidants activities
Sperm sample from epididymis
Histopathological and immunohistochemical examination
Total RNA isolation and real-time PCR analysis
Western blot analysis
Statistical analysis
RESULTS
Effects of CARD on weights of the body and testicles in type 2 diabetic rats
Table 1
| Variable |
Final body weight (gm) |
Testicular weight (gm) |
Fasting blood glucose (mg/dl) |
Fasting insulin (µIU/ml) |
HOMA-IR |
|---|---|---|---|---|---|
| Control | 282.56 ± 1.76 | 1.68 ± 0.09 | 74.26 ± 2.98 | 15.04 ± 1.31 | 2.76 |
| CARD | 280.06 ± 2.85 | 1.71 ± 0.08 | 72.15 ± 2.25 | 16.09 ± 1.02 | 2.87 |
| DM | 221.33 ± 2.33* | 1.09 ± 0.07* | 384.27 ± 3.54* | 5.78 ± 1.28* | 5.48 |
| DM + GLIB | 255.66 ± 3.51*,# | 1.29 ± 0.08*,# | 143.32 ± 4.76*,# | 12.61 ± 1.18*,# | 4.46 |
| DM + CARD | 241.733 ± 2.59*,#,$ | 1.49 ± 0.08*,#,$ | 157.74 ± 3.79*,#,$ | 11.89 ± 1.19*,#,$ | 4.63 |
| DM + GLIB + CARD | 272.41 ± 2.31*,#,$,@ | 1.56 ± 0.09#,$,@ | 97.72 ± 4.37*,#,$,@ | 14.57 ± 1.40#,$,@ | 3.51 |
Values are presented as mean ± SD. CARD, normal rat supplemented with cardamonin; HOMA-IR, homeostatic model assessment of insulin resistance; DM, untreated diabetic group; DM + GLIB, diabetic rats treated with glibenclamide; DM + CARD, diabetic rats treated with cardamonin; DM + GLIB + CARD, diabetic rats treated with both glibenclamide and cardamonin. Test used: One-way ANOVA followed by post-hoc Tukey’s test. *Represents significance compared with the control group; #represents significance compared with the DM group; $represents significance compared with the DM + GLIB group; @represents significance compared with the DM + CARD group.
Effects of CARD on the levels of blood glucose, serum insulin and HOMA-IR
Effects of CARD on the serum levels of testosterone and pituitary gonadotropins
Table 2
| Variable | Testosterone (ng/ml) | FSH (ng/ml) | LH (ng/ml) | Sperm number (×106) | Sperm motility (%) |
|---|---|---|---|---|---|
| Control | 4.89 ± 0.97 | 6.22 ± 0.64 | 7.21 ± 0.90 | 167.46 ± 6.45 | 13.60 ± 1.43 |
| CARD | 5.13 ± 0.83 | 6.60 ± 0.84 | 7.55 ± 0.49 | 171.22 ± 6.82 | 14.84 ± 1.42 |
| DM | 1.25 ± 0.21* | 2.92 ± 0.65* | 4.11 ± 0.89* | 42.22 ± 8.37* | 3.18 ± 0.88* |
| DM + GLIB | 2.34 ± 0.65*,# | 3.54 ± 0.64*,# | 4.62 ± 0.89*,# | 87.10 ± 6.33*,# | 5.33 ± 0.75*,# |
| DM + CARD | 3.02 ± 0.64*,#,$ | 4.48 ± 0.63*,#,$ | 5.16 ± 0.90*,#,$ | 100.35 ± 7.10*,#,$ | 6.88 ± 0.89*,#,$ |
| DM + GLIB + CARD | 3.85 ± 0.53#,$,@ | 5.18 ± 0.87#,$,@ | 6.29 ± 0.89#,$,@ | 138.24 ± 8.95*,#,$,@ | 10.87 ± 1.39*,#,$,@ |
Values are presented as mean ± SD. CARD, normal rat supplemented with cardamonin; FSH, follicle stimulating hormone; LH, luteinizing hormone; DM, untreated diabetic group; DM + GLIB, diabetic rats treated with glibenclamide; DM + CARD, diabetic rats treated with cardamonin; DM + GLIB + CARD, diabetic rats treated with both glibenclamide and cardamonin. Test used: One-way ANOVA followed by post-hoc Tukey’s test. *Represents significance compared with the control group; #represents significance compared with the DM group; $represents significance compared with the DM + GLIB group; @represents significance compared with the DM + CARD group.
Effect of CARD on epididymal sperm analysis
Effect of CARD on testicular function-related markers
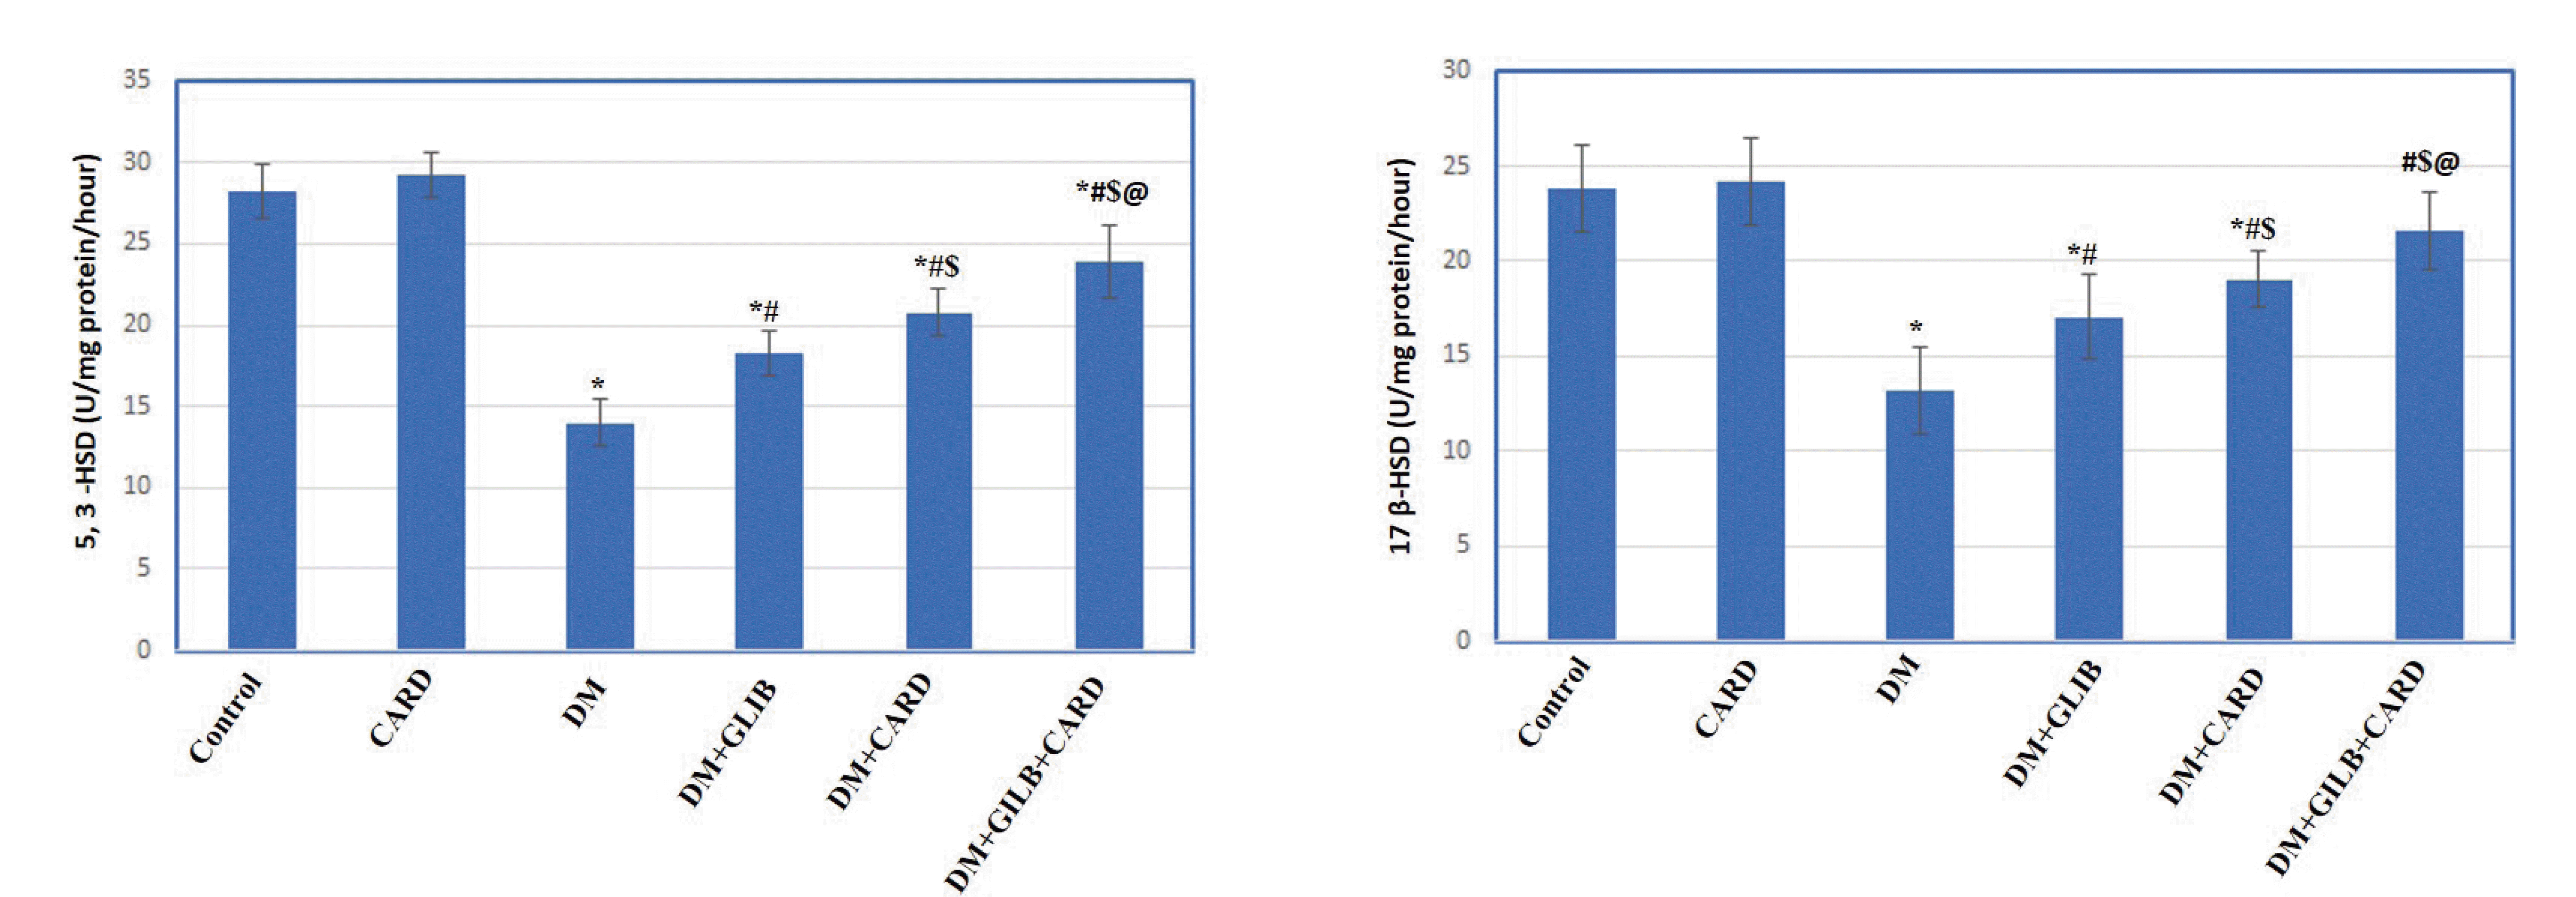 | Fig. 2Effect of cardamonin on key testicular steroid enzymes in different experimental groups.Values are presented as mean ± SD. CARD, normal rats treated with cardamonin; DM, untreated diabetic group; DM + GLIB, diabetic rats treated with glibenclamide; DM + CARD, diabetic rats treated with cardamonin; DM + GLIB + CARD, diabetic rats treated with both glibenclamide and cardamonin. Tests used: One-way ANOVA followed by post-hoc Tukey’s test. p < 0.001. *Represents significance compared with the control group; #represents significance compared with the DM group; $represents significance compared with the DM + GLIB group; @represents significance compared with the DM + CARD group.
|
Effect of CARD on testicular antioxidant enzymes and oxidative stress marker
 | Fig. 3Effect of cardamonin on testicular oxidative stress markers and antioxidant activities in different experimental groups.Values are presented as mean ± SD. CARD, normal rats treated with cardamonin; DM, untreated diabetic group; DM + GLIB, diabetic rats treated with glibenclamide; DM + CARD, diabetic rats treated with cardamonin; DM + GLIB + CARD, diabetic rats treated with both glibenclamide and cardamonin. Tests used: One-way ANOVA followed by post-hoc Tukey’s test. p < 0.001. *Represents significance compared with the control group; #represents significance compared with the DM group; $represents significance compared with the DM + GLIB group; @represents significance compared with the DM + CARD group.
|
Effect of CARD on the gene expression of Nrf2, Keap-1, and p62
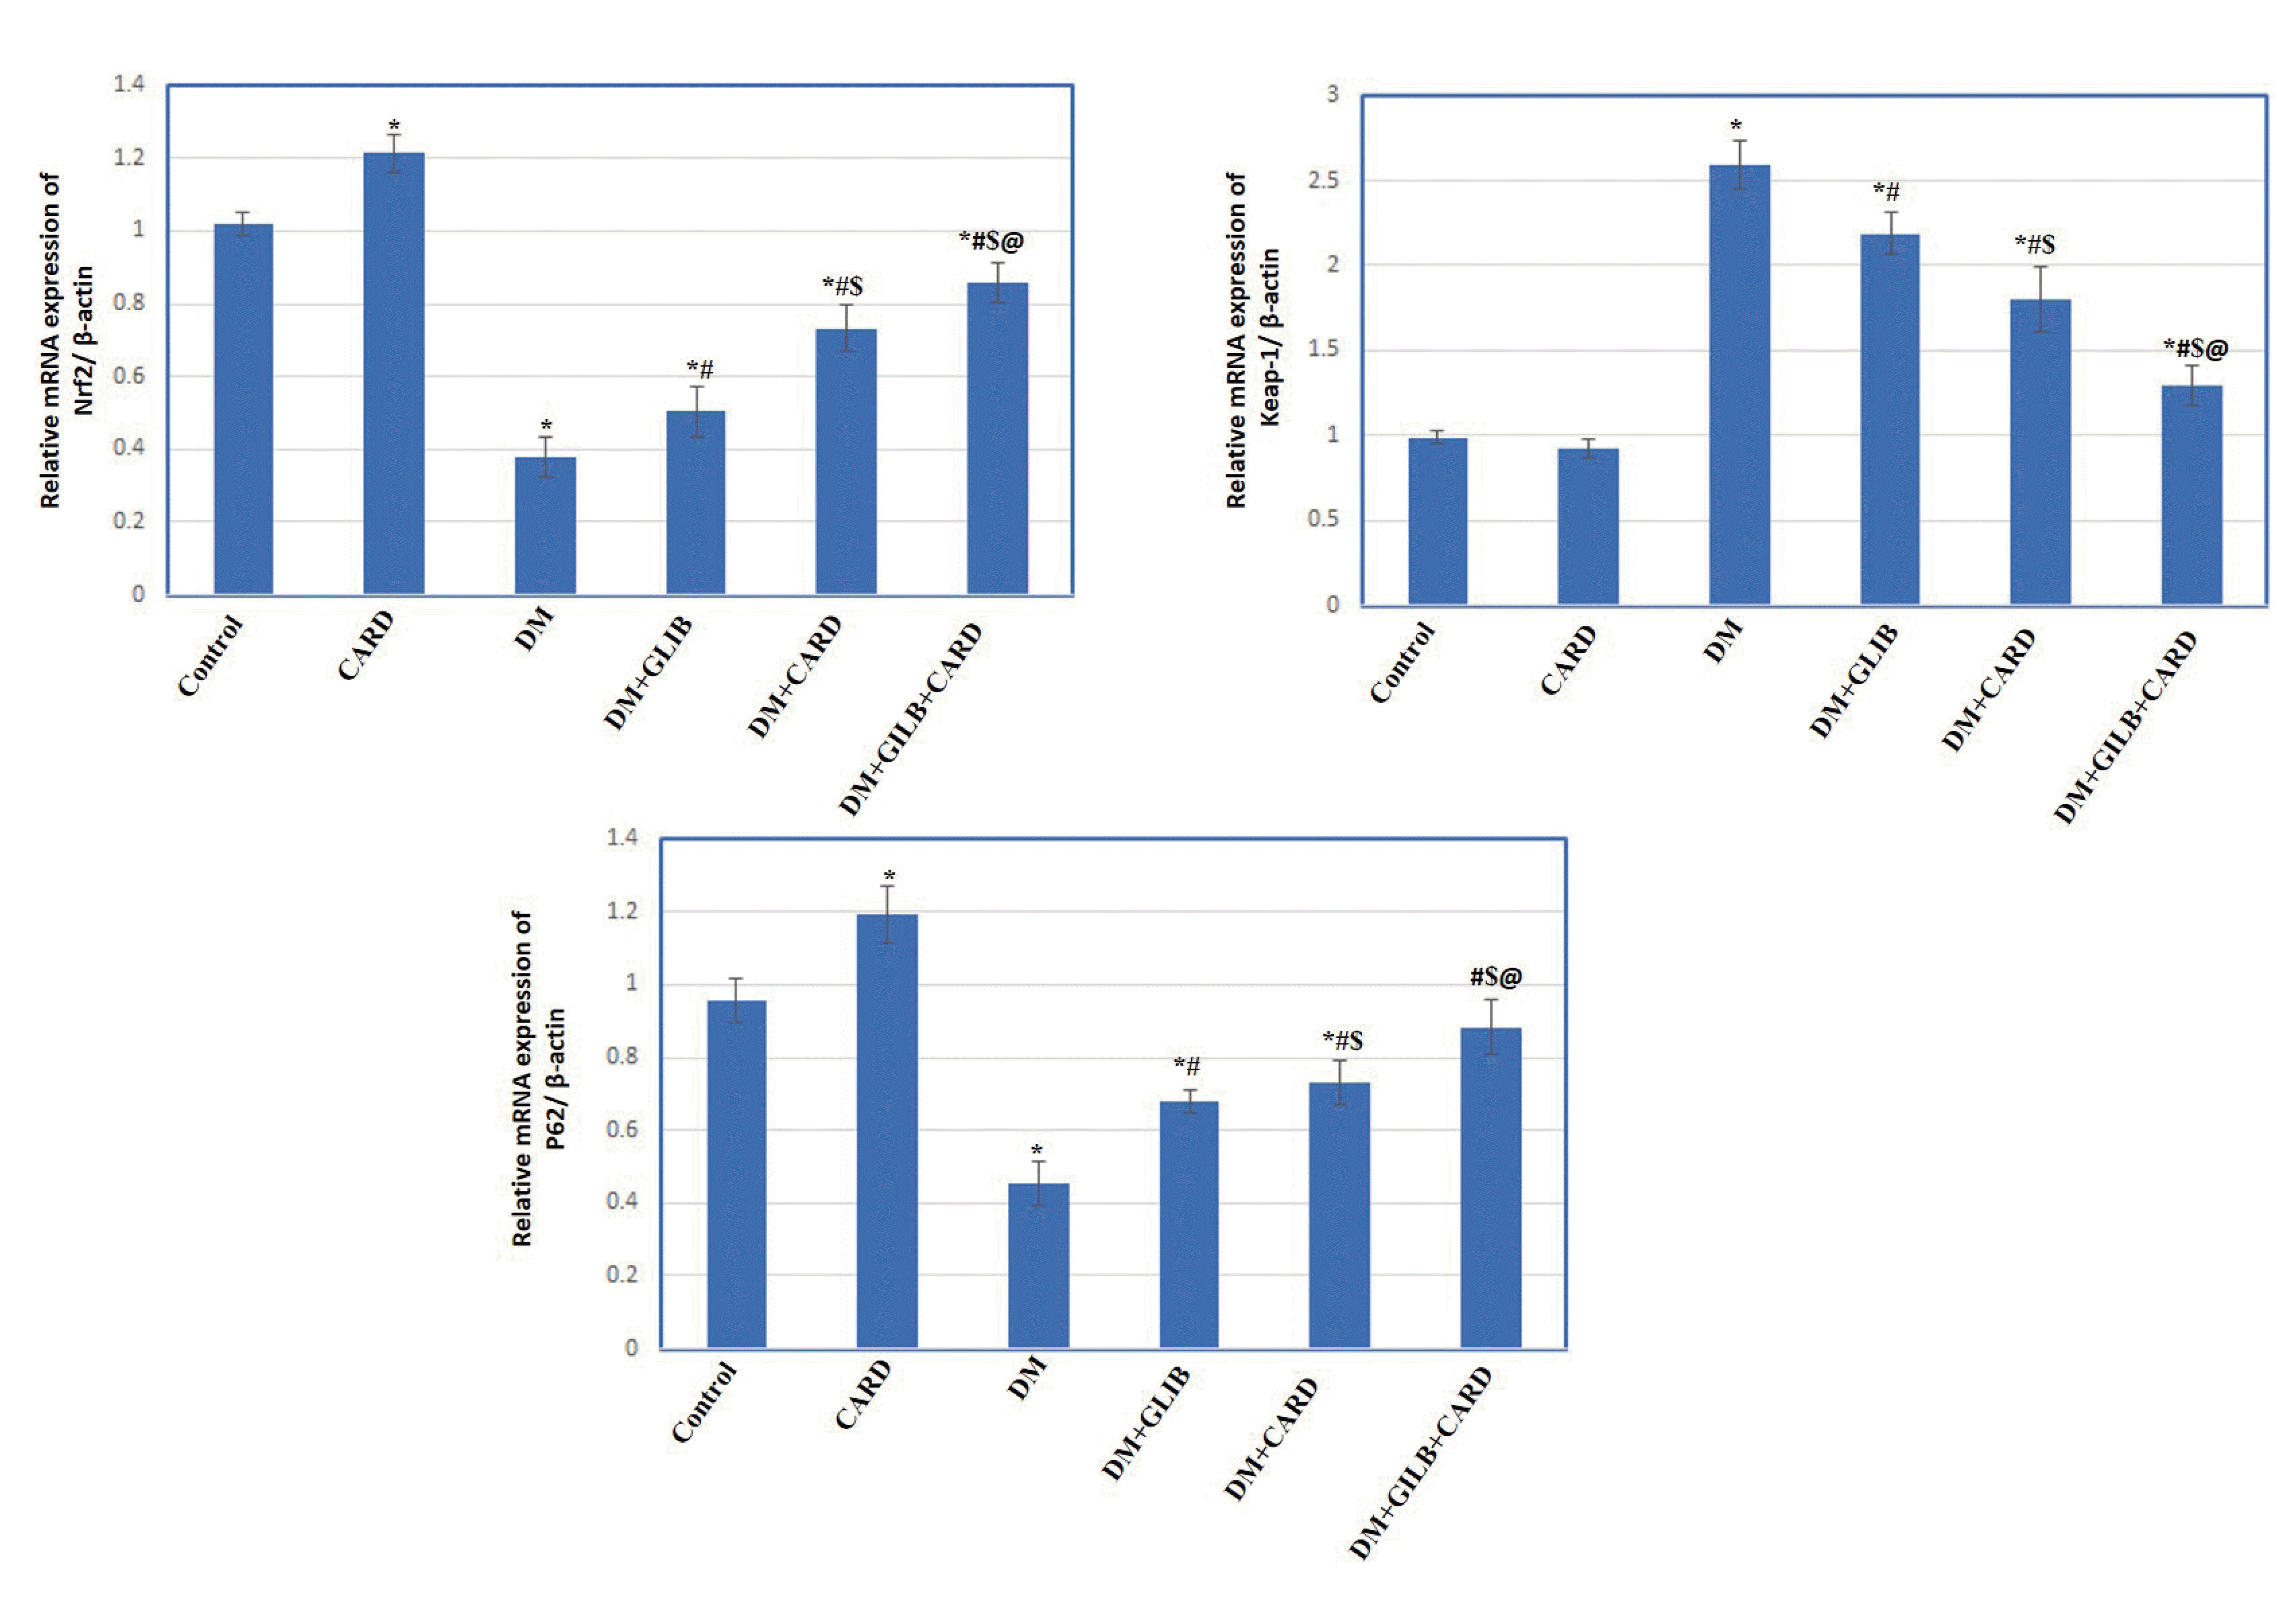 | Fig. 4Effect of cardamonin on the testicular mRNA expression of Nrf2, Keap-1 and p62 in different experimental groups.Values are presented as mean ± SD. CARD, normal rats treated with cardamonin; DM, untreated diabetic group; DM + GLIB, diabetic rats treated with glibenclamide; DM + CARD, diabetic rats treated with cardamonin; DM + GLIB + CARD, diabetic rats treated with both glibenclamide and cardamonin. Tests used: One-way ANOVA followed by post-hoc Tukey’s test. p < 0.001. *Represents significance compared with the control group; #represents significance compared with the DM group; $represents significance compared with the DM + GLIB group; @represents significance compared with the DM + CARD group.
|
Effect of CARD on the protein expression of Nrf2, Keap-1, and p62
 | Fig. 6Effect of cardamonin on the testicular protein expression of Nrf2, Keap-1, p62 and autophagy markers in different experimental groups.The testicular expression of Nrf2, Keap-1, p62 and autophagy markers (LC3, beclin-1) proteins was detected by western blotting assay. Values are presented as mean ± SD. CARD, normal rats treated with cardamonin; DM, untreated diabetic group; DM + GLIB, diabetic rats treated with glibenclamide; DM + CARD, diabetic rats treated with cardamonin; DM + GLIB + CARD, diabetic rats treated with both glibenclamide and cardamonin. Tests used: One-way ANOVA followed by post-hoc Tukey’s test. p < 0.001. *Represents significance compared with the control group; #represents significance compared with the DM group; $represents significance compared with the DM + GLIB group; @represents significance compared with the DM + CARD group.
|
Effect of CARD on the expression of autophagy related genes markers
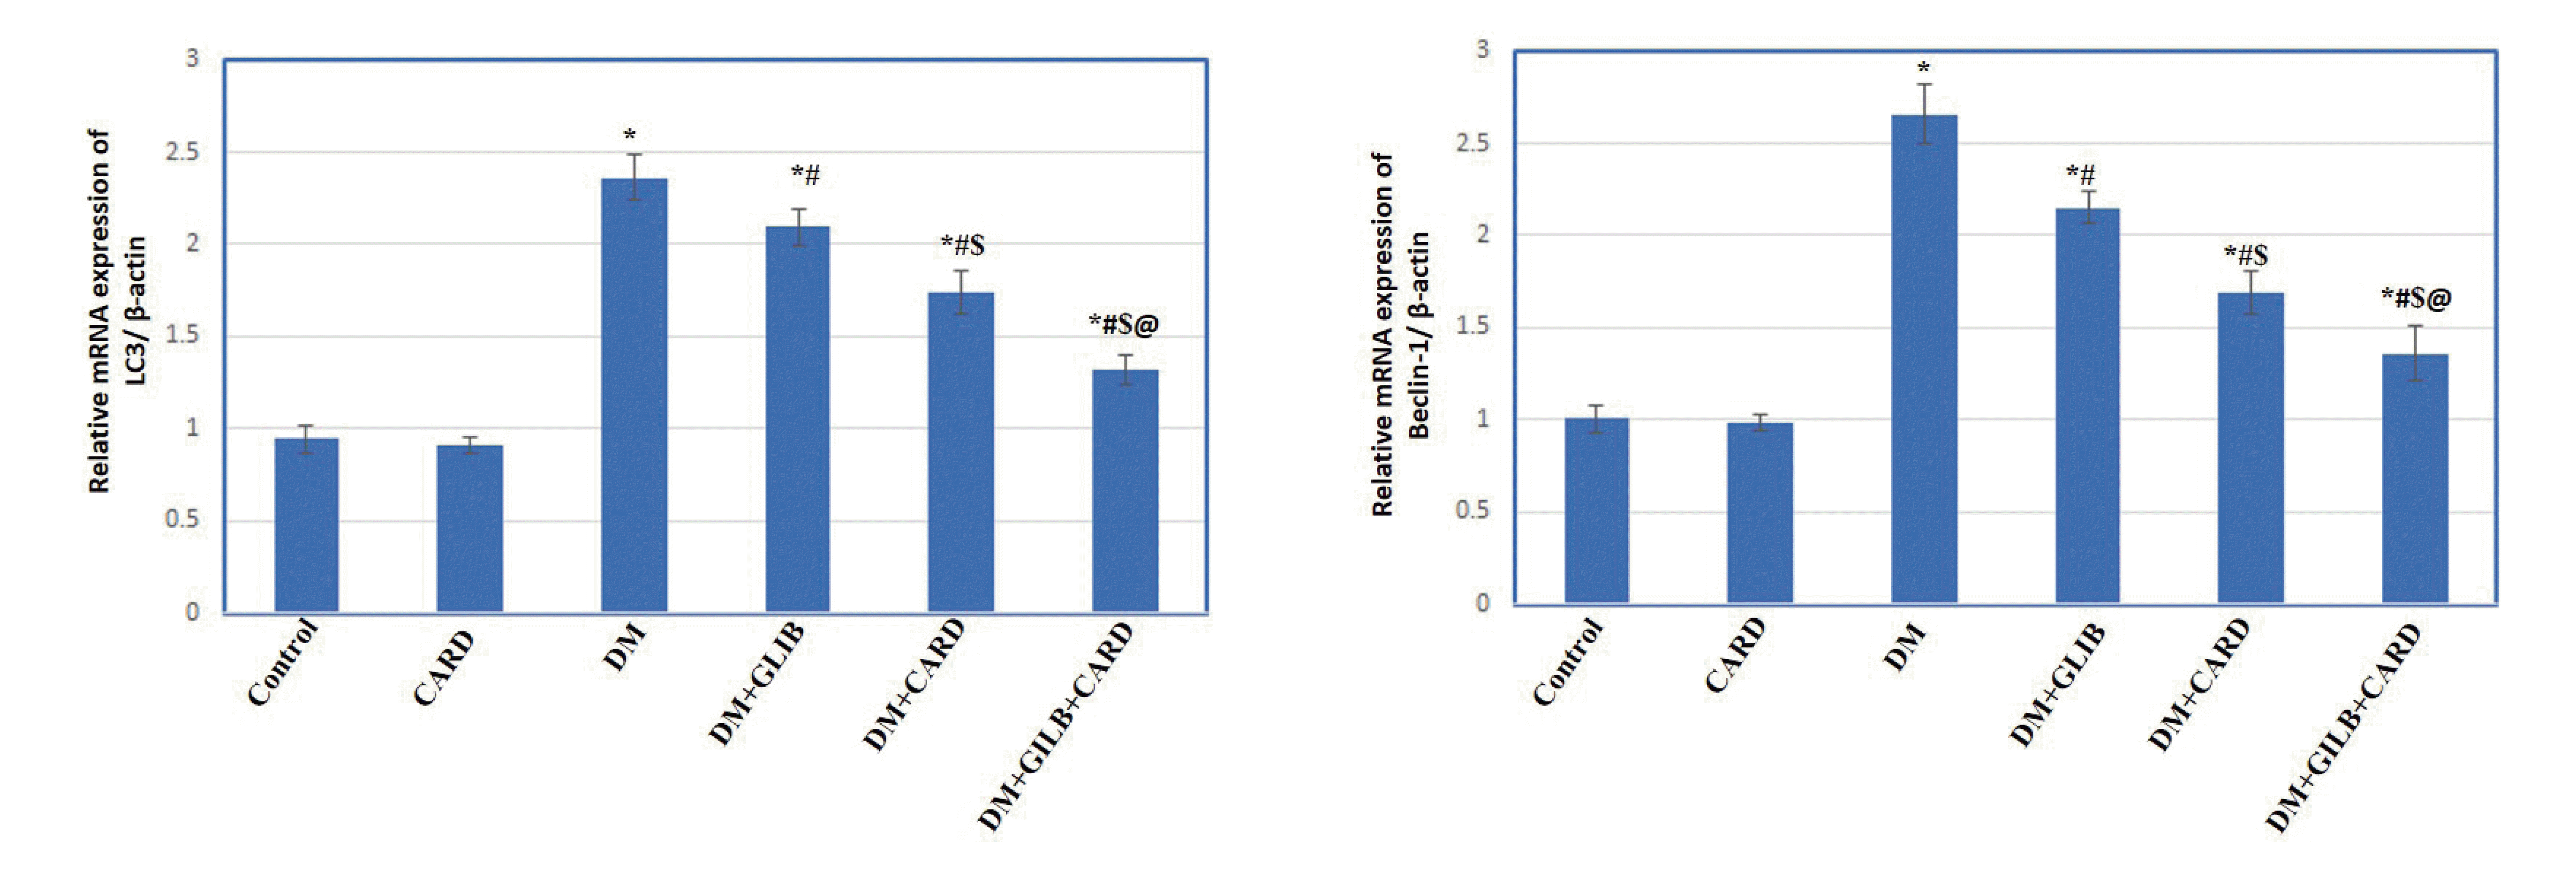 | Fig. 5Effect of cardamonin on the testicular mRNA expression of autophagy markers (LC3 and beclin-1) in different experimental groups.Values are presented as mean ± SD. CARD, normal rats treated with cardamonin; DM, untreated diabetic group; DM + GLIB, diabetic rats treated with glibenclamide; DM + CARD, diabetic rats treated with cardamonin; DM + GLIB + CARD, diabetic rats treated with both glibenclamide and cardamonin. Tests used: One-way ANOVA followed by post-hoc Tukey’s test. p < 0.001. *Represents significance compared with the control group; #represents significance compared with the DM group; $represents significance compared with the DM + GLIB group; @represents significance compared with the DM + CARD group.
|
Effect of CARD on the gene expression of autophagy related proteins markers
Effect of CARD on the mRNA levels of testicular GLUT-8
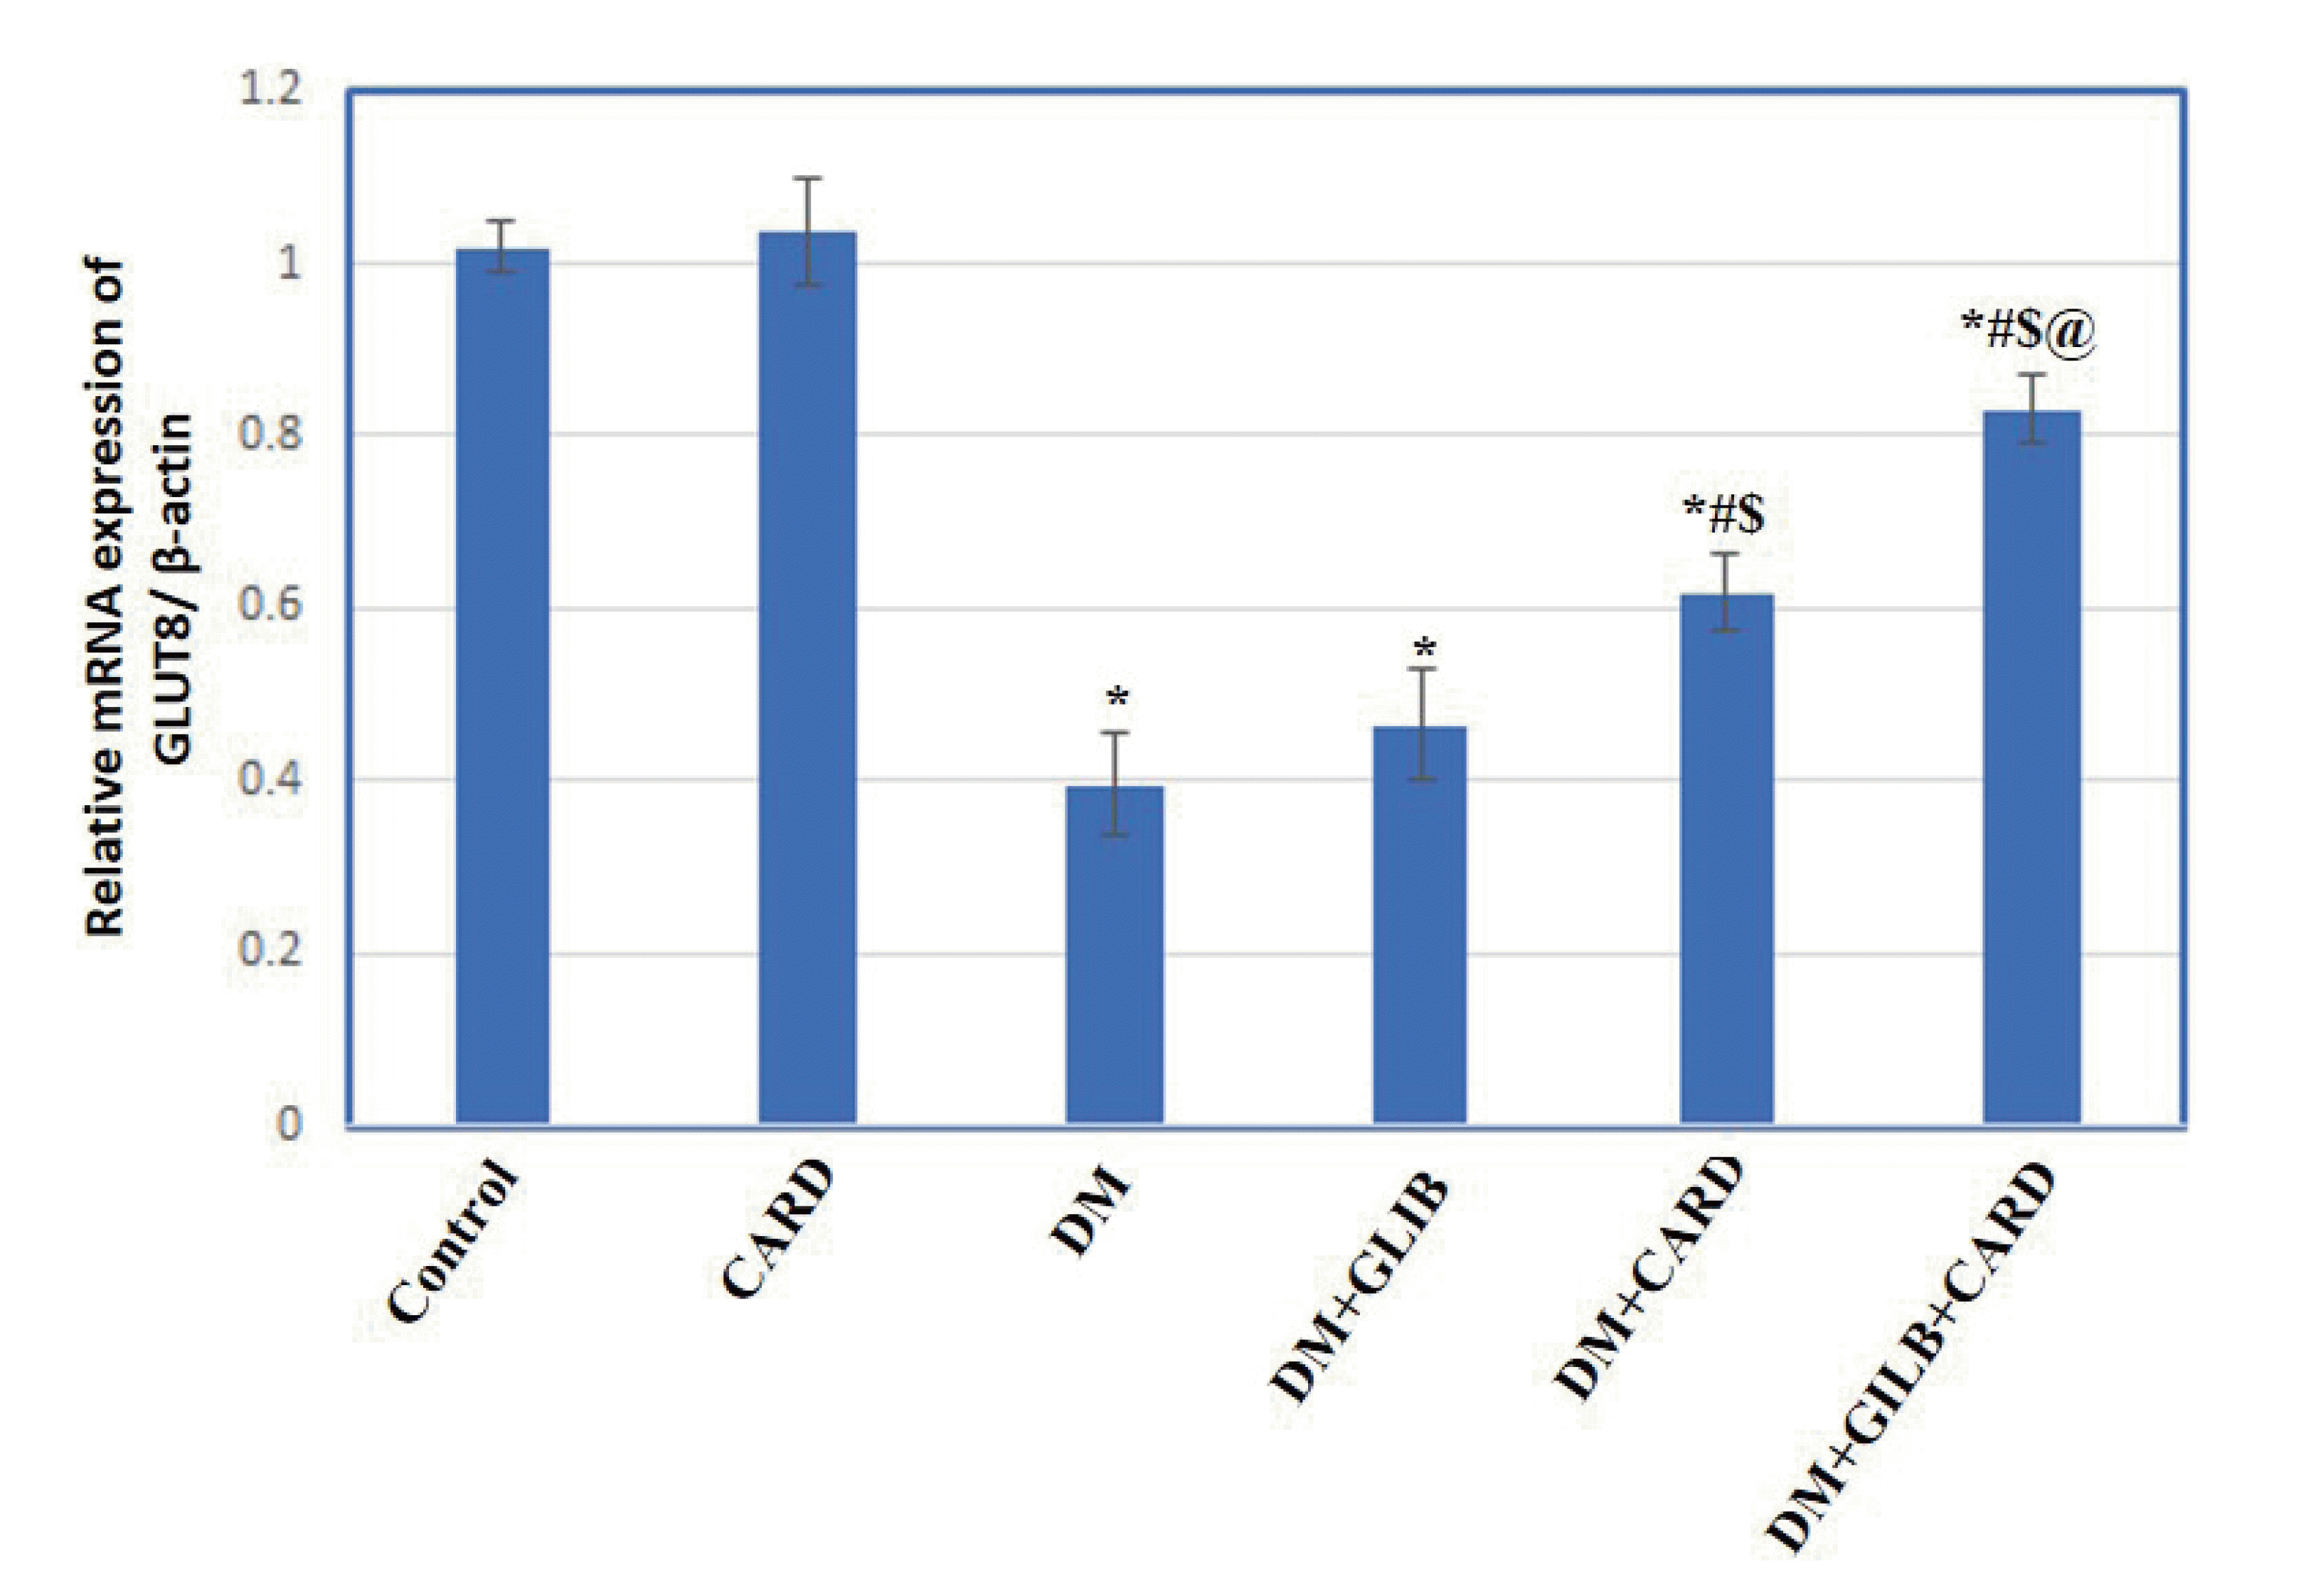 | Fig. 7Effect of cardamonin on testicular glucose transporter-8 (GLUT-8) mRNA expression in different experimental groups.Values are presented as mean ± SD. CARD, normal rats treated with cardamonin; DM, untreated diabetic group; DM + GLIB, diabetic rats treated with glibenclamide; DM + CARD, diabetic rats treated with cardamonin; DM + GLIB + CARD, diabetic rats treated with both glibenclamide and cardamonin. Tests used: One-way ANOVA followed by post-hoc Tukey’s test. p < 0.001. *Represents significance compared with the control group; #represents significance compared with the DM group; $represents significance compared with the DM + GLIB group; @represents significance compared with the DM + CARD group.
|
Effect of CARD on the testicular morphology
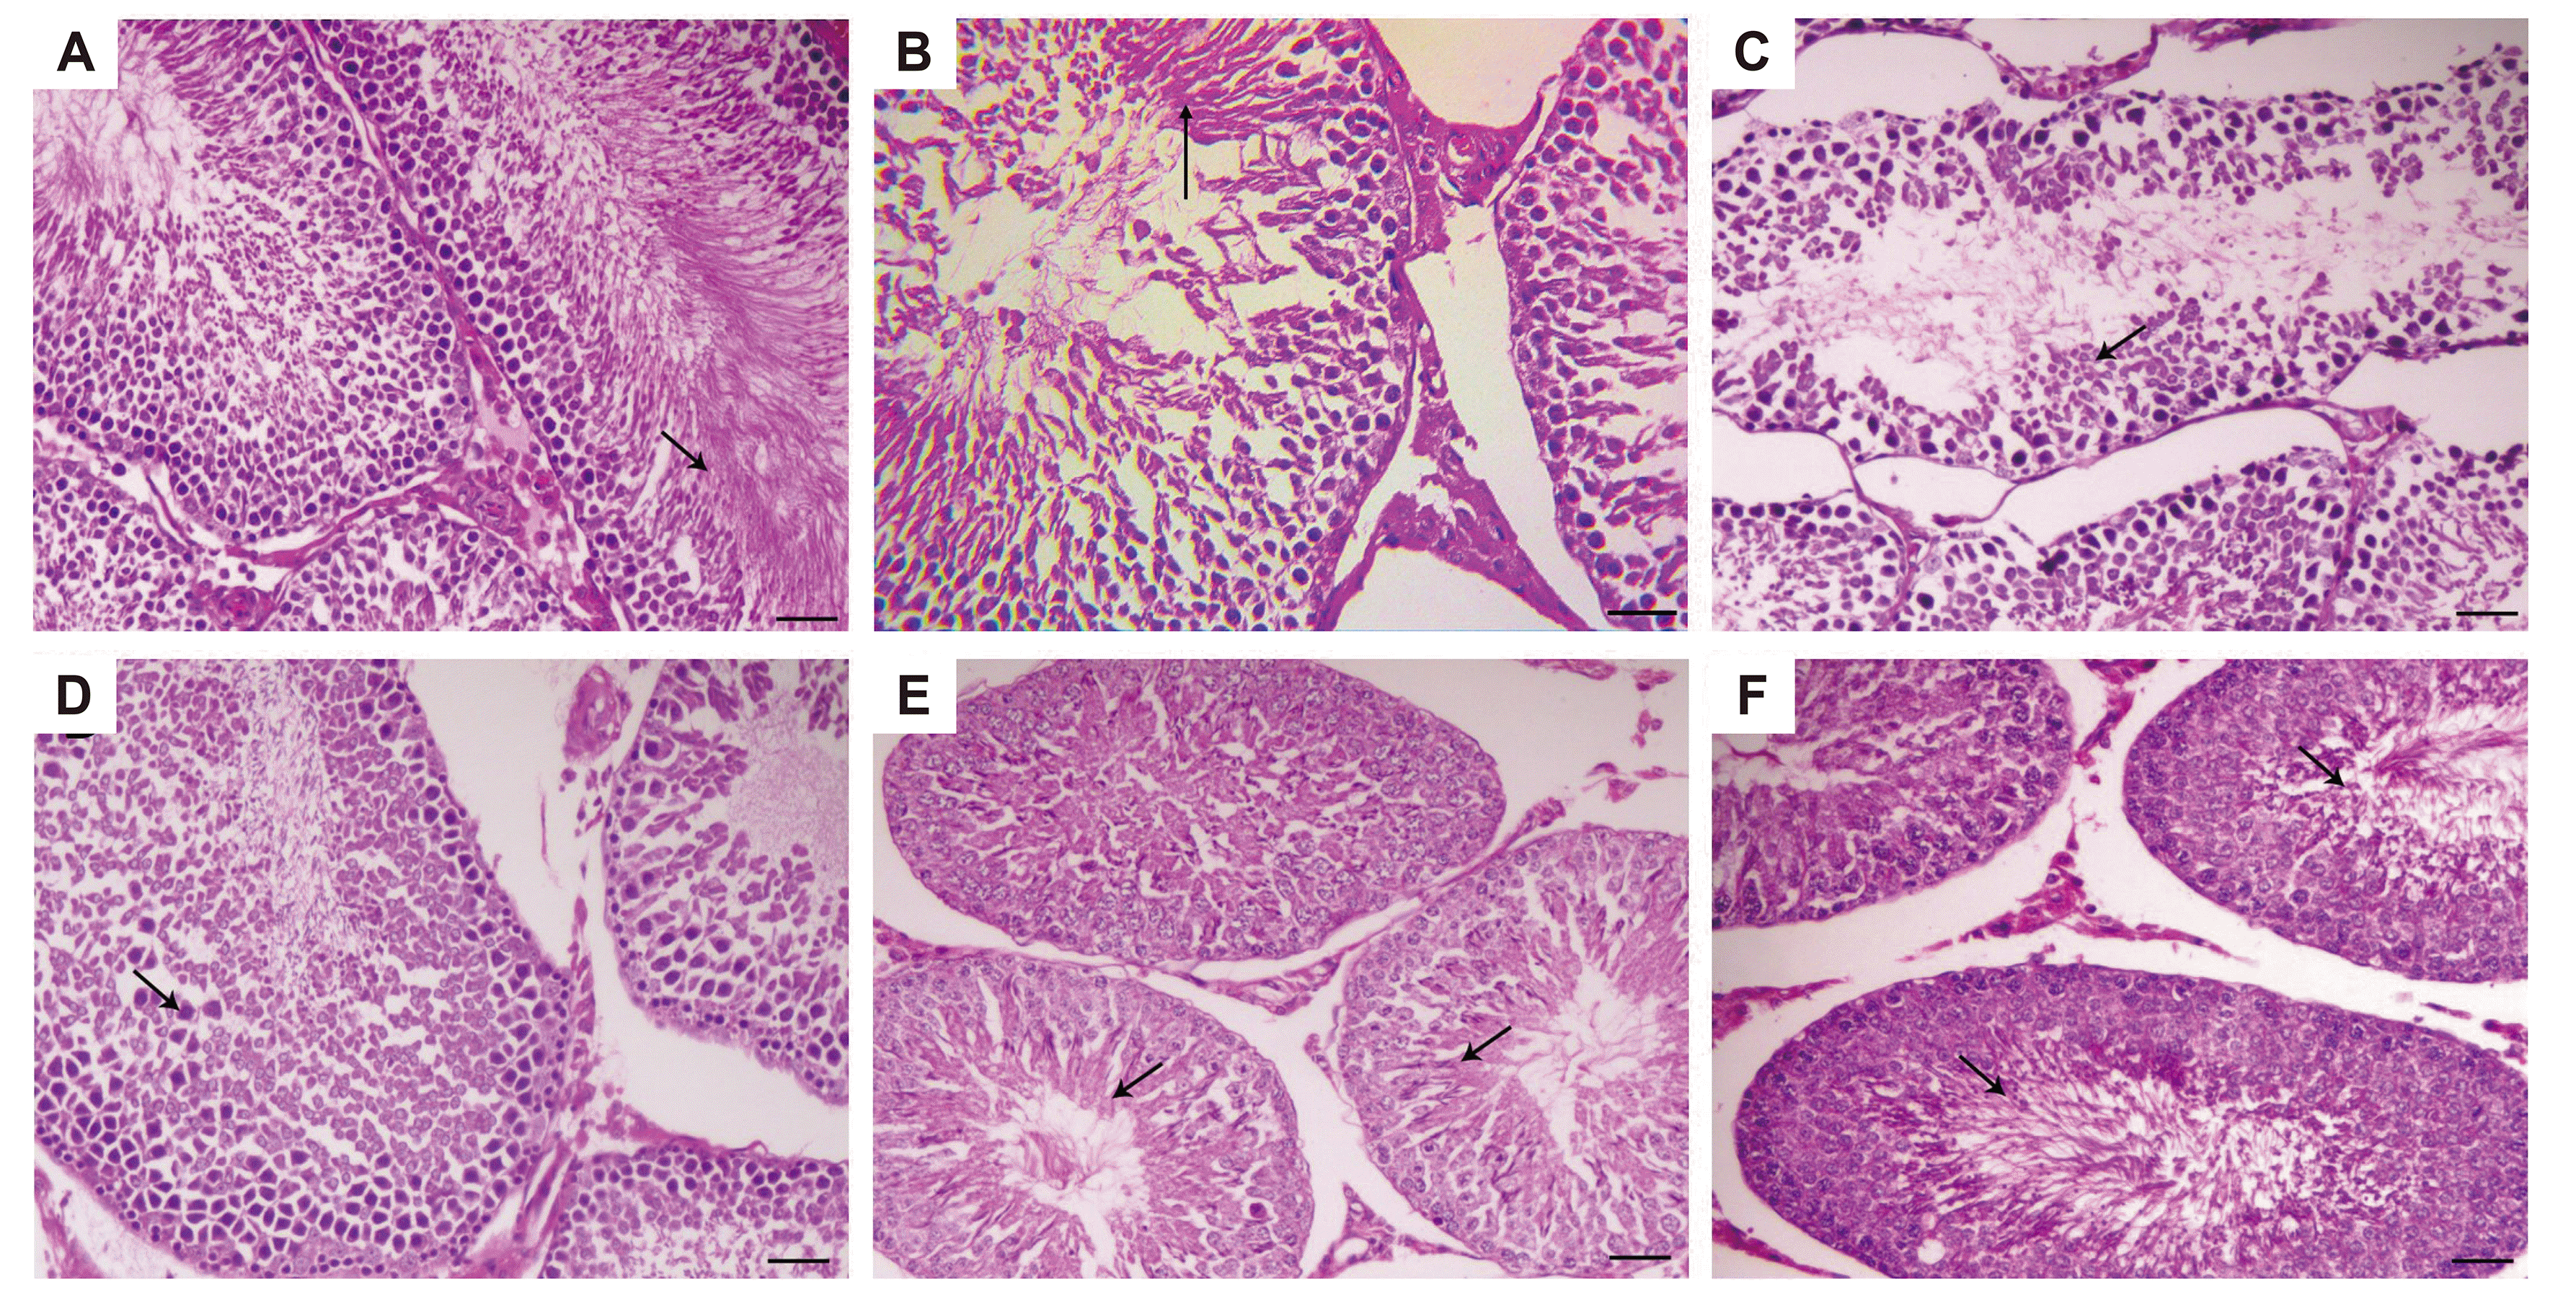 | Fig. 8Effect of cardamonin on histopathological testicular changes in different experimental groups.Testis of the control group showing normal seminiferous tubules lined with normal spermatogenic cells with the presence of numerous free spermatids in the lumen (arrow). (B) Testis of the CARD group showing normal seminiferous tubules lined with normal spermatogenic cells with the presence of numerous free spermatids in the lumen (arrow). (C) Testis of untreated DM rats showing a marked loss of spermatogenic epithelial layers and damaged appearance of the basal layer with the complete loss of spermatids in the lumen of seminiferous tubules (arrow). (D) Testis of the DM + GLIB group showing a decrease in the degenerative changes within the spermatogenic epithelial layers (arrow). (E) Testis of the DM + CARD group showing moderate restoration of the spermatogenic epithelial layers with mild appearance of spermatids (arrows). (F) Testis of the DM + GLIB + CARD group showing marked improvement in the spermatogenic epithelial layers with numerous spermatids (arrows). H&E, 200×, bar = 50 µm. CARD, normal rats treated with cardamonin; DM, untreated diabetic group; DM + GLIB, diabetic rats treated with glibenclamide; DM + CARD, diabetic rats treated with cardamonin; DM + GLIB + CARD, diabetic rats treated with both glibenclamide and cardamonin.
|
Effect of CARD on the testicular apoptotic marker (caspase-3)
 | Fig. 9Effect of cardamonin on the immunohistochemical testicular expression of an apoptotic marker (caspase-3) in different experimental groups.Immunohistochemical stain, 200×, bar = 50 μm. (A) Testis of the control group showing mild expression of caspase-3 antibody (arrows). (B) Testis of the CARD group showing little expression of caspase-3 antibody (arrows). (C) Testis of the untreated DM group showing marked expression of caspase-3 antibody in the spermatogenic cells of seminiferous tubules (arrows). (D) Testis of the DM + GLIB group showing a mild decrease in the expression of caspase-3 antibody in spermatogenic cells (arrows). (E) Testis of the DM + CARD group showing a moderate decrease in the expression of caspase-3 antibody in spermatogenic cells (arrows). (F) Testis of the DM + GLIB + CARD group showing a marked decrease in the expression of caspase-3 antibody in spermatogenic cells (arrows). (G) Results showing a significant increase in the caspase-3 labelling index in the untreated diabetic testicular tissue in comparison with the control. Treatment of diabetic rats with CARD produced a marked decrease in the labelling index of the caspase-3-stained area as compared with the untreated diabetic group. The maximum decrease in the immunoreactive stain was found in the DM + GLIB + CARD group when compared with the other treated diabetic groups. CARD, normal rats treated with cardamonin; DM, untreated diabetic group; DM + GLIB, diabetic rats treated with glibenclamide; DM + CARD, diabetic rats treated with cardamonin; DM + GLIB + CARD, diabetic rats treated with both glibenclamide and cardamonin. *Represents significance compared with the control group; #represents significance compared with the DM group; $represents significance compared with the DM + GLIB group; @repre-sents significance compared with the DM + CARD group.
|


 PDF
PDF Citation
 Print
Print


 XML Download