This article has been
cited by other articles in ScienceCentral.
Abstract
Background
Hepatitis B virus (HBV) and hepatitis C virus (HCV) infections remain a serious health problem despite advancements in their prevention and treatment. Guidelines on their management recommend using viral DNA/RNA titers. Thus, accurate measurement and prompt reporting are crucial.
Methods
The performances of the Aptima HBV and HCV Quant assays (Hologic Inc., USA) were analyzed. The results were compared with those of Cobas 4800 (Roche Molecular Systems, USA). Linearity, limit of detection (LoD), and precision were evaluated as recommended in each corresponding CLSI guideline.
Results
Passing-Bablok regression analysis showed a high correlation between the two assays: regression line was y=0.0684+1.025x (95% CI: 0.9604-1.092) for HBV and y=-0.9650+1.141x (95% CI: 1.071-1.226) for HCV. Agreement between the assays’ qualitative results based on categorical analysis was 82.30% (185/224) (κ: 0.738, 95% CI: 0.701-0.775) for HBV and 94.52% (69/73) (κ: 0.855, 95% CI: 0.796-0.914) for HCV. The LoD values for HBV and HCV were 4.448 IU/mL and 6.166 IU/mL, respectively. The percent coefficient of variation (%CV) for the HBV assay for both low and high positive controls was less than 2%, whereas for the HCV assay, %CV for low positive control was 3.20%.
Conclusions
Overall, the Aptima HBV and HCV Quant assays demonstrated a high correlation with Cobas 4800. These tests were both sensitive and precise. Therefore, we conclude that the Aptima assay is a practical tool in the management of HBV- and HCV-infected patients.
Go to :

초록
배경
간염을 일으키는 HBV 및 HCV 감염은 치료 및 예방법의 발전에도 불구하고 여전히 심각한 보건 문제이다. HBV 및 HCV 감염에 대한 가이드라인들은 바이러스의 핵산물질 양을 측정하여 감염의 진단 및 치료효과 모니터링에 사용할 것을 권장하고 있다. 그렇기에 신속하고 정확한 핵산물질 측정이 매우 중요하다.
방법
이 논문에서는 Aptima HBV 및 HCV Quant assay (Hologic Inc., USA)의 성능을 Cobas 4800 (Roche Molecular Systems, USA)와 비교하여 평가하였다. 또한 직선성, 정밀도, 그리고 최소검출농도는 해당하는 CLSI 가이드라인에 따라 평가하였다.
결과
회귀분석 결과 두 분석 방법 간에 높은 상관성을 보였다. HBV의 회귀식은 y=0.0684+1.025x (95% CI: 0.9604-1.092), HCV의 회귀식은 y=-0.9650+1.141x (95% CI: 1.071-1.226)이었다. 두 assay 간의 일치도는 HBV의 경우 82.30% (185/224) (κ: 0.738, 95% CI: 0.701-0.775), HCV의 경우 94.52% (69/73) (κ: 0.855, 95% CI: 0.796-0.914)였다. HBV 및 HCV의 최소검출농도는 각각 4.448 IU/mL 및 6.166 IU/mL이었다. 변이계수는 HBV에서 낮은 농도 및 높은 농도 모두 2% 미만으로 측정된 반면 HCV의 경우 낮은 농도 검체에서 3.20%로 측정되었다.
결론
Aptima HBV 및 HCV Quant assay는 Cobas 4800과 높은 상관관계를 보였으며, 민감하고 정밀한 검사 방법으로 사료되었다. 그러므로 Aptima assay는 HBV 및 HCV 환자의 관리에 실용적인 기여를 할 수 있을 것으로 기대된다.
Go to :

Keywords: Aptima, Cobas, Comparison, HBV, HCV, Linearity, Limit of detection, Precision
INTRODUCTION
Hepatitis B virus (HBV) and hepatitis C virus (HCV) infections remain a serious health problem despite the existence of an effective vaccine and antiviral drugs. The prevalence of HBV infection is 3.61% worldwide, and the infection rate is higher in the African (8.83%) and Western Pacific (5.26%) regions [
1]. The prevalence in South Korea was estimated to be about 3%, according to the Korea National Health and Nutrition Examination Survey (KNHANES) in the year 2016, indicating that our mode of transmission is shifting from perinatal transmission to horizontal transmission [
2]. To properly manage the infection, the Asian Pacific Association for the Study of the Liver (APASL) proposed a guideline stating that HBV DNA titer plays a crucial role in the staging and monitoring of the disease as well as in choosing a treatment strategy [
3].
HCV, unlike HBV, cannot be prevented by vaccination, and it has been only a few years since an effective treatment regimen was developed. The prevalence of HCV infection is 2.8% worldwide [
4] and 0.78% in Korea, increasing with age [
5]. The American Association for the Study of Liver Diseases (AASLD) and the Infectious Diseases Society of America (IDSA) presented a guideline on how to best manage HCV infection. According to this guideline, HCV RNA titer measurement is needed to make a diagnosis, monitor treatment efficacy, and test for reinfection [
6]. Thus, accurate measurement of HBV DNA and HCV RNA titers is crucial for the proper management of HBV and HCV infections.
Instruments measuring viral genetic material mostly use a real-time, quantitative polymerase chain reaction (PCR) method whereas the Aptima assay (Hologic Inc., San Diego, CA, USA) uses transcription-mediated amplification (TMA) [
7]. In addition, the platform that the Aptima assay utilizes, the Panther system, offers a fully-automated random access system, allowing prompter results and less hands-on time for clinical pathologists carrying out the task [
8].
In this paper, Aptima HBV and HCV assays’ linearity, limit of detection (LoD), precision, and correlation with Cobas 4800 (Roche Molecular Systems, Pleasanton, CA, USA) were evaluated to assess the analytical performance of these assays.
Go to :

MATERIALS AND METHODS
1. Clinical specimens
For the comparison study, residual plasma samples that had been tested with Cobas 4800 for either HBV or HCV genetic material were used; 224 HBV residual samples and 73 HCV residual samples were collected. They had been stored at -80°C for 9 months, at most.
2. Aptima HBV and HCV Quant assays
The viral genetic load was measured using Aptima HBV and HCV Quant assays. The Aptima HBV Quant assay uses real-time TMA technology to quantify HBV DNA. It targets two highly-conserved regions in the virus’s polymerase and surface genes to increase the assay’s tolerance for potential mutations. These targets are captured using capture oligonucleotides coupled to magnetic beads, which can be separated from the specimen in a magnetic field. Once the target is amplified, fluorescently-labeled probes (torches) are used for detection. The time taken for the fluorescent signal to reach a specified threshold is inversely proportional to the starting HBV concentration. The concentration of a sample is determined automatically by the Panther system software. The procedure for the HCV assay is almost identical to that of HBV. The Aptima HCV assay targets two highly-conserved regions at the relatively large 5’UTR of the HCV genome.
3. Precision, Linearity, and LoD
Precision was assessed using 3 different target concentrations or 3 control samples (negative, low positive, and high positive controls) that were included in each assay. Linearity was confirmed using 7 concentrations provided in the AcroMetrix HBV, HCV Panel 1.2 mL (Thermofisher Scientific) [
9]. Among these, the ones with the lowest HBV DNA and HCV RNA concentrations (50 IU/mL) were used for serial dilution to estimate the LoD. Five concentrations were made and measured 20 times each using the Aptima assay [
10].
4. Statistical analysis
For statistical analysis, Microsoft Excel 2013 (Microsoft, Seattle, WA, USA), Analyze-it for Microsoft Excel Method Evaluation Edition version 5.40.2 (Analyse-it Software, Ltd., City West Business Park, Leeds, UK), IBM SPSS Statistics v.23 (IBM Corp., North Castle, NY, USA), and Prism 8.0 (GraphPad Software, Inc., La Jolla, CA, USA) were used. Passing-Bablok regression, Bland-Altman analysis, and Cohen’s kappa coefficient were used to evaluate the correlation between Cobas 4800 and Aptima. Linearity was evaluated using linear fit regression. The LoD was determined using probit analysis.
Go to :

RESULTS
1. Correlation
1) HBV
Of the 224 samples collected, only 84 were quantified in both assays. The results were compared using Passing-Bablok regression and Bland-Altman analysis. Passing-Bablok regression analysis demonstrated a high correlation between the two data sets, with a regression line slope of 1.025 (95% CI: 0.9604-1.092) and a correlation coefficient
r of 0.979 (
Fig. 1). Average bias between them was -0.19 Log IU/mL (SD=0.34 IU/mL) (Cobas 4800–Aptima), with no specific trend as the HBV titer increased. Aptima quantified more than two standard deviations higher than Cobas 4800 for two samples, and more than three standard deviations higher for one sample (
Fig. 2). Categorical distribution of each sample is summarized in
Table 1. The lower limit of quantification (LLOQ) was 10 IU/mL for both Cobas 4800 and Aptima. Agreement between the assays’ qualitative results was 82.30% (185/224) (κ: 0.738, 95% CI: 0.701-0.775).
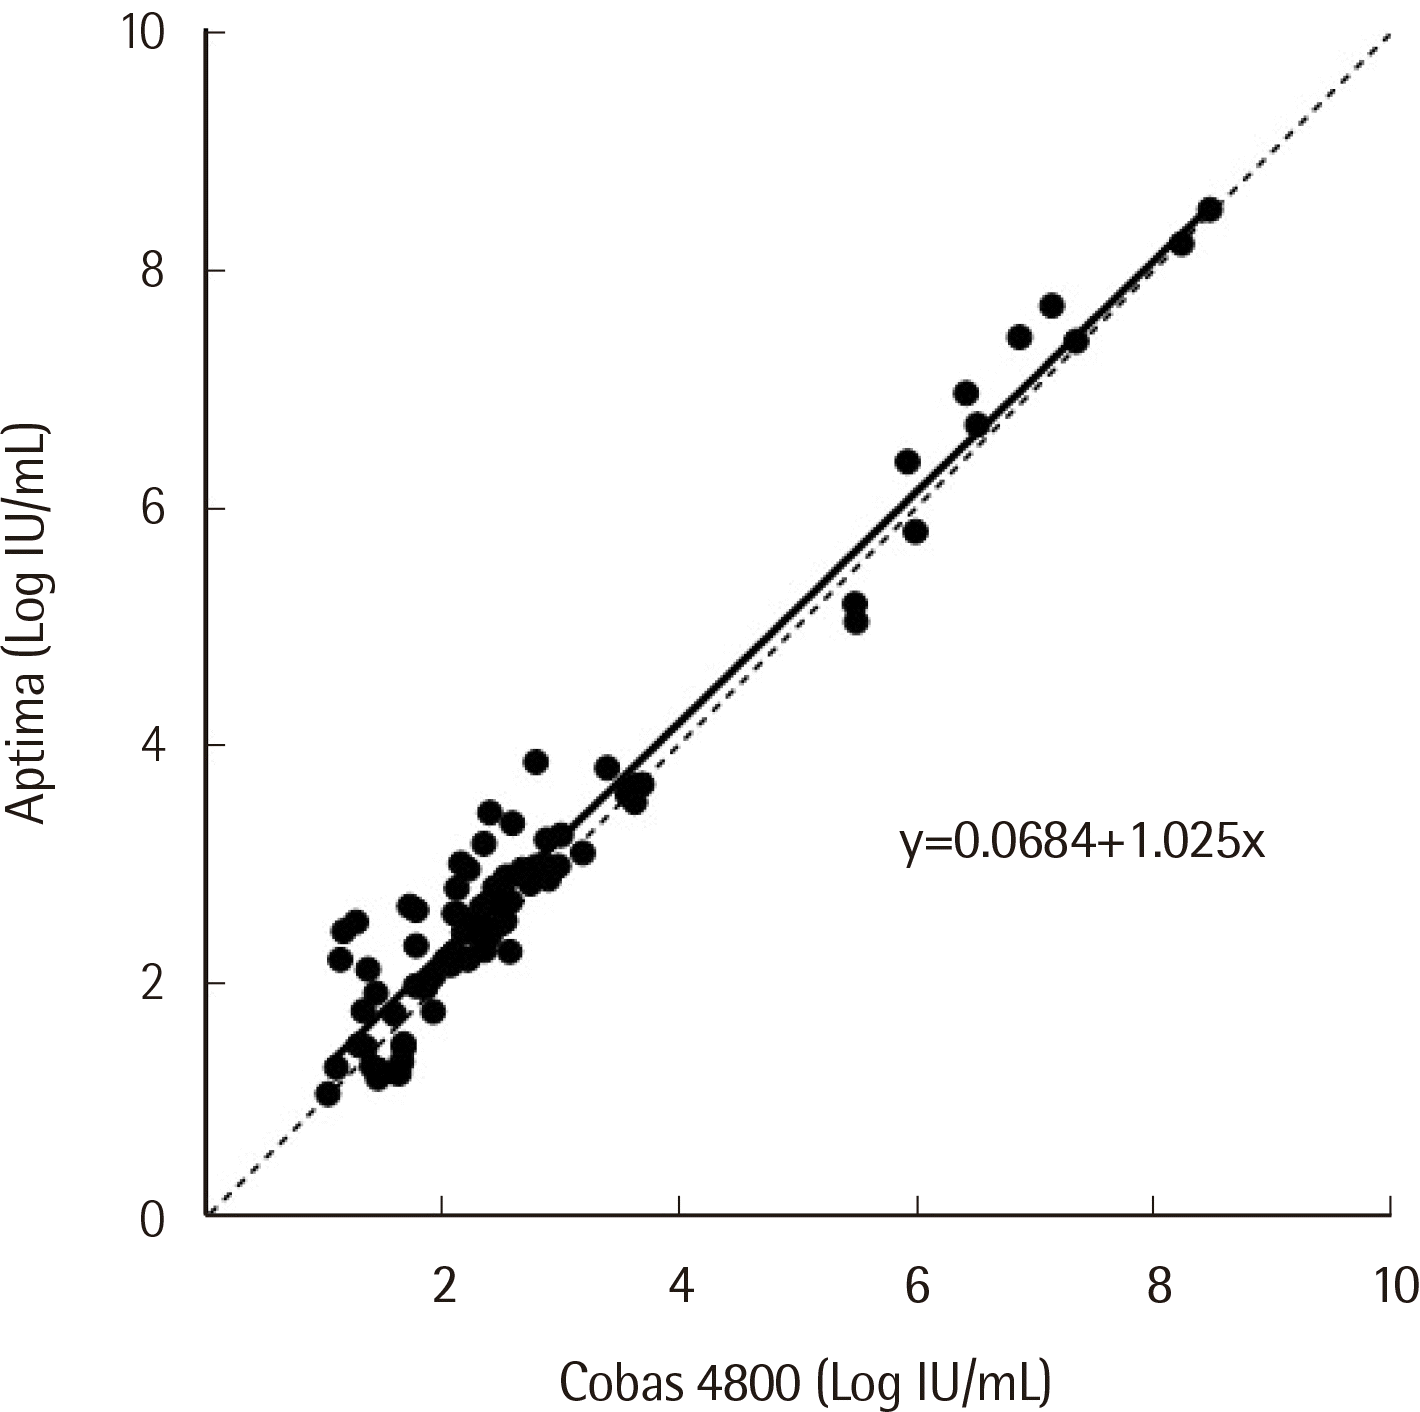 | Fig. 1Passing-Bablok regression on 84 HBV samples quantified within the linear measuring range of both the Cobas 4800 and Aptima assays. The equation of the regression line is shown in the figure. 
|
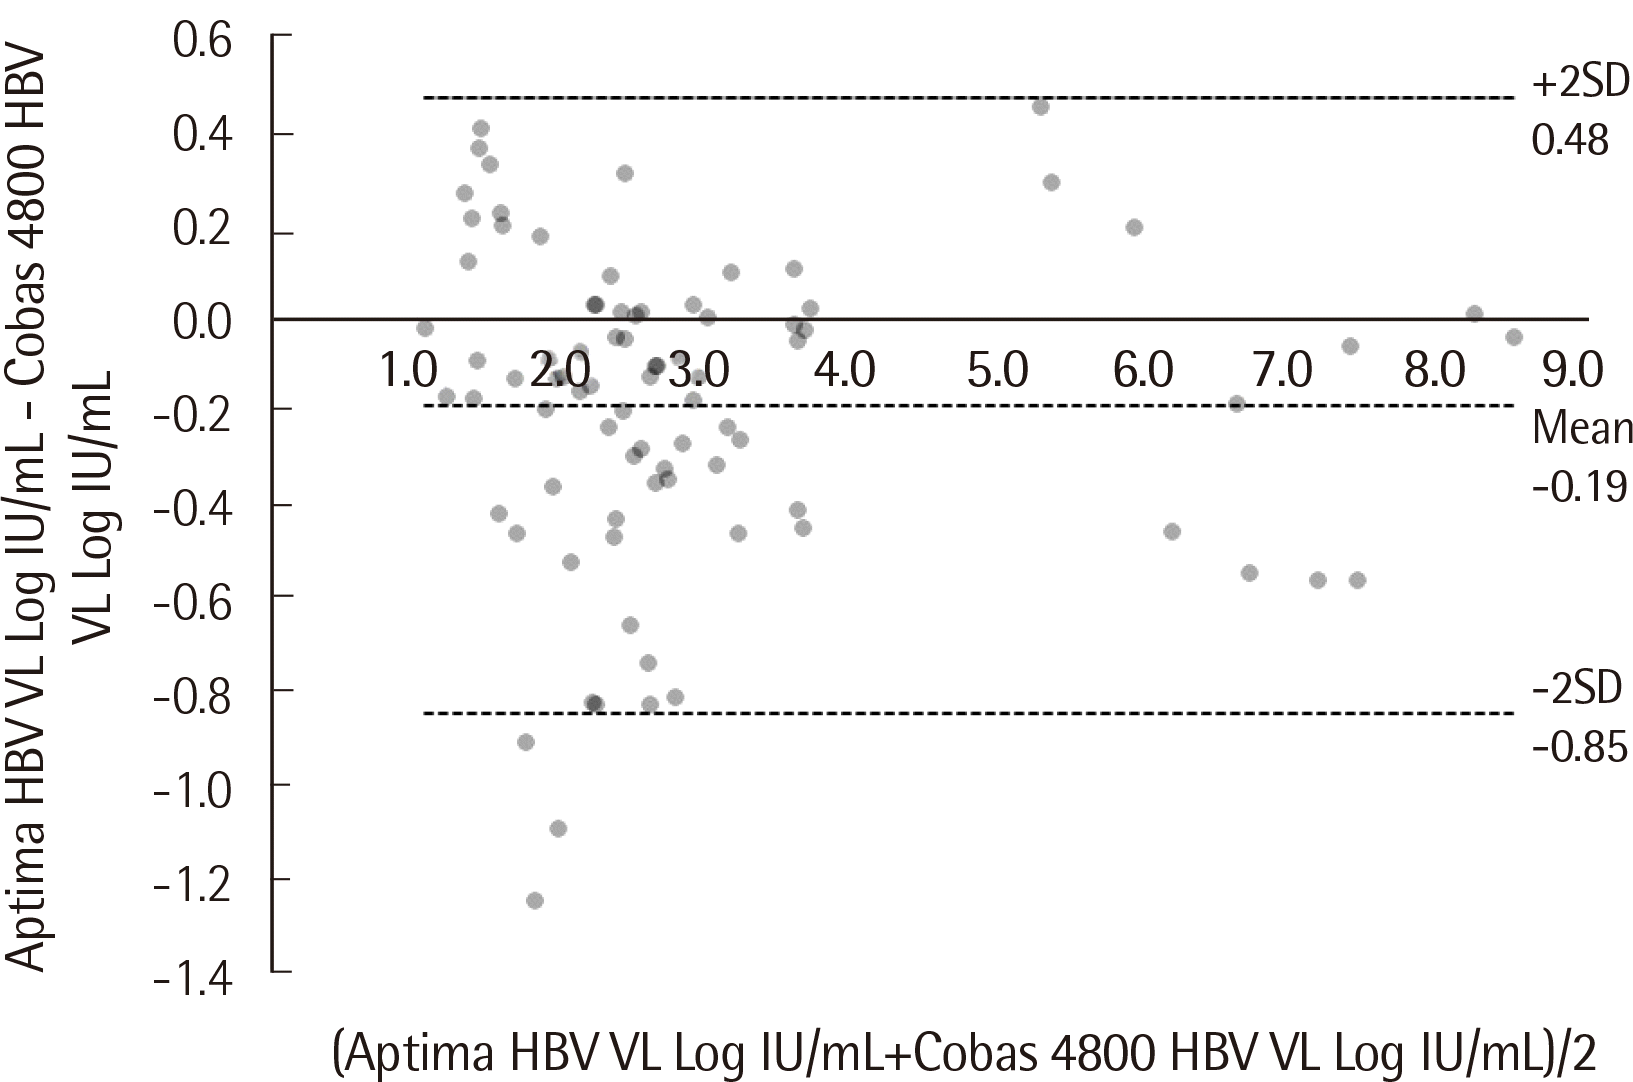 | Fig. 2Bland-Altman analysis of 84 HBV samples that quantified within the linear measuring range of both tests. The average bias (−0.19 Log IU/mL; SD=0.34 IU/mL) and the 95% confidence interval of the difference between the two tests are shown by dotted lines. 
|
Table 1
Classification of HBV and HCV samples according to results obtained by Cobas 4800 and Aptima
|
HBV |
|
Cobas 4800 |
|
|
Not detected |
Pos. < LLOQ |
Quantified |
|
Aptima |
Not detected |
59 |
6 |
- |
|
Pos. < LLOQ |
27 |
42 |
4 |
|
Quantified |
- |
2 |
84 |
|
|
HCV |
|
Cobas 4800 |
|
|
Not detected |
Pos. < LLOQ |
Quantified |
|
Aptima |
Not detected |
20 |
2 |
- |
|
Pos. < LLOQ |
- |
1 |
2 |
|
Quantified |
- |
- |
48 |

2) HCV
Of the 73 samples collected, only 48 were quantified in both assays. The results were compared using Passing-Bablok regression and Bland-Altman analysis. Passing-Bablok regression analysis demonstrated a regression line slope of 1.141 (95% CI: 1.071-1.226), with a correlation coefficient r of 0.944 (
Fig. 3). Average bias between them was 0.19 Log IU/mL (SD=0.40 IU/mL) (Cobas 4800–Aptima), with no specific trend as the HCV titer increased. For four samples, Aptima quantified more than two standard deviations lower than Cobas 4800 (
Fig. 4). Categorical distribution of each sample is summarized in
Table 1. The LLOQ was 15 IU/mL for Cobas 4800 and 10 IU/mL for Aptima. Agreement between the assays’ qualitative results was 94.52% (69/73) (κ: 0.855, 95% CI: 0.796-0.914).
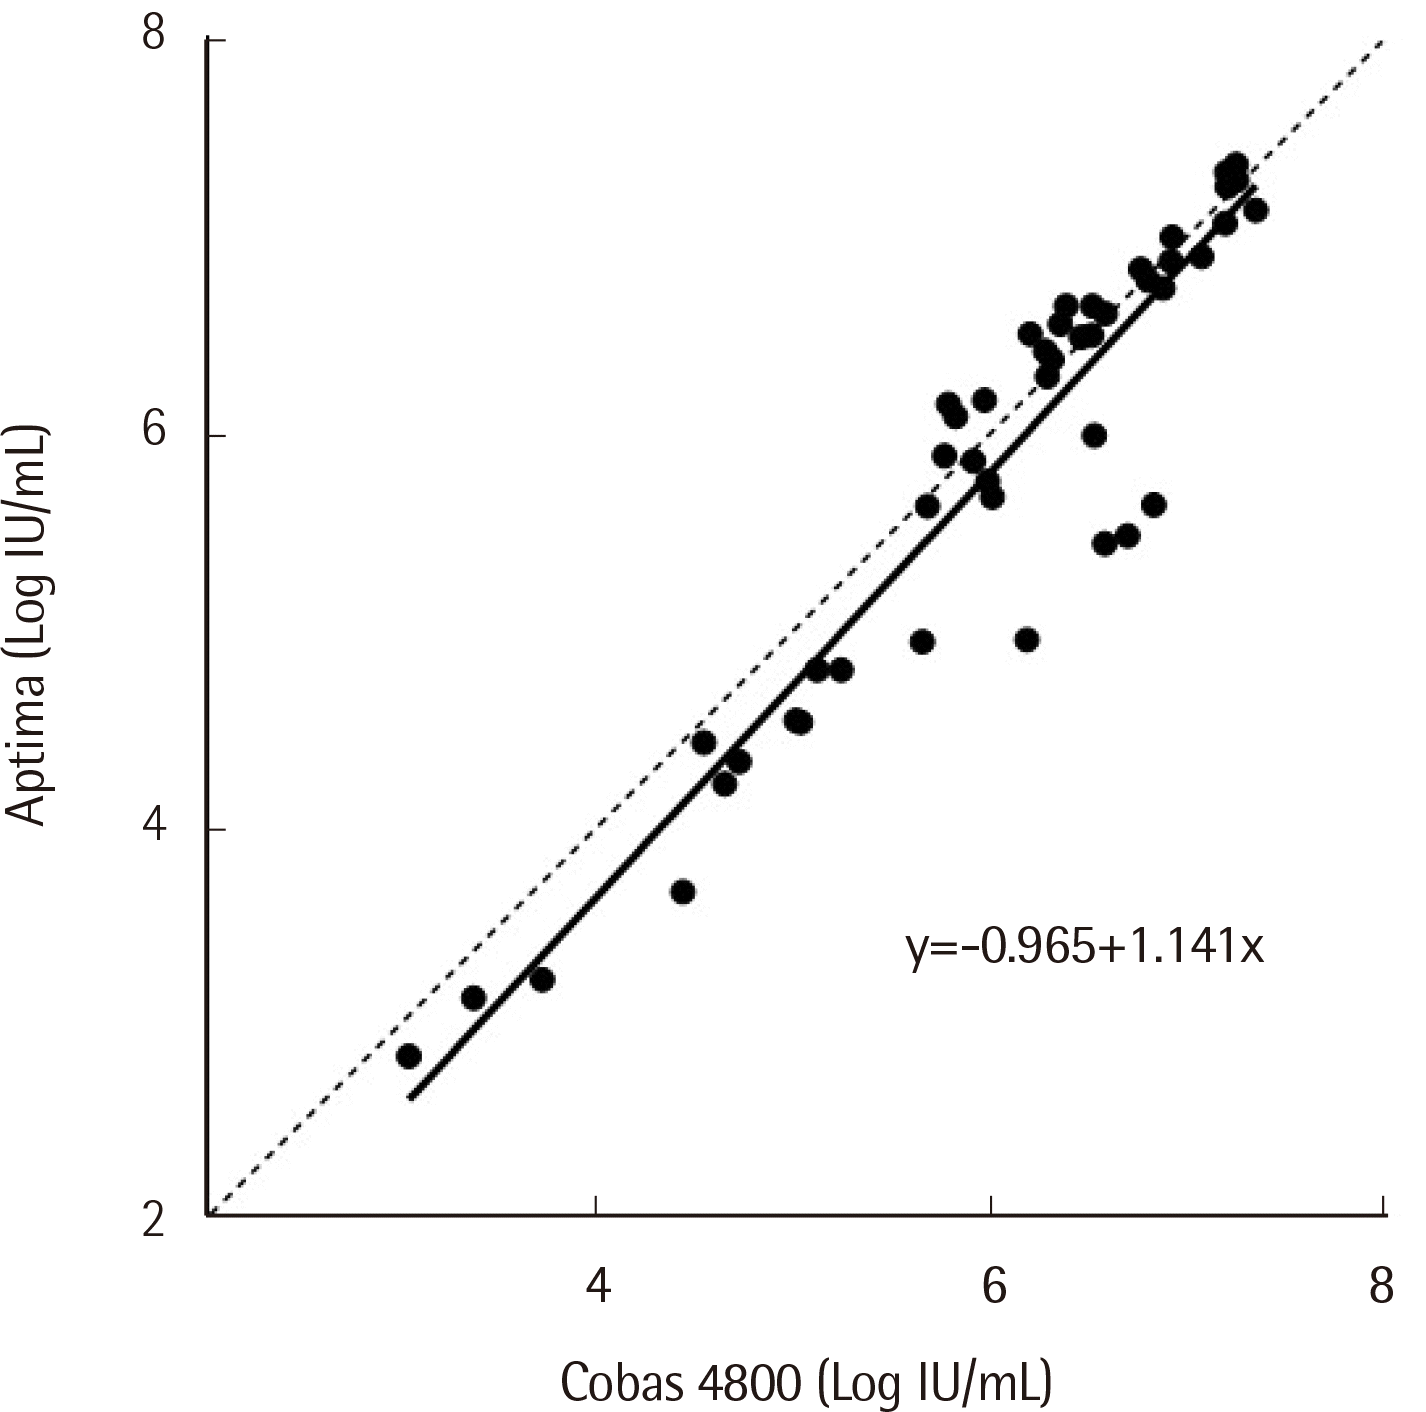 | Fig. 3Passing-Bablok regression on 48 HCV samples quantified within the linear measuring range of both the Cobas 4800 and Aptima assays. The equation of the regression line is shown in the figure. 
|
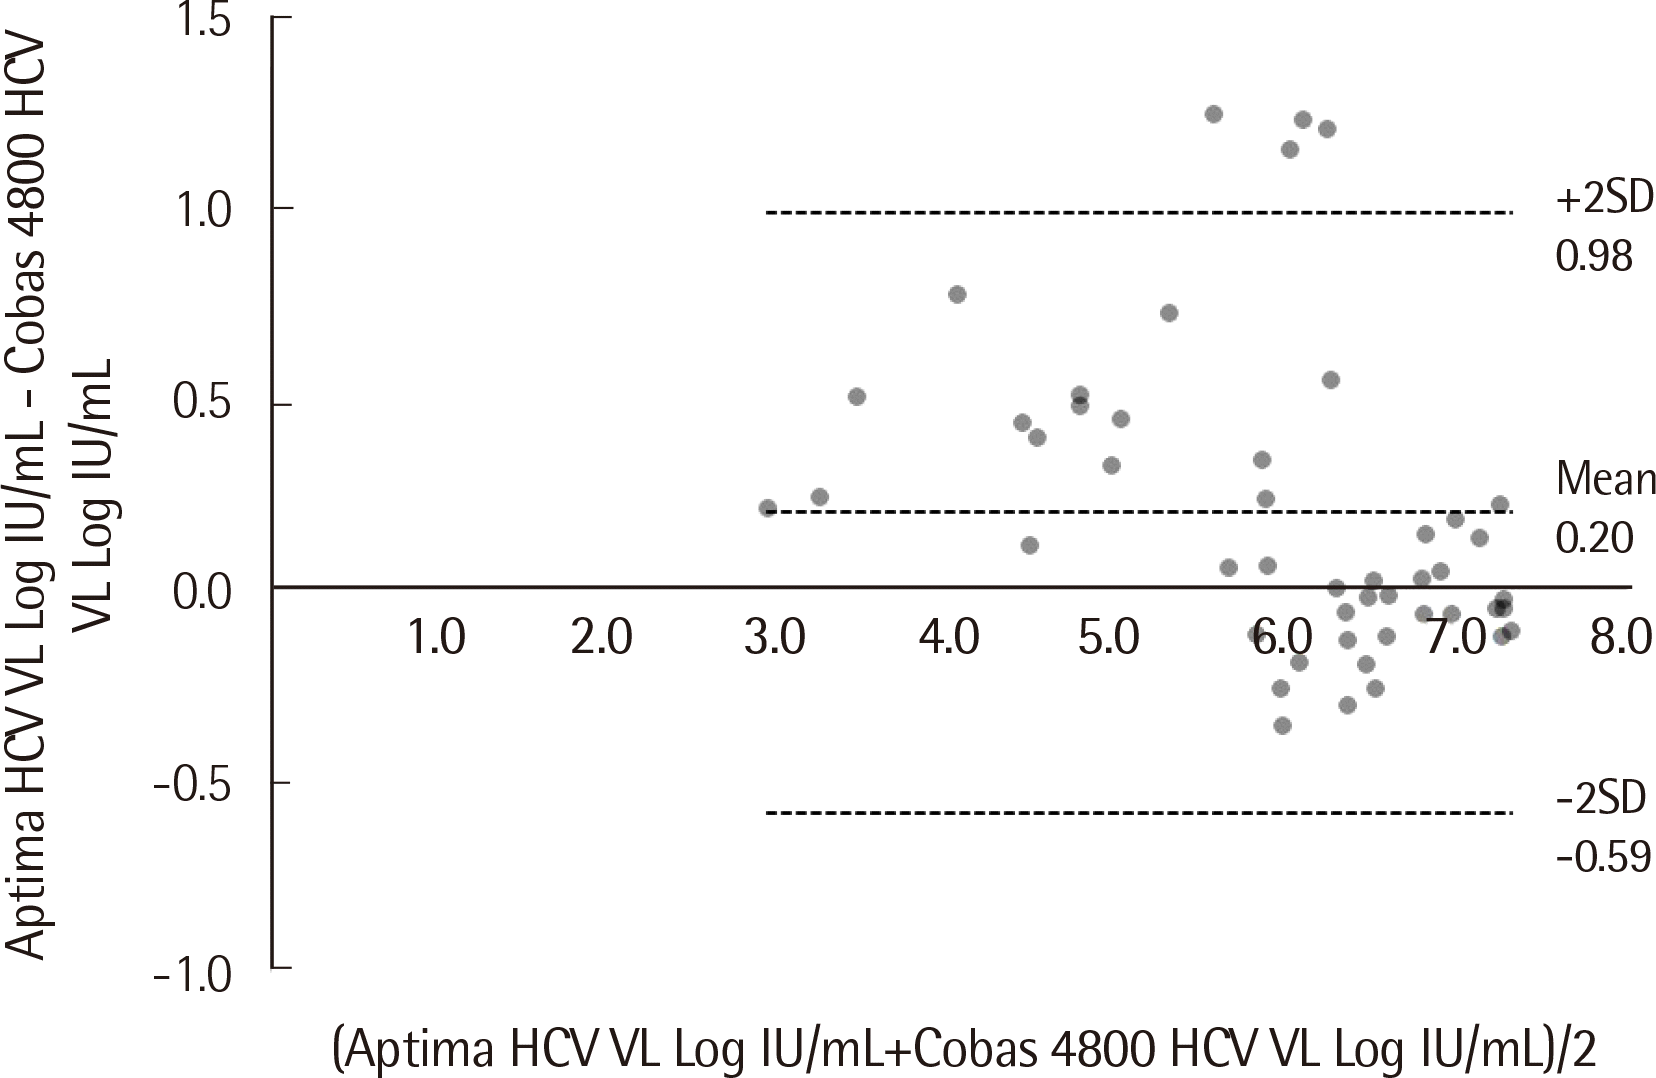 | Fig. 4Bland-Altman analysis of 48 HCV samples that quantified within the linear measuring range of both tests. The average bias (0.19 Log IU/mL; SD=0.40 IU/mL) and the 95% confidence interval of the difference between the two tests are shown by dotted lines. 
|
2. Linearity
To validate the linearity of both Aptima HBV and HCV assays, 2 replicates of 7 points from the AcroMetrix HBV, HCV Panel 1.2 mL were tested. The average value of the 2 replicates of the 7 points are plotted in Figs. 5 and 6. The determination coefficient values of the Aptima HBV and HCV assays were 0.9971 and 0.9935, respectively (
Figs. 5,
6).
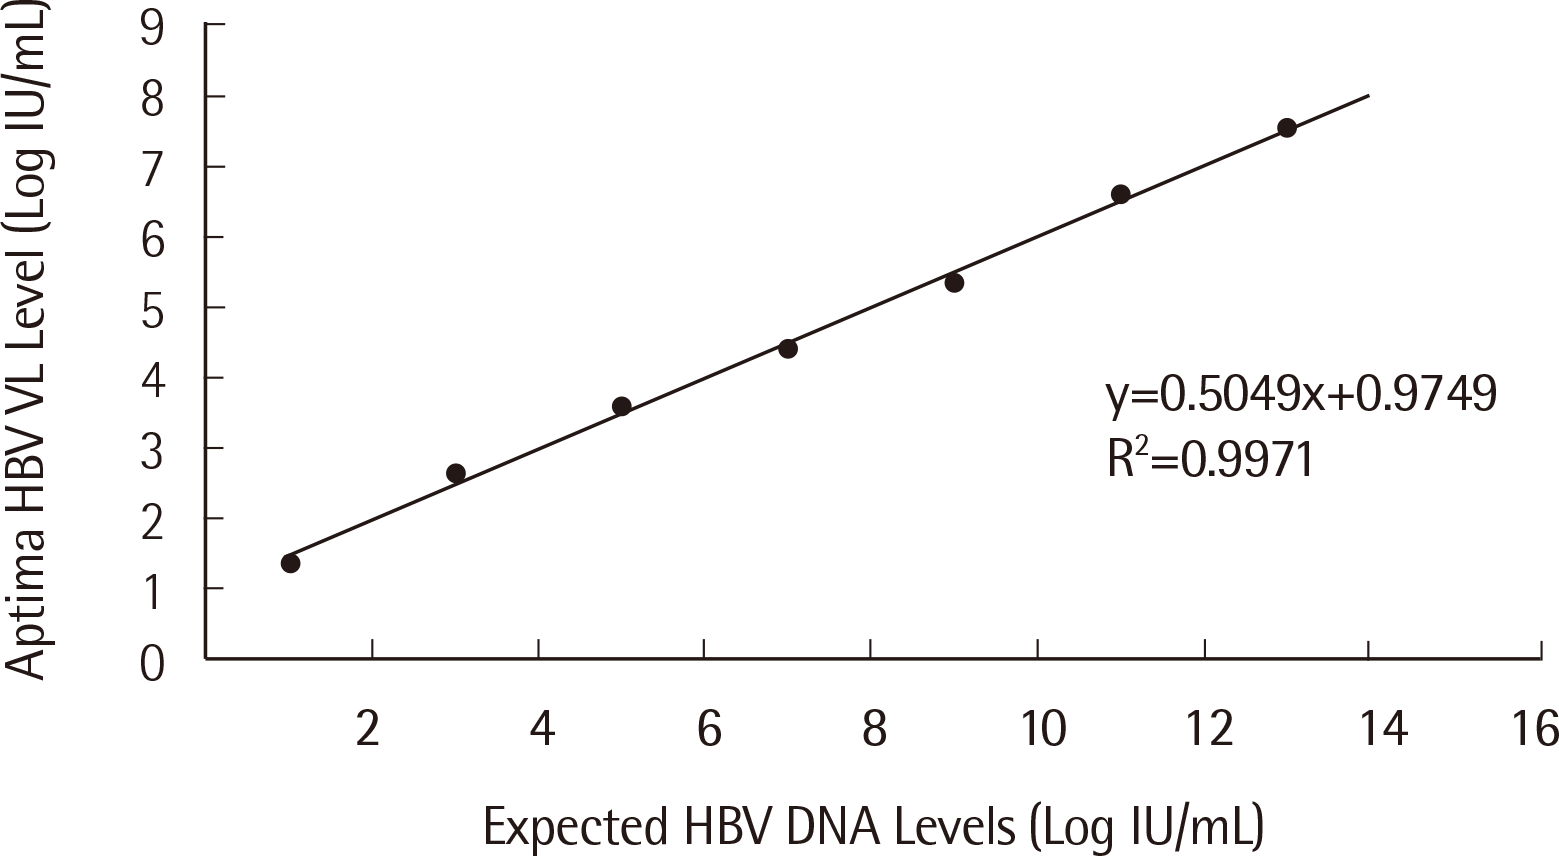 | Fig. 5Linearity of the Aptima HBV assay. 
|
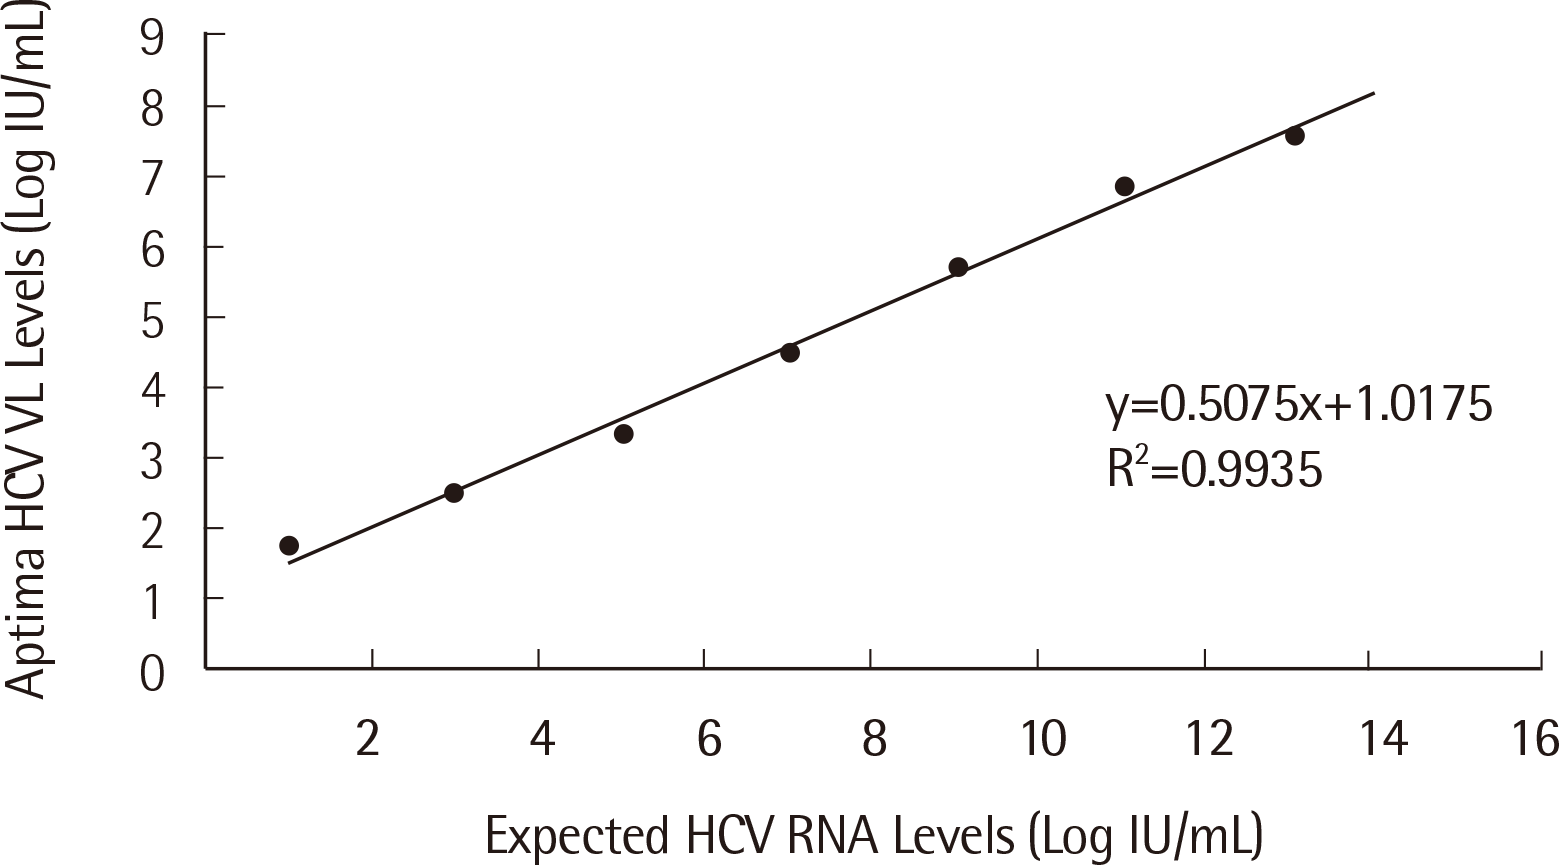 | Fig. 6Linearity of the Aptima HCV assay. 
|
3. LoD
To estimate the LoD, serial dilution using a sample from the AcroMetrix HBV Panel 1.2 mL and the AcroMetrix HCV Panel 1.2 mL was done. Five concentrations were made and measured 20 times each for both HBV and HCV. LoD values obtained by probit analysis were 4.448 (95% CI: 3.512-8.238) for HBV and 6.166 (95% CI: 4.711-11.38) for HCV.
4. Precision
To evaluate the precision of the Aptima HBV and HCV assay, the percent coefficient of variation (%CV) was calculated by measuring the concentration of 3 control samples (negative, low positive, and high positive controls) twice each day for 10 days.
1) HBV
Runs using negative control always resulted in no detection, so %CV could not be calculated. The %CV for low positive control (2.88 Log IU/mL; SD=0.05) was 1.66%, and for high positive control (4.52 Log IU/mL; SD=0.04), it was 0.95%.
2) HCV
Runs using negative control always resulted in no detection, so %CV could not be calculated. The %CV for low positive control (2.26 Log IU/mL; SD=0.07) was 3.20%, and for high positive control (5.44 Log IU/mL; SD=0.09), it was 1.69%.
Go to :

DISCUSSION
In this study, we evaluated the analytical performances of the Aptima HBV and HCV Quant assays by comparing them to those of Cobas 4800. A close correlation between the two assays was found; Bland-Altman analysis showed an average quantification bias (Cobas 4800–Aptima) of only -0.19 Log IU/mL for HBV and +0.19 Log IU/mL for HCV. This average difference is almost identical to what was presented in a prior study that compared the Aptima HBV assay with the COBAS Ampliprep/COBAS TaqMan HBV DNA Test v2.0 (Roche) [
11]. Their average difference (Aptima–CA PCTMv2) was -0.195 Log IU/mL [
11]. In another article comparing Aptima HCV assay with the COBAS Ampliprep/COBAS TaqMan HCV RNA Test v2.0, the average difference (Aptima–Abbott) was 0.11, which was similar to the average difference obtained in our study [
12]. According to the categorical distribution of each sample shown in
Table 1, 27 out of the 86 HBV samples that Cobas 4800 reported as “Not detected” were positive but below the LLOQ according to the Aptima assay. In contrast, only 6 of the 65 samples that Aptima reported as “Not detected” were reported as positive but below the LLOQ by Cobas 4800. The four samples that were below the LLOQ in the Aptima assay but quantified in Cobas 4800 had very low concentrations, ranging from 11.1 IU/mL to 25.4 IU/mL. The two samples that were below the LLOQ in the Cobas 4800 assay but quantified in Aptima had very low concentrations as well. Their exact numbers were 10.0 IU/mL and 12.6 IU/mL. The qualitative results of the two assays showed substantial agreement, with a Cohen’s coefficient κ of 0.738 for HBV and 0.855 for HCV. The Aptima HBV assay quantified more than two standard deviations higher than Cobas 4800 for two samples and more than three standard deviations higher for one sample (
Fig. 2). In the case of HCV, Aptima quantified more than two standard deviations lower than Cobas 4800 for four samples (
Fig. 4). Prior studies have demonstrated that such discrepancies were statistically related to a certain genotype of the virus, although its clinical significance was less clear [
11]. Genotyping of the discrepant samples in our study could not be done due to a lack of remnant samples.
The LoD values for HBV and HCV were 4.448 IU/mL and 6.166 IU/mL, respectively. In the case of HBV, the estimated value was in accordance with the LoD stated on the package insert paper [
12,
13]. In contrast, the LoD of the HCV assay differed from that stated on the package insert paper. It was 3.9 IU/mL for plasma [
14], which was even lower than the lower LoD range of 95% CI obtained in our study. However, when compared to the LoD of the Cobas 4800 HCV assay, which was 9.2 IU/mL (95% CI: 7.8-11.5 IU/mL), the LoD obtained in our study was lower, albeit with an overlapping 95% CI [
15].
The Aptima HBV and HCV assays were both found to be precise. The %CV of the HBV assay for low positive control was 1.66%, and for high positive control, it was 0.95%. While these were both less than 2%, the %CV of HCV for low positive control was 3.20%, and for high positive control, it was 1.69%. In spite of the fact that the %CV of HCV for low positive control exceeded 3%, this value was similar to what prior studies obtained at low concentrations with the Aptima HCV assay [
12], and it is better when compared to studies that used other HCV assays [
16].
Even though the analytical performance of the Aptima assays was evaluated as satisfactory, our study had some limitations. Regarding samples that showed a discrepancy between Cobas 4800 and Aptima assays, genotyping of the viruses could not be done due to a lack of remnant samples. In addition, the number of HCV samples was too few, and the samples were mostly high-titered. If we had collected more positive samples in the lower range, we might have gotten better results. As for the difference between the measured LoD and the LoD stated in the insert paper for HCV, if we had measured each concentration more, our estimation might have been closer to the stated LoD, and the 95% CI would have been narrower as well.
Despite these limitations, we found the results of the Aptima assay to be highly correlated to that of Cobas 4800. Moreover, according to the other parameters that we evaluated, Aptima was both sensitive and precise. Therefore, we conclude that the Aptima assay is a practical tool in the diagnosis and management of HBV- and HCV-infected patients.
Go to :


 PDF
PDF Citation
 Print
Print


 XML Download