

 PDF
PDF Citation
 Print
Print


INTRODUCTION
Late early childhood is a period when preschool children experience physical growth and emotional and cognitive development, and adequate nourishment and a balanced diet are critical during this stage. Preschool children also begin to form social relationships with others, which leads to development in their physical activities and capabilities. At this critical stage, children also develop their eating skills, form independent eating behaviors, and begin to have definite preferences towards food, thus forming their dietary habits. Since the dietary habits formed during this period not only affect the health, growth, and development of young children but could even affect the dietary habits and lifestyle-induced diseases as adults, it is pivotal for children to form healthy dietary habits at this stage [1234].
The imbalance in the nutrition and food intake of preschool children in Korea, as well as their unbalanced diet, habits of skipping meals, and the increase in their fast-food intake, have become a social issue as such unhealthy dietary habits have led to health conditions, including overweight, obesity, and cavities [567]. According to Korea National Health and Nutrition Examination Survey (KNHANES) VII-3 [5], the nutrient intake of 3.8% of the children from the ages of 3 to 5 was deficient, whereas the nutrient intake of 2.0% of the children was excessive. That is, approximately 6% of the children within the age group were either under- or over-nourished, both of which are conditions that could affect the children's physical development. The report also showed that the percentage of the children who skipped breakfast increased from 6.9% in 2017 to 8.1% and that 34.5% of children between the ages of 3 to 5 dined out more than once every day. By skipping breakfasts, having irregular meals or eating behaviors, children are at risk of hindering their growth and development and forming unhealthy dietary habits at a young age [67].
As eating behaviors affect the current nutrition and health of preschool children as well as the possibility of diseases, the eating behavior of preschool children should be analyzed through rigorous research and evaluation [8]. Assessment tools for comprehensive and straightforward analyses of early childhood dietary habits have been developed and used to analyze various factors, such as the nutritional and dietary factors and demographical characteristics of the subjects [291011121314].
In Korea, the nutrition quotient for preschoolers (NQ-P) has been developed for an assessment of the nutritional status and the quality of meals of preschool children [2]. NQ-P is an assessment tool that provides a comprehensive outlook of the children's quality of meals and dietary habits. NQ-P targets the parents or caregivers of children between the ages of 3 to 5 and consists of 3 dimensions—balance, moderation, and environment—and 14 items. While some researchers have applied the nutrition quotient (NQ), which was created for elementary school students in their fifth or sixth grades, in assessment studies on dietary behaviors of preschool children, research on the dietary habits of preschool children that used NQ-P for assessment has been lacking; the small number of studies that used NQ-P were limited to the Daejeon, Jecheon, and Gwangju areas [81516]. Studies that used NQ and NQ-P to assess the dietary behaviors of preschool children examined the difference by sex, region, weight, age, and body mass index (BMI) [7815]. Research conducted on 5-year-old children living in Seoul showed that the NQ of obese children was lower than that of children with normal weight [7] and that the NQ of breastfed children was significantly higher than that of bottle-fed children [10].
A comparative study on the dietary behaviors of infants and preschool children in Ganghwa-gun showed that the NQ of infants was significantly higher than that of preschool children [13]. The NQ scores of infants living in the Gyeongsan area proved to be at nutritional risk, all except the moderation dimension [4]. In the case of preschool children living in Dongducheon, obese children had low scores in the balance among the NQ dimensions in terms of obesity [14]. Among the studies that used NQ-P, one study on the dietary behaviors of preschool children in Jecheon showed that the total NQ-P score of the region was lower than the total national NQ-P score of 60.6. While there was no score difference by sex or age, a significant difference by age was found in the balance and moderation dimensions [15]. The dietary behaviors score of preschool children in Daejeon was at a mid- to low-level at 58.5, and no significant difference by sex or age was found [8]. In the case of Gwangju, the total NQ-P score was 59.9, and the score of children between the ages of 1 to 2 was higher than that of 3 to 5-year-old children [16].
A thorough examination of the current dietary habits and the affecting factors is needed to instill healthy dietary habits in preschool children. The eating behaviors of preschool children are determined by individual and internal factors and environmental factors [17], and studies have suggested that dietary behaviors, dietary attitudes, food intake, nutritional knowledge, educational level, feeding styles, and the socioeconomic level of the parents were also associated with the dietary habits of their children [12141819202122232425262728293031]. It is likely that the food that the primary caregiver who plans the meals dislikes would be excluded from meals, and as children are less exposed to such food, they tend to form their dietary preferences and dietary habits with their primary caregivers as their mealtime role models. Research has proved that dietary behaviors, food choices, and the perception of nutrition facts differed by one's health consciousness [3233343536]. To examine the affecting factors of the dietary behaviors of children, external characteristics such as parental dietary attitudes as well as their beliefs and level of thinking skills that form the basis of their behavior and their health consciousness should also be considered [37].
This study, therefore, used NQ-P and the data published at the time of the survey [38] to analyze the quality of meals, dietary habits, and the food intake patterns of 3 to 5-year-old preschool children residing in Seoul (222,785 children, 16.29%) and Gyeonggi-do (384,861 children, 27.52%), which are the 2 top regions with the largest number of children within the age range. This study also examined whether NQ-P differed by sex, age, region, and weight status. In addition, this study analyzed the difference in the dietary scores of the children by their parents' health consciousness to provide meaningful basic data for the future development of policies and nutrition programs for improving the dietary behaviors of preschool children.
Go to : 
SUBJECTS AND METHODS
Study subjects
A pre-tested conducted to correct survey questionnaire towards 7 participants, at June, 2018. After that, an online survey was conducted for 2 months, from August to September 2018, on parents who lived in Seoul or Gyeonggi-do and raised preschool children aged 3 to 5 years old using panel of the online survey company. The respondents were asked to answer questions about the dietary behaviors of their children aged 3 to 5 years old, and if they had 2 or more children aged 3 to 5, they were asked to respond about the oldest child. Quota sampling was used to sample the children by place of residence and sex. 257 final responses were collected, and 253 were used for analysis. The respondents participated in the survey after reviewing and agreeing to the objectives and methods of the survey. Throughout the research, subjects were explained their right to choose not to participate and/or to withdraw from the study at any point, without any consequences. This study was approved by the Institutional Review Board (IRB) of Hanyang Women's University, Seoul, Korea (IRB: AN01-201801-HR-001-01).
Measurements
The survey variables and measurements were selected from those suggested in previous studies. The questionnaire comprised general questions of parents and children, NQ-P of children, and health consciousness of parents and fill out by parents. The general characteristics consisted of the respondent's place of residence, sex, age, education level, family type, monthly income, frequency of dining out, and the main meal planner. The general characteristics of the preschool children included their age, sex, weight, and height [7815]. BMI (weight [kg]/height [m2]) has been categorized into 4 groups based on growth carts for Korean young children and adolescents (body weight < 5th percentiles), normal weight (5th ≤ BMI < 85th percentiles), overweight (85th ≤ BMI < 95th percentiles), and obese (BMI ≥ 95th percentiles) [39].
The NQ-P was used to measure diet quality and eating behaviors [2]. After conducting a literature review, this study set 3 dimensions and 14 items for the NQ-P. Five items in the “balance” dimension measured the number of vegetable side dishes eaten in one meal and the frequency of eating white milk, beans and bean products, meat, and fish. As to the “moderation” dimension, this study prepared 4 items on the frequency of eating processed meat, fast-food, sweet or greasy baked goods, and processed beverages. Five items in the “environment” dimension asked how frequently the child had breakfast, whether the child does not move around while eating, how much effort that the child have healthy eating habits, whether the child washed their hands before meals, and how much time the child spent watching TV, smart phone, and/or PC screens [28].
We referred to previous studies for assessing the degree of parents' health consciousness [354041] and moderated terms and context after conducting pre-test. It encompasses 4 questions that ‘I am very conscious about my family's health condition’, ‘I always think of health of my family’, ‘I am usually aware of health of my family’, and ‘I talk about health with my family’ with 5-point Likert scale (1: strongly disagree–5: strongly agree). The Cronbach's alpha was 0.835, and factor analysis to test the items' validity showed the result that one factor was extracted with the explained variance of 59.29%.
Statistical analysis
Statistical analysis was performed by using a software program (IBM SPSS Statistics for Windows, version 25.0, released 2017; IBM Corp., Armonk, NY, USA). The collected data are described in terms of frequency, percentage (%), mean ± SD. Descriptive analysis was conducted to identify the general characteristics of the respondents, and a Pearson's χ2 test was conducted to examine the difference in NQ-P items in regards to the children's individual characteristics, including their sex, age, and weight status. Fisher's exact test was conducted when the number of cells which expected frequencies were below 5 is over 25% for the χ2 test.
Reliability analysis was conducted, using Cronbach's alpha analysis to check the consistency of the scales. Factor analysis was also conducted to check the validity. The factor was extracted through the principal component analysis and the varimax rotation.
This study used the weighted scores of the dimensions and the items to calculate the means ± SDs of the total NQ-P scores and the 3 dimensions' scores [2]. The score of each item was multiplied by the item weight in the NQ-P and then was summated. The scores for each dimension were summed by applying the item weight in each dimension to the scores of each item. Subsequently, each score was classified into 4 levels based on the percentile distribution of the total NQ-P scores and the scores in each dimension. Pearson's χ2 test, t-test, 1-way analysis of variance, and Tukey's multiple comparison test were conducted to test the differences according to the sex, age, region, and weight status of the children. This study then conducted non-hierarchical cluster analyses (k-mean cluster analyses) to classify the respondents into 3 groups (low, medium, and high) based on the means of their health consciousness, and compared the difference between the total NQ-P scores and the scores in each dimension. Statistical significance is set at P < 0.05.
Go to :
RESULTS
Demographic characteristics of subjects
Table 1 shows the demographic characteristics of the 253 subjects. The 126 subjects resided in Seoul and 127 subjects reside in Gyeonggi-do.
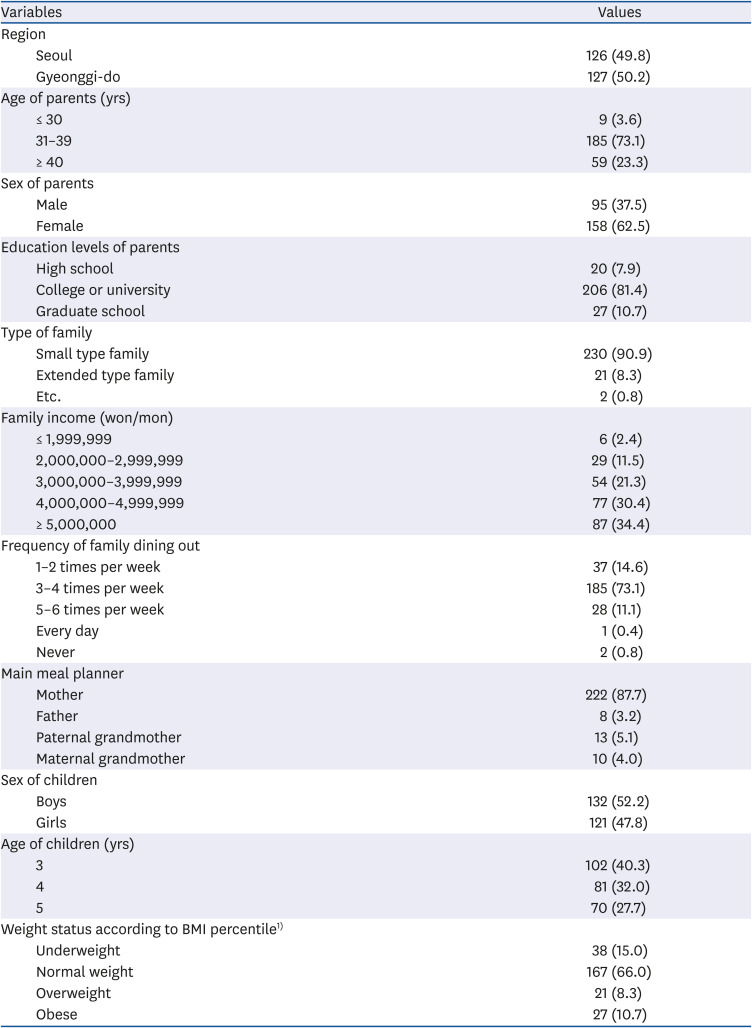
Table 1
General characteristics of participants
Values are presented as number (%).
BMI, body mass index.
1)Weight status for children was categorized into 4 groups according to sex- and age-specific BMI percentile from the 2017 Korean national growth chart: underweight (body weight < 5th percentiles), normal weight (5th ≤ BMI < 85th percentiles), overweight (85th ≤ BMI < 95th percentiles), and obese (BMI ≥ 95th percentiles).
![]()
The majority of the respondents were 30's (73.1%) and women (62.5%). With regard to education levels of parents, 81.4% (n = 206) were college or university, 10.7% (n = 27) were graduate school, and 7.9% (n = 20) were high school. In terms of family type, 90.9% (n = 230) were small type family and 8.3% (n = 21) were extended type family. Around one-third of participants had a family income more than 5,000,000 won (34.4%). With regard to frequency of dining out, almost 3 quarters dined out 3–4 times per week (73.1%). The majority participants responded that main meal planner was mother (87.7%).
There were 132 (52.2%) boys and 121 girls (47.8%) who were included in our study. Obese and obesity of children was defined by the BMI percentile and was categorized as follows: normal weight (n = 167, 66.0%), underweight (n = 38, 15.0%), overweight (n = 21, 8.3%), and obese (n = 27, 10.7%).
Comparison of checklist items for balance dimension
Table 2 shows comparison of checklist items for balance dimension by sex, age, region, and weight status. The number of respondents who replied that they consumed 2 vegetable side dishes at meals was the highest at 44.3%, while 24.5% responded that they consumed one vegetable side dish or less at meals. In the case of white milk, 44.7% replied that they drank white milk once or twice a day, and 5.5% drank white milk 3 times a day, thereby showing that 54.9%, that is, over half of the children drink milk at least once every day. On the other hand, 41.9% of the children drank milk less than 3 or 4 times every week, and 3.2% of the children did not drink milk at all, showing that 45.1% of the subjects did not drink milk even once every day. Beans and bean products were most frequently eaten once a week with 40.3% responses, while 31.6% of the respondents replied that they ate beans and bean products 3 to 4 times a week, and 2.4% replied that they did not eat beans and bean products at all. For meat, the highest percentage of 54.5% replied that they ate meat 3 to 4 times each week; 20.6% ate meat once a week, and there were no cases of households that did not eat meat. Considering the intake frequency of fish, 43.5% intake once per week, 22.9% intake once per every 2 weeks. Approximately 70% of children intake fish less than once per week. There were no significant differences in balance factor between the sex, age, region, and weight status.
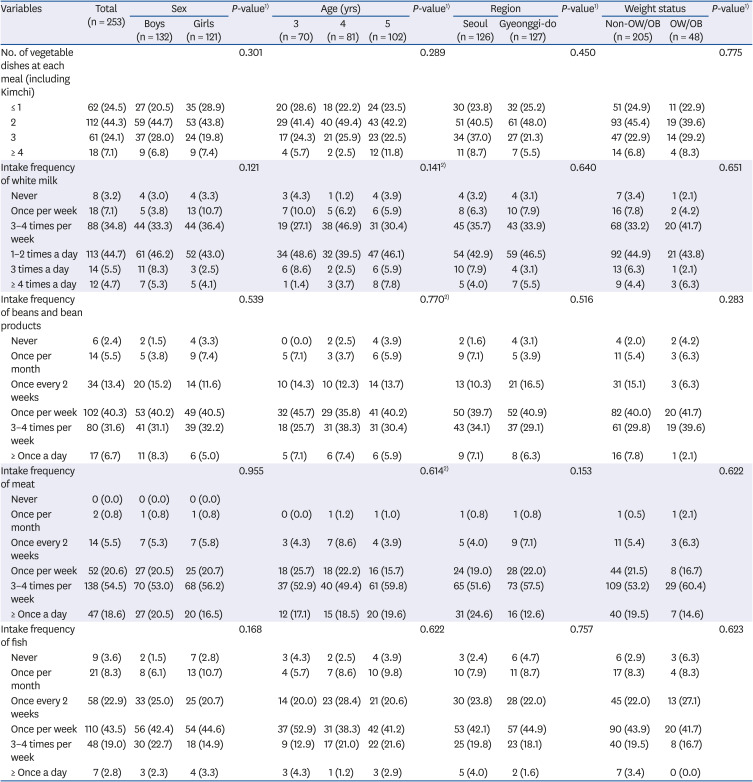
Table 2
Comparison of checklist items for balance dimension by sex, age, region, and weight status
Values are presented as number (%).
OW/OB, overweight/obese.
1)P-values were derived from χ2 test.
2)P-values were derived from Fisher's exact test.
![]()
Comparison of checklist items for moderation dimension
Table 3 shows comparison of checklist items for moderation dimension by sex, age, region, and weight status. In the case of ham and sausages, 38.3% replied that they ate them once a week, and 29.2% ate them 3 to 4 times a week, which showed that over 50% of the respondents ate processed meat once or more times every week. 41.1% of the children were eating pizza and hamburgers once a month, while 29.6% were eating them once every 2 weeks. Responses on the intake frequency of sweet food such as snacks and candies showed that 43.1% of the children ate sweets 3 to 4 times every week while 29.2% ate sweets once a month. The survey also showed that 27.7% of the children drank processed beverages 3 to 4 times each week, and 27.3% drank them once a week. There was a significant difference (P < 0.05) in the intake frequency of processed meat such as ham and sausages by region, and a significant difference (P < 0.05) was also detected in the intake frequency of pizza and hamburgers by age, region, and weight status.
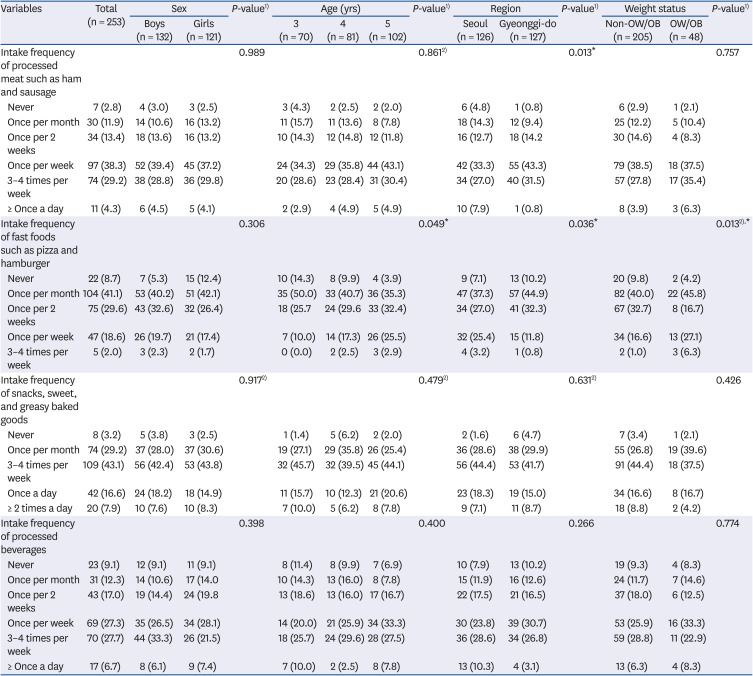
Table 3
Comparison of checklist items for moderation dimension by sex, age, region, and weight status
Values are presented as number (%).
OW/OB, overweight/obese.
1)P-values were derived from χ2 test.
2)P-values were derived from Fisher's exact test.
*P < 0.05.
![]()
Comparison of checklist items for environment dimension
The comparison of checklist items for environment dimension by sex, age, region, and weight status were as shown in Table 4. For the intake frequency of breakfasts, 58.5% replied that they had breakfast every day, 14.6% replied that they had breakfasts 3 to 4 times every week, 6.3% ate breakfasts one or 2 times weekly, and 4.3% did not have breakfasts at all, thereby showing that over 40% of the children did not have breakfasts every day. On the question asking whether their child eats their meal seated without moving around, 34.4% replied that their children eat their meals seated at times, 32.0% replied that they eat their meals seated and 14.2% replied that they always eat their meals seated. The analysis also showed that there was a significant difference between the overweight/obese group and the non-overweight/obese group (P < 0.05). The survey also indicated that the majority of the respondents, at 58.1%, replied that they are putting effort into a healthy diet. 24.5% were neutral, and there were no respondents who replied that they are putting no effort. There was a significant difference in the parents' efforts for a healthier diet by sex (P < 0.05). In regards to washing their hands before meals, 46.6% replied that their children did wash their hands before meals, 22.9% were neutral, and 20.6% replied that their children always washed their hands. On the screen time of TV, smartphones, and computers 34.4% replied that they used them for 2 hours, 32.4% for one hour, and 17.4% replied that they used them for 30 minutes, indicating that 80% of the children used such electronic devices for 2 hours or less.
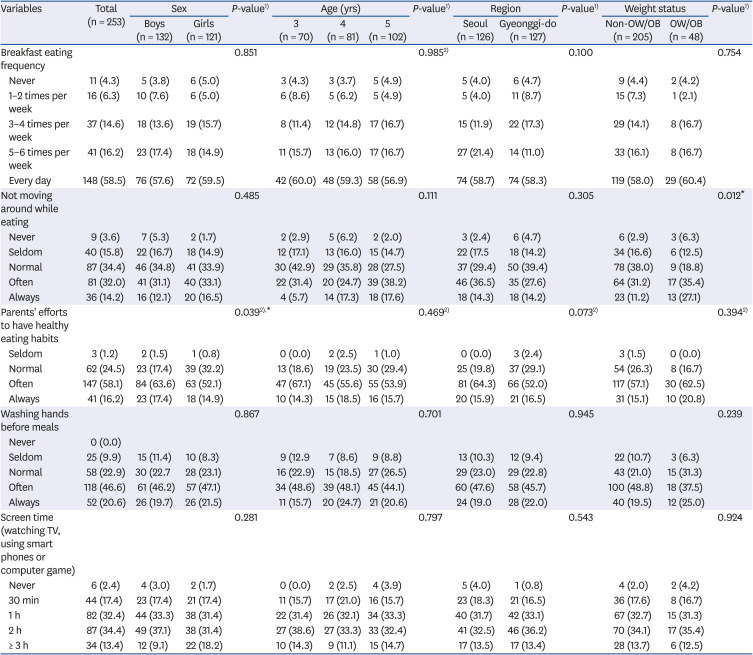
Table 4
Comparison of checklist items for environment factor by sex, age, region, and weight status
Values are presented as number (%).
OW/OB, overweight/obese.
1)P-values were derived from χ2 test.
2)P-values were derived from Fisher's exact test.
*P < 0.05.
![]()
NQ-P grade
The NQ-P grade by sex, age, region, and weight status in regards to each dimension was as presented in Table 5. In terms of the NQ-P total score, 27.0% of the subjects of this study were placed at the low level, 21.8% at the mid-low level, 28.5% at the mid-high level, and 23.0% at the high level with an overall average of 59.47. In the balance dimension, 28.1% were at the low level, 17.8% at the mid-low level, 20.9% at the mid-high level, and 33.2% were placed at the high level with an average score of 61.62. In the balance dimension, the score of boys was 63.21, whereas the girls scored 59.88, thereby displaying a significantly higher score among boys (P < 0.05). In the moderation dimension, 28.1% were at the low level, 24.5% at the mid-low level, 23.7% at the mid-high level, and 23.7% at the high level with an average of 48.41. There was a significant difference by age (P < 0.05). The scores in the moderation dimension were 50.88 for the 3-year-old children, 50.82 for the 4-year-old children, and 44.79 for the 5-year-old. In the environment dimension, 28.5% were at the low level, 25.7% at the mid-low level, 28.9% at the mid-high level, and 17.0% at the high level with an overall average of 68.91. This study also presented the overall average score of each item on health consciousness. The average score to the item that ‘I am usually aware of health of my family’ was 4.07, ‘I always think of health of my family’ was 3.96, ‘I am very conscious about my family's health condition’ was 3.91, and ‘I talk about health with my family’ was 3.64. The overall average score of the respondents' health consciousness was 3.89, and no significant difference by sex, age, region, and weight status was found.
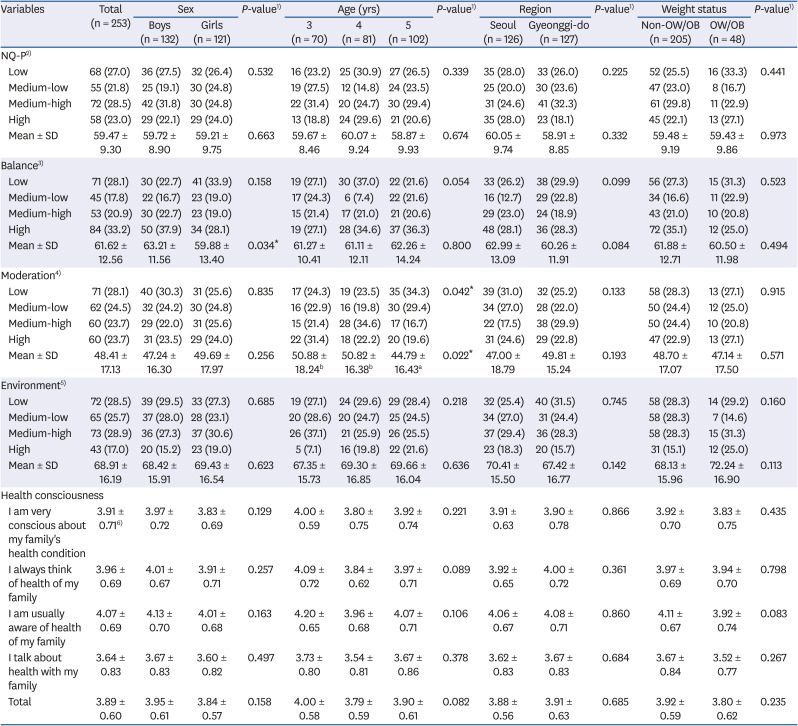
Table 5
NQ-P and parents' health consciousness by sex, age, region, and weight status
Values are presented as number (%). NQ-P, nutrition quotient for preschoolers; OW/OB, overweight/obese.
1)P-values were derived from χ2 test for categorical variables or t-test and 1-way analysis of variance test for continuous variables to test differences in baseline characteristics
2)Low: 0–53.7, medium-low: 53.8–60.7, medium-high: 60.8–66.3, high: 66.4–100.
3)Low: 0–55.0, medium-low: 55.1–61.8, medium-high: 61.9–67.6, high: 67.7–100.
4)Low: 0–38.2, medium-low: 38.3–49.4, medium-high: 49.5–61.0, high: 61.1–100.
5)Low: 0–61.4, medium-low: 61.5–73.8, medium-high: 73.9–83.3, high: 83.4–100.
6)Mean ± SD, 5-point Likert scale (1: strongly disagree–5: strongly agree).
a,bMultiple comparisons are given by post hoc Tukey's test.
*P < 0.05.
![]()
NQ-P scores of children according to the level of parents' health consciousness
K-means clustering was conducted on the 4 items that measured the parents' health consciousness, and the parents were classified into 3 groups—highly health-conscious, middle, and low. The analysis showed that the average score of the high health-consciousness group was 4.73, the middle group 3.91, and the low health-consciousness group scored 3.01. Results of comparing the total NQ-P score and the scores by each dimension by their levels of health consciousness were shown in Table 6. Significance differences were found in each group in the total NQ-P score, and the balance and environment dimensions. In regards to the total NQ-P scores, the highly health-conscious group's score was 61.97, the middle group scored 59.35, and the low group scored 57.34, the results thereby showing a significantly higher total NQ-P score in the highly health-conscious group (P < 0.05). In the balance dimension, the score of the highly health-conscious group was 65.66, the middle group scored 61.74, and the low group scored 57.22, thereby showing that the highly-health conscious group had a significantly higher score in the balance dimension (P < 0.01). In the moderation dimension, the group with low health consciousness scored 50.62, the middle group scored 48.21, and the highly health-conscious group scored 46.76, but no significant difference was found. In the environment dimension, the highly health-consciousness group scored 73.54, the middle group scored 68.42, and the low-level group scored 65.65, which showed that the highly health-conscious group had a significantly higher score in the environment dimension (P < 0.05).
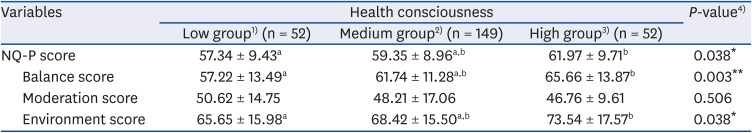
Table 6
NQ-P scores of children according to the level of parents' health consciousness
Values are presented as mean ± SD.
NQ-P, nutrition quotient for preschoolers.
1)Low group: 2.50–3.25 (mean ± SD: 3.01 ± 0.21).
2)Medium group: 3.50–4.25 (mean ± SD: 3.91 ± 0.23).
3)High group: 4.50–5.00 (mean ± SD: 4.73 ± 0.21).
4)P-values were derived from analysis of variance test.
a,bMultiple comparisons are given by post hoc Tukey's test.
*P < 0.05, **P < 0.01.
![]()
Go to :
DISCUSSION
The dietary environments of preschool children are rapidly changing in recent days, and health issues, including nutritional imbalance caused by fast-food and carbonated drinks, childhood obesity, and diabetes, are on the rise [67]. This study thus used NQ-P to assess the dietary behaviors of preschool children living in Seoul and the Gyeonggi-do area. First, this study identified that 15.0% of the subjects were underweight, 10.7% obese, and that 8.3% were overweight. Considering that 3.8% of the children from the years 3 to 5 in KNHANES VII-3 [5] were found to display signs of insufficient nutrient intake and that 2.0% had signs of excessive nutrient intake, this study found higher numbers of preschool children who were obese, overweight, or underweight.
Analysis using NQ-P to compare the difference in dietary behaviors by sex, age, region, and weight status displayed no statistical significance in the balance dimension. The consumption of white milk, beans and bean products, meat, and fish is a key indicator to measure the intake of food and essential nutrients during childhood. In regards to the consumption of white milk, 54.9% of the children drank white milk at least once a day, while 45.1% did not drink white milk every day. Considering that 79.3% of the preschool children in the Gyeongsan area drank milk at least once a day [4], the children in Seoul and the Gyeonggi-do area drank relatively less milk. The highest proportion of the respondents, at 40.3%, ate beans and bean products once a week, and the highest rate of eating meat was 3 to 4 times a week at 54.5%. No respondent replied that they did not eat meat. In the case of fish, the highest proportion of 43.5% responded that they ate fish once a week. This was similar to the intake patterns of tofu, meat, and fish found in preschool children from Daejeon [8]. The dietary guideline for infants and preschool children, which is provided by the Ministry of Health and Welfare, recommends that children should consume many different types of food including grains, fruits, vegetables, fish, meat, and dairy, all of which suggest that the preschool children living in Seoul and the Gyeonggi-do area should be eating various kinds of food.
In the moderation dimension, this study found that the consumption frequency of processed meat and fast foods differed by region (P < 0.05), and a significant difference was found in the consumption frequency of fast-food by age (P < 0.05) and weight status (P < 0.05). 68.2% in Seoul and 75.6% in Gyeonggi-do replied that they ate processed meat once or more times every week (P < 0.05). The proportion of children who ate fast-food once or more times every week was 28.6% in Seoul and 12.6% in the Gyeonggi-do area, thereby showing a significant difference by region (P < 0.05). In comparison with 11.9% in Daejeon [8] and 4.4% in Dongducheon [14], children in Seoul displayed a tendency to eat fast foods more frequently, which requires measures for improvement. A comparative study of fast foods consumption of students by region [42] found that students living in big cities tend to consume fast foods the most. It is thus likely that the fast foods consumption patterns of preschool children would be similar, which, in Seoul, may have been affected by the lack of time to plan for meals at home. In regards to the consumption rate of fast foods was significantly higher in the 5-year-old children (P < 0.05). Although it was not statistically significant, the same pattern was detected in the study on the preschool children in Daejeon [8], as the 5 to 6-year-old children ate more fast foods than the 3 to 4-year-old children. The 3 to 5-year-old children in this study ate more fast foods than one to 2-year-old children, according to a study on preschool children in Gwangju [16], all of which suggested that education on healthy diets are necessary as children tend to eat more processed foods as they grow. This study also found that the consumption frequency of fast foods of the obese group was significantly higher than that of the non-obese group (P < 0.05), which would require guidance for the obese group to reduce their fast foods consumption and increase their consumption of healthy food, and to provide children with nutrition education to prevent obesity.
In the environment dimension, 74.7% of the respondents replied that they have breakfast 5 or more times every week, which was a lower rate compared to the survey results presented by KNHANES VII-3 [5], which found that 82.8% of the chi, 19ldren from the age of 3 to 5 ate breakfast 5 or more times every week. Moreover, on the question whether their children do not wander around and eat their meals seated, the result was similar to the study conducted on the infants in Daejeon [8] and showed that the frequency of non-overweight/obese group moving around during mealtime was significantly higher (P < 0.05), which may be due to the cases in which underweight children wander during their meals. 16.2% responded that they have always put the effort in practicing a healthy diet, and there was also a significant difference in the practice of healthy diets by the sex of the children (P < 0.05), which suggests that for children to be educated and instructed to maintain healthy diets at home, relevant educational contents for the parents should be developed. 20.6% of the respondents replied that they always had their children wash their hands before meals, which was markedly lower than that of the children from the Gyeongsan area (43.3%) [4] and that of the children from Nowon-gu (39.9%) [7]. This study further found that 47.8% of the subjects watched TV, smartphones, or computers for 2 hours or longer every day, which was higher than the rates in the Jecheon area, which was 35.3% [15], and the Gyeongsan area, which was 23.8% [4]. Repeated guidance on hand washing and limiting the use of electronic devices that are linked to the lessons at daycare centers and kindergarten should be provided at home.
An examination of the total NQ-P scores and the scores in each dimension sex, age, region, and weight status showed that the total NQ-P score of the subjects of this study was 59.47, which was considerably lower than the national-level score of 60.6 [2], 59.6 of the Gyeongsan area [4], 65.2 of the children in Dongducheon [14], 62.1 of the children in Ganghwado [13], and the score of 59.9 of the children living in Gwangju [16], and only slightly higher than the score of children in Jecheon, which was 58.5. The overall average was also at the “mid-low” level, which would require further monitoring. 23.7% of preschool children were classified as the high level, the proportion of which was relatively lower than other regions, including Daejeon, which was at 30% [8], and the Jecheon area, which was at 24.7% [15]. The findings of this study suggested that education for preschool children in the Seoul and Gyeonggi-do region and their parents is pivotal to improve the dietary habits of the children and the quality of their meals.
The subjects of this study were classified as “mid-low” in all dimensions as they scored 61.62 in the balance dimension, 48.41 in the moderation dimension, and 68.91 in the environment dimension. This study compared the results with previous studies conducted on the national level and in Jecheon, Daejeon, and Gwangju that used NQ-P. The scores in the national survey [2] were 60.49 for balance, 51.49 for moderation, and 71.66 for environment; the scores of the subjects in Jecheon [15] were, 60.5 for balance, 51.26 for moderation, and 63.78 for environment; the scores of the subjects in Daejeon [8] were 60.5 for balance, 50.2 for moderation, and 65 for environment; and the scores of the subjects in Gwangju [16] were 61.1 for balance, 56.0 for moderation, and 62.6 for environment. The score of the balance and environment dimension of this study was relatively higher than the results in the other regions. However, the score of moderation was relatively lower, which suggests that the preschool children in Seoul and the Gyeonggi-do area should receive education for improving their dietary behaviors.
The average scores of the NQ-P showed that there was a significant difference by sex in the balance dimension and a significant difference by age in the moderation dimension. The scores in the moderation dimension tended to drop significantly as the children became older while the scores in the balance and environment dimensions increased by age. This result showed that while children are exposed to more diverse food and gain better eating attitudes as they grow, they come to have more encounters with unhealthy food at the same time. Such results were also found in the research on the children in Daejeon [8] and in Gwangju [16] where the consumption frequency of processed food and the consumption of fast foods increased by age, all of which shows how dietary education on the consumption of processed food and fast foods for preschool children should be programmed to fit the dietary characteristics by each age group for the children to form healthy dietary habits.
Since the moderation dimension could be determined by the parents’ attitudes towards food purchase and their preference toward foods such as processed meat and fast foods, education on choosing and feeding healthy food for children for parents would be necessary. This study also found a difference between the overweight/obese group and the non-overweight/non-obese group in the “environment” dimension. Although there was no significant difference in the 2 group's average scores, the score of the obese group was higher. Considering the facts that there were underweight children included in the non-obese and non-overweight group and that 15% of the subjects were underweight, and also that 15.2% of the children in the national level study [2] displayed signs of picky eating, the underweight children seem to have lower BMI as they tend to be picky eaters who do not focus during mealtime and eat smaller portions than required. A study on the dietary attitudes of children in Daegu in regards to obesity [43] also showed that the underweight group's score of the item, “My child does not wander during mealtime,” was significantly low (P < 0.05). This study further pointed out the dietary issues of underweight children by finding that the more underweight the child was, there was a more significant drop in the average of the score on dietary behaviors (P < 0.001). Mealtime guidance and education programs for improving eating environments should be provided so that the children, who are at a critical stage for their growth, do not suffer from an imbalance in their nutrition and undernutrition caused by a loss of appetite, picky eating habits, and hostile eating environments.
The average score of the parents' health consciousness in this study was 3.89, and there was no difference according to the characteristics of the subjects. An examination of the NQ-P scores concerning the health consciousness of the subjects showed that the group with higher health consciousness had significantly higher total NQ-P scores (61.97, P < 0.05) and in the balance (65.66, P < 0.01) and environment (73.54, P < 0.05) dimensions. A study conducted on college students in Busan found that the rate of health practices was significantly higher in students who were more health-conscious [32]. Another study presented that the intention to use nutritional facts was higher among highly self-conscious consumer groups [36], which suggests that the highly health-conscious parents would likely choose healthy food and practice healthy behavior and would have a positive effect on their child's healthy diet. Taken together, there is a need for educational programs that could improve the parents' health-consciousness for children to have and continue to have healthy eating habits. Regarding the balance and environment dimensions, the group of parents with low health-consciousness should be encouraged to get interested in themes such as having a balanced meal or establishing healthy eating habits. It would be more effective to provide the high health-consciousness group with more in-depth nutrition education. No significant difference was found according to the parents’ health-consciousness in the moderation dimension. Considering that the total average in the moderation dimension was lower than that from a study on other areas, there is an urgent need for education programs for preschool children who experience a variety of food to eat less processed meat, processed beverages, and fast foods.
In conclusion, the total score of the dietary behaviors of preschool children in Seoul and the Gyeonggi-do was low compared to the national-level survey and was placed at the mid-low level, thus requiring constant monitoring. This study also found a significant difference in the score of the eating behavior of preschool children depending on the parents' health consciousness. While previous studies on the factors that affect the eating behaviors of preschool children focused on the demographic factors, this study newly presented that the parents' beliefs that underlie their actions, that is, their health consciousness could also be one of the factors. This study identified distinctive dietary attitudes of the subjects that were not found in the previous studies conducted in other regions. The findings of this study also implied that the dietary habits and the quality of meals of preschool children could be at risk, which would require in-depth research not only on the diet of obese children but also on the diet of underweight children. As this study was regionally limited to Seoul and the Gyeonggi-do area, it would be difficult to generalize the findings. There was also the possibility that the parents may have underestimated or overestimated their children's eating habits in responding to the questionnaire. Since the degree of obesity was measured based on the safe-contained values entered by the parents or the caregivers, the possibility of misclassification cannot be excluded. Therefore, prospective studies are needed, and we suggest that future research that uses NQ-P to consecutively assess the dietary behaviors of preschool children on the national level would be able to provide the changes in the dietary behaviors of preschool children and serve as meaningful data for future policies on improving nutrition and health.
It would also be helpful for children to form healthy habits and positive nutritional status by examining the various factors related to the dietary behavior and growth of children and parents in the future. As well, further research on the variables of the parents' beliefs of eating behavior and healthy behavior and their effects on preschool children would be useful in developing effective educational programs on healthy dietary habits.
Go to :
 XML Download