

 PDF
PDF Citation
 Print
Print


INTRODUCTION
Rapid population aging is a worldwide problem. Whereas only 8.5% of the total world population was 65 years or older in 2015, the percentage is projected to reach 16.7% by 2050. Life expectancy is also anticipated to increase from 68.6 years in 2015 to 76.2 years by 2050 [1]. The increase of the elderly population and life expectancy are more rapid in South Korea, which became an ‘aged society’ in 2018, with 14.8% of its population consisting of adults aged 65 years or older [2].
With the increase of the elderly population, the number of senior leisure service (SLS) facilities in South Korea is also increasing. There were 59,422 SLS facilities in 2008, and the number rose to 68,013 in 2018 [3]. The SLS facility is one of the categories of welfare facilities for the aged based on the Welfare of the Aged Act, and it is further classified into senior service center, community senior center, and senior school [4]. SLS facilities comprise 85.7% of the entire welfare facilities for the aged [3]. SLS facilities provide social participation opportunities for elderly communities, as well as health promotion and disease prevention services. The majority of SLS facilities also provide meals as a part of their services. As meals provided in SLS facilities have become an increasingly important part of older adults' diets, hygiene and nutrition management of foodservice in SLS facilities may have a considerable impact on the health of older population.
However, it has been noted in previous studies that the meal services in SLS facilities still need improvement. There are no dietitians in more than half of SLS facilities, and the SLS facilities without a dietitian had unprofessional and inadequate foodservice management systems [5678]. The operation of SLS facilities follows the Welfare of the Aged Act, which lacks regulations on the allocation of dietitians and only requires hiring a cook, without specifying the number of cooks required per certain number of users [4].
There have been several studies about dietary quality of meals provided for the elderly in nursing homes [910], residential welfare facilities [811], and home-delivered meal service for the elderly on low-incomes [61213]. With regard to meals provided by SLS facilities, studies about foodservice management practices [57814] and needs or satisfaction levels of users [151617] were mainly conducted.
Studies investigating dietary quality of meals consumed by older people in community SLS facilities are limited. Most of the existing studies on meals in SLS facilities analyzed the nutritional status of the low-income elderly who used such facilities [181920]. Han et al. [18] found that 67% of 309 elderly individuals who consumed meals in SLS facilities were either at a risk of malnutrition or were malnourished. However, the ones eating lunch at SLS facilities in rural areas consumed more than 40% of their daily intake of each nutrient [19] and low-income elderly individuals showed significantly increased intake of nutrients one year after eating at SLS facilities [20]. Most studies were conducted only in certain regions, and there is a lack of studies assessing the quality of meals consumed in SLS facilities nationwide. No study compared the nutritional quality of the meals provided in SLS facilities according to whether they are served by institutional foodservice (IF) or non-institutional foodservice (non-IF). Therefore, we comparatively analyzed the quality of lunch consumed by the elderly in community SLS facilities based on whether the meal was served by IF and non-IF. We evaluated nutritional intake and diversity of meals. We aimed to present foundational data for the systematic management of food service programs in SLS facilities.
Go to : 
SUBJECTS AND METHODS
Participants
This study analyzed data from years 1–3 of the 6th Korea National Health and Nutrition Examination Survey (KNHANES), and data from years 1–2 of the 7th KNHANES (KCDC Institutional Review Board [IRB] approval: 2013-07CON-03-4C, 2014-12EXP-03-5C, no IRB review from year 3 of the 6th KNHANES). Of people who participated in both surveys, 6,717 people aged 65 years or older who had eaten lunch were identified. From this group, 398 people who had eaten lunch at senior service centers, community senior centers, or senior schools were selected. After excluding 8 people who only had alcohol or soda for lunch, a total of 390 people were finally selected for this study. Participants who had eaten lunch provided by foodservices were classified into the IF group (n = 129), while those who had eaten home-prepared or purchased meals were classified into the non-IF group (n = 261).
General characteristics and perceived health status
Participants' demographics, including sex, age, area of residence, education level, marital status, household size, and income level were analyzed. Residence area was divided into rural and urban. Perceived health status was evaluated by self-rated health status and “chewing problems”, which were graded on a 5-point scale from 1, meaning “very inconvenient” or “very bad,” to 5, meaning “not inconvenient at all” or “very good.” Body mass index (BMI) was also analyzed.
Meal quality
The intake of each major food groups as well as energy and major nutrients was analyzed. Food groups were categorized into grains, potatoes and starch, sugars, beans, meats, eggs, seafoods, seaweeds, seeds and nuts, vegetables, mushrooms, fruits, dairy products, and drinks and alcohol.
Further, the nutrient adequacy ratio (NAR) and mean adequacy ratio (MAR) were computed for energy and 9 major nutrients (protein, calcium, iron, phosphorus, vitamin A, thiamine, riboflavin, niacin, and vitamin C). For the NAR, the participants' nutrient intake was compared with one-third of the recommended intake for male and female aged 65 years or older as specified in the 2015 Korean Nutrient Intake Standard [21]. The MAR was calculated by dividing the sum of the NAR of nutrients by the number of nutrients [22].
To assess the diversity of meals, food group patterns (grains, meats, vegetables, fruits, and dairy products [GMVFD] pattern), dietary diversity score (DDS), and dietary variety score (DVS) were analyzed. The minimum recommended intake was applied when calculating GMVFD pattern, DDS, and DVS [23], and one-third of the minimum intake was used to reflect that we evaluated only the lunch. Seasoning and condiments were excluded from the analysis. The GMVFD patterns were marked as 1 to indicate intake of the corresponding food group and 0 to indicate no intake. The DDS was calculated based on how many of the 5 food groups were eaten by the participants [23] and the DVS was the number of all non-overlapping foods eaten at lunch [24].
Statistical analysis
Statistical processing and analysis were carried out using the SPSS 25.0 package (SPSS Inc., Chicago, IL, USA), and complex sampling analysis with cluster sampling variables, strata, and weighted values was performed. Differences in categorical data between the IF and non-IF group were analyzed using the chi-squared test and general linear model. To adjust for confounding variables, energy intake was adjusted in model 1, and sex and energy intake were adjusted in model 2. Energy intake, sex, area of residence, education level, and economic status were adjusted in model 3. Statistical significance was defined as P < 0.05.
Go to :
RESULTS
General characteristics and perceived health status
Table 1 shows the general characteristics of the participants. Of a total of 390 subjects, 129 were classified into the IF group, while 261 belonged to the non-IF group. Overall, there were more female (66.3%) than male (33.7%), and the percentage of female was higher in the non-IF group (73.8%) than in the IF group (52.7%) (P = 0.001). The mean age was 75.7 years, and there were more people aged 75 years or older (64.2%) than people aged 65–74 years (35.8%), with no significant differences between the IF and non-IF group. There were more people living in urban areas (61.2%) than in rural areas (38.8%), and a higher percentage of people in the IF group lived in urban areas (80.1%) than in rural areas (50.9%) (P < 0.001). The percentage of recipients of National Basic Livelihood Security was higher in the IF group (29.4%) than in the non-IF group (13.5%) (P = 0.001), but there were no significant differences in household income quartile distribution and total household income between the 2 groups. There were also no significant differences in marital status and household size between the 2 groups.
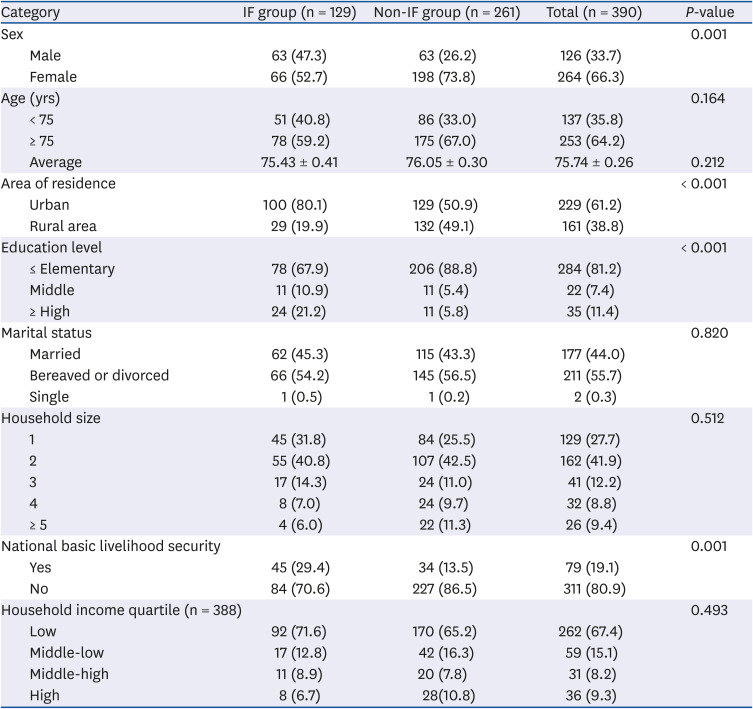
Table 1
General characteristics of subjects
Values are expressed as mean ± SE or number (%). P-values were analyzed by complex sample χ2 test or complex sample general linear model t-test.
IF, institutional foodservice; non-IF, non-institutional foodservice.
![]()
The mean BMI was 18.9 kg/m2, and there was no significant difference in BMI between the 2 groups. About half of the subjects rated themselves to be in “moderate” health (48.4%), with a mean score of 2.65 out of 5.0, which is below “moderate.” There was no significant difference in self-rated health status between the 2 groups. Regarding chewing problems, 39.1% of the participants claimed that they found chewing to be “uncomfortable,” with a mean score of 3.16 out of 5.0. There was also no significant difference in chewing problems between the 2 groups (Table 2).
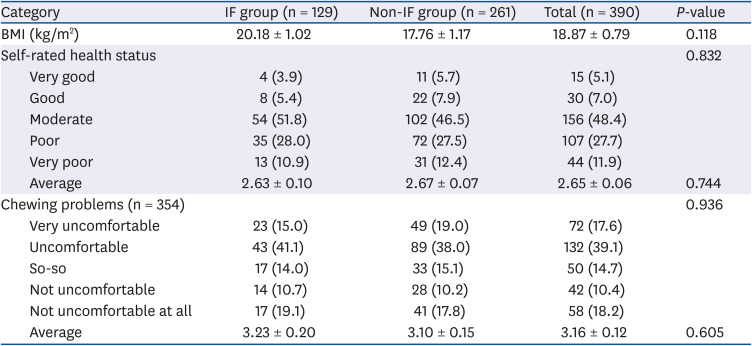
Table 2
BMI and perceived health status
Values are expressed as mean ± SE or number (%). P-values were analyzed by complex sample χ2 test or complex sample general linear model t-test.
BMI, body mass index; IF, institutional foodservice; non-IF, non-institutional foodservice.
![]()
Major food groups intake
Table 3 shows the intake of major food groups of the subjects and there were significant differences between the 2 groups in the intake of some food groups. The intake of seafoods, seaweeds, and dairy products was significantly higher in the IF group than in the non-IF group, not only in model 1 but also in models 2 and 3. Seafood intake was more than 4 times higher in the IF group (74.8 g) than in the non-IF group (16.2 g) (P < 0.001 in models 1, 2, and 3), and seaweeds intake was more than 5 times higher in the IF group (24.8 g) than in the non-IF group (4.5 g) (P < 0.001 in models 1 and 2, and P = 0.002 in model 3). Intake of dairy products was approximately twice as high in the IF group (73.5 g) than in the non-IF group (38.2 g) (P = 0.023 in model 1, P = 0.019 in model 2, and P = 0.015 in model 3).
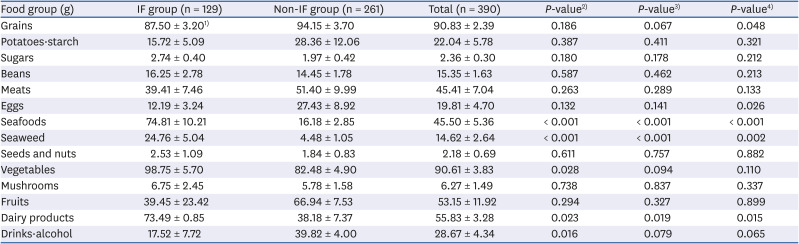
Table 3
Intake by major food groups
Values are expressed as mean ± SE. P-values were analyzed by complex sample general linear model t-test.
IF, institutional foodservice; non-IF, non-institutional foodservice.
1)Values in model 1.
2)Adjusted for energy intake (model 1).
3)Adjusted for energy intake and sex (model 2).
4)Adjusted for energy intake, sex, area of residence, education level, and receipt of National Basic Livelihood Security (model 3).
![]()
However, intake of grains (P = 0.048 in model 3) and eggs (P = 0.026 in model 3) was higher in the non-IF group than in the IF group, after adjusting the confounding variables. Intake of drinks and alcohol also tended to be higher in the non-IF group than in the IF group (P = 0.016 in model 1, P = 0.079 in model 2, and P = 0.065 in model 3). There were no significant differences between the 2 groups regarding other food groups.
Energy and major nutrients intake
Table 4 shows the amount of energy and major nutrients intake of the subjects. The IF group (505.4 kcal) had a higher energy intake than the non-IF group (452.5 kcal) (P = 0.024 in model 1), but there were no significant differences between the 2 groups after adjusting for sex, residence area, education level, and economic status (models 2 and 3). Water intake was significantly higher in the IF group (221.5 g) than in the non-IF group (143.5 g) (P < 0.001 in models 1, 2, and 3).
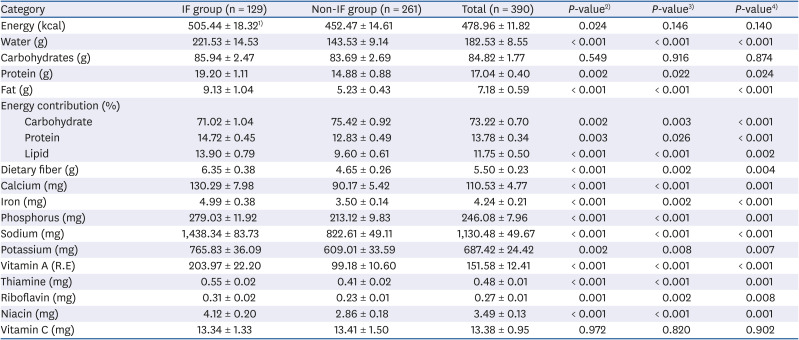
Table 4
Energy and major nutrients intake
Values are expressed as mean ± SE. P-values were analyzed by complex sample general linear model t-test.
IF, institutional foodservice; non-IF, non-institutional foodservice.
1)Values in model 1.
2)Adjusted for energy intake (model 1).
3)Adjusted for energy intake and sex (model 2).
4)Adjusted for energy intake, sex, area of residence, education level, and receipt of National Basic Livelihood Security (model 3).
![]()
In the analysis of nutrients intake after adjusting for energy intake (model 1), the intake of all nutrients except carbohydrate and vitamin C was significantly higher in the IF group than in the non-IF group. This result was consistent even after additionally adjusting for confounding variables (models 2 and 3). In particular, vitamin A intake was more than twice as high in the IF group (204.0 mg) than in the non-IF group (99.2 mg) (P < 0.001 in models 1, 2, and 3), and calcium intake was markedly higher in the IF group (130.9 mg) than in the non-IF group (90.2 mg) (P < 0.001 in model 1, 2, 3). However, sodium intake was 1.5 times higher in the IF group (1,438 mg) than in the non-IF group (822 mg) (P < 0.001 in models 1, 2, and 3).
In the comparison of the contribution to total energy, carbohydrate contribution was significantly higher in the non-IF group than in the IF group (P = 0.002 in model 1, P = 0.003 in model 2, and P < 0.001 in model 3), while protein (P = 0.003 in model 1, P = 0.026 in model 2, and P < 0.001 in models 3) and lipid (P < 0.001 in models 1 and 2, P = 0.002 in model 3) contributions were significantly higher in the IF group than in the non-IF group.
NAR and MAR
Table 5 shows the NAR and MAR values computed by comparing the participants' energy and major nutrients intake with one-third of the recommended dietary reference intake for Koreans [22]. The mean NAR for energy was 0.83, with no significant differences between the 2 groups, whereas NARs of all nutrients, except vitamin C, were higher in the IF group than in the non-IF group. However, the NAR for vitamin A, riboflavin, niacin, and calcium was below 1 for both the IF and non-IF group. In the non-IF group, the NAR of protein and phosphorus was also below 1 (0.89 and 0.91, respectively), and their NARs for vitamin A, riboflavin, niacin, and calcium (0.48, 0.68, 0.57, and 0.48, respectively) are relatively much lower. Although there were no significant differences in the NAR for vitamin C between the 2 groups, both groups showed a very low value at around 0.55 (IF group = 0.53, non-IF group = 0.54).
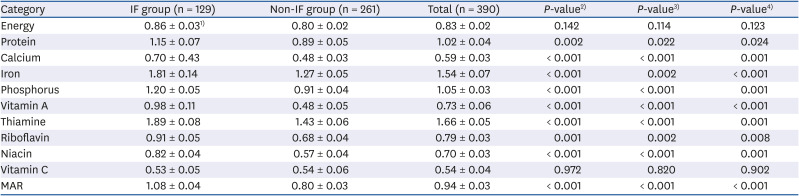
Table 5
NAR for energy and major nutrients and MAR
Values are expressed as mean ± SE. P-values were analyzed by complex sample general linear model t-test.
NAR, nutrient adequacy ratio; MAR, mean adequacy ratio; IF, institutional foodservice; non-IF, non-institutional foodservice.
1)Values in model 1.
2)Adjusted for energy intake (model 1).
3)Adjusted for energy intake and sex (model 2).
4)Adjusted for energy intake, sex, area of residence, education level, and receipt of National Basic Livelihood Security (model 3).
![]()
The MAR was significantly higher in the IF group (1.08) than in the non-IF group (0.80) (P < 0.001 in model 1). It showed the same result when adjusting for the additional confounding variables (P < 0.001 in models 2 and 3).
Dietary diversity
Table 6 shows the GMVFD patterns, DDS, and DVS. Overall, the G + M + V pattern was the most common (50.5%), followed by the G + V pattern (27.9%). The proportion of the G + M + V pattern was higher in the IF group (71.6%) than in the non-IF group (38.9%), and the G + V pattern was the most common in the non-IF group (39.7%). Only one participant from the IF group showed the G + M + V + F + D pattern.
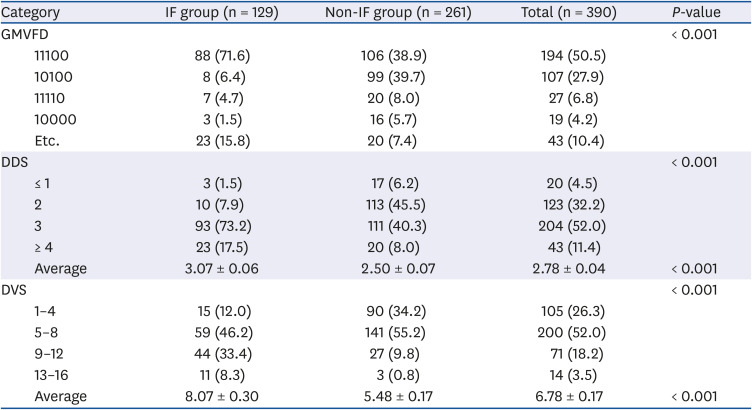
Table 6
Food group intake patterns, DDS, and DVS
Values are expressed as mean ± SE or number (%). P-values were analyzed by complex sample χ2 test or complex sample general linear model t-test.
DDS, dietary diversity score; DVS, dietary variety score; GMVFD, grain, meat, vegetable, fruit, dairy product; IF, institutional foodservice; non-IF, non-institutional foodservice.
![]()
Regarding the DDS, 52.0% of the subjects consumed 3 food groups. The majority of the IF group consumed 3 food groups (73.2%), while the greatest number of subjects in the non-IF group consumed 2 food groups (45.5%). The IF group showed significantly higher DDS (3.1) and DVS (8.1) than the non-IF group (2.5 and 5.5, respectively) (P < 0.001).
Go to :
DISCUSSION
The exact number of the elderly Korean using meal services in SLS facilities has not been reported, but it was estimated that about 104,000 were subject to the free meal service provided by senior service centers in 2010 [25]. Another study conducted in 2013 reported that about half of the elderly population in rural areas had meals approximately 3 times per week in community senior centers [26]. Although there are no reports of current status, the role of meals provided by SLS facilities in maintaining their health is becoming more and more important with the steady increase of the elderly population using SLS facilities. However, the results of this study found that the lunches consumed in the SLS facilities need to be improved. Overall, meals provided by non-IFs were poorer than meals served by IFs in qualitative as well as quantitative aspects.
Elderly people consuming lunches provided by non-IFs showed significantly lower intakes of major nutrients compared to their counterparts. Seven nutrients out of nine did not meet one-third of the daily requirement. In particular, the intake of calcium, niacin, and vitamin C were around half of one-third of the daily requirement. The diversity of meals in the non-IF group was considerably lower, with nearly 40% eating only grains and vegetables, whereas the elderly served by IFs consumed a greater variety of foods, who had a markedly higher seafood intake without significant differences in meat intake. Meats and seafoods are important sources of protein, and sufficient protein intake is important for older adults in order to prevent physical functional impairments resulting from reduced muscle mass with aging [27]. In addition, seafoods contain a high amount of ω-3 unsaturated fatty acids and thus are recommended for older adults [28]. The intakes of dairy products and seaweeds were also substantially higher in the IF group.
However, both groups had inadequate energy intakes regardless of meal type. Assuming that one-third of the daily energy requirement needs to be consumed through lunch, intake for both the IF and non-IF groups fell below the requirement. Multiple studies have reported that elderly Koreans have inadequate energy intakes [1029], which could be due to reduced appetite with aging [30]. High carbohydrate and low lipid intakes were another common problem, although it was more evident in the non-IF group. Previous studies also reported excessively high intakes of carbohydrate and relatively lower lipid intakes in older adults [2931]. Therefore, adequate meal plans to help SLS facility users consume sufficient energy through lunch, equivalent to at least one-third of their daily energy need, with balanced energy contribution from macronutrients, are most urgently required.
Insufficient intake of calcium and vitamin C was also an observed common problem, suggesting the need to include more fruits, vegetables, and dairy products in menus. This result was different from that of a previous study analyzing 514 menus from 27 senior service centers, which showed sufficient supply of nutrients including calcium and vitamin C [32]. Another study also reported that the energy and nutrient content was sufficient except for calcium, after analyzing the lunches provided by several senior service centers [33]. The difference could be because our study analyzed the meals each participant consumed, rather than the meals supplied. Therefore, a nutrition education program for SLS facility users to teach them about healthy eating and appropriate serving sizes should be run in parallel with systematic meal planning.
Even though the IF meals were of better quality overall, they contained much more sodium. The sodium intake of the IF group was approximately 3 times higher than one-third of the daily recommended intake. Excessive sodium intake in Korean older adults is well known [3034], and several studies have revealed that the average sodium content of meals served by senior service centers is more than 2,000 mg [3233]. This finding may not be entirely accurate, as the nutritional data from the KNHANES was calculated from the nutrient content database using standard recipes but the facilities themselves may have provided low-sodium menus. Even so, development and application of low-sodium menus for IF programs for the elderly, while maintaining taste and nutrition quality, should be steadily progressed.
Of the 68,013 SLS facilities registered in 2018, the majority were community senior centers, equivalent to 97.5% [3], which are usually small-scale and provide meals without experts such as dietitians. As the KNHANES classified all the SLS facilities into a single variable, we could not identify each center where participants consumed lunches. However, it can be assumed that the majority of the IF group consumed their lunch at senior service centers and the majority of non-IF group consumed their lunch at community senior centers, because most senior service centers are large-scale and usually serve meals provided by IFs managed by dietitians [81432]. The facilities providing meals from non-IF, which are mostly community senior centers where meal planning or cooking depends on non-professional staff, are in a blind spot regarding nutritional management. Several studies have reported that the foodservice system in community senior centers is inadequate [567].
In conclusion, the foodservice programs in SLS facilities should be run more systematically with a menu planning manual to ensure the nutritional needs of older adults are met. It is as important to establish nutritional standards and specific guidelines for SLS facilities as it is for school lunch programs. Moreover, follow-up management is needed to ensure that useful and informative materials already developed are well-distributed and practiced. The implementation of dietitians input in foodservices should be also considered. It is evident that foodservice management is more systematically conducted in SLS facilities which utilize dietitian input than in those which do not [5833]. Relevant education and support is needed for SLS facilities that provide lunches through non-IFs, especially for community senior centers. Nutrition education should be provided to people in charge of meal planning and cooking in the facilities where users prepare their own lunches.
This study has some limitations. The number of subjects was small and thus could not be considered fully representative. In addition, we could not further compare the differences among the facility types, as the KNHANES classified SLS facilities into a single variable. Despite these limitations, this study is significant in that it compares the quality of lunches consumed in SLS facilities by distinguishing IFs from non-IFs. The findings of this study will be useful as foundational data for running senior foodservice programs more effectively. More in-depth studies, particularly in small-scale facilities such as community senior centers, are recommended.
Go to :
 XML Download