

 PDF
PDF Citation
 Print
Print


INTRODUCTION
While the life expectancy has been increased since 2005, the health-span tended to decrease compare to 2016 [1]. As of 2018 the life expectancy was 82.7 years but the healthy life year was 64.4 years with about 17 years of discrepancy. This suggests that it might be necessary to improve the quality of life in the elderly, for which mental and physical health management is needed in the middle-aged. The middle-aged is a period of being exposed to various stresses which are major factors for lowering the quality of life and health [2]. Middle-aged men experience psychological stress due to various role performance and physical changes. Stress causes physical and mental symptoms such as peripheral vascular disorders, gastrointestinal discomfort, and muscular tension in middle-aged women [3].
Stress is associated with dietary behavior, and also affects dietary intake patterns and can induce overeating or meal-skipping. Overeating leads to obesity and meal-skipping can reduce body weight resulting in serious adverse effect on health [4]. Proper dietary habits are the basics of balanced nutritional intake and a major factor to determine the individual health status. Irregular dietary habits not only disrupt physical health but also can affect psychological condition and emotional stability [5].
Stress is known to be a major risk factor for sleep disorder [6]. Sleep disorder includes difficulties in falling asleep, waking up frequently or too early causing fatigue during daily activities [7]. Sleep disorder has been increased by 8.1% annually during the past 5 years, and the number of patients with sleep disorder has been increased by age according to 2018 Health Insurance Report [8]. Except for population over 65 years of age, sleep disorder was the highest in the middle-aged group. Also, sleep disorder has increased the incidence of cardiovascular disease, diabetes, hypertension, and metabolic syndrome in adults [910].
In middle-aged people, proper management of stress, dietary habits, emotional dietary behaviors and sleep can improve the quality of life and health. But it is thought that the improved quality of life and healthy lifestyle can be maintained more effectively when the relationship between stress and lifestyle is checked and managed together rather than separate management of stress and lifestyle. Thus, the study was performed to investigate and analyze dietary habits, emotional dietary behavior, and sleep according to sex and stress of middle-aged people and then to provide basic data for nutrition education and nutritional intervention of middle-aged subjects.
Go to : 
SUBJECTS AND METHODS
Subjects and data collection
A survey was conducted using online and self-administered methods in middle-aged subjects of 40-64 years of age in Seoul and Gyeonggi area from May 5 to May 22, 2020. Among a total of 724 questionnaire collected, 670 questionnaire including 417 online questionnaire (180 men, 237 women) and 253 written questionnaire (140 men, 113 women) were used in the study, after those with 54 missing responses were excluded. A survey response rate was 92.5%.
General characteristics
General characteristics of the subjects included age, body weight status, perceived health status, education level, occupation, and monthly household income. Anthropometric data of the subjects were obtained from self-administered questionnaire and the body mass index (BMI, kg/m2) was calculated using height and weight. BMI was divided into underweight (BMI < 18.5), normal weight (18.5 ≤ BMI < 23), overweight (23 ≤ BMI < 25), and obesity (BMI ≥ 25) according to the Asia-Pacific BMI classifications (World Health Organization 2000) [11].
Stress
The stress score used PSS (perceived stress scale) developed by Cohen et al. [12] and adapted by Lee et al. [13]. It was made of a total of 10 questions, and each question was evaluated by Likert 5-point scale. The range of total score was 0–40 points and the perceived stress level was severe as the score increased. The Cronbach's alpha was 0.79 in the study.
Dietary habits
A total of 10 questions on dietary habits included three meals a day, breakfast, meal regularity and amount, food combination, green-and-yellow vegetable intake, fruit intake, protein intake, milk and dairy product intake, seaweed intake, and water intake. Each question was evaluated by Likert 5-point scale. The higher score meant good dietary habits. In this study, the upper 30% was classified as high level, the next 40% as middle level, and the lower 30% as low level for analysis. The Cronbach’s alpha was 0.83.
Emotional eating behavior
The level of emotional dietary behavior used emotional eater questionnaire (EEQ) developed by Garaulet et al. [14]. It was made of a total of 10 questions, and each question was evaluated by Likert 4-point scale. In the study, 0–5 points were classified as non-emotional eater group, 6–10 points as low emotional eater group, and over 11 points as emotional eater group for analysis. Before the study, the validity and reliability of the questionnaire were established. The Cronbach's alpha was 0.78 in the previous study [15] and 0.87 in this study.
Sleep quality
The insomnia level used insomnia severity index (ISI), which was developed by Bastien et al. [16] and adapted by Cho et al. [17] as Korean version of ISI. It was made of a total of 7 questions and each question was evaluated by Likert 5-point scale. In the study, 0–7 points were classified as no clinically significant insomnia group, 8–14 points as subthreshold insomnia group, and over 15 points as clinical insomnia group for analysis. In the previous study [17], the Cronbach's alpha was 0.92; in this study, it was 0.86.
Statistical analysis
Data were analyzed using SPSS Win 25.0. For general characteristics, the frequency and percentage were calculated, and continuous variables were analyzed using independent samples t-test. One-way analysis of variance test was performed to obtain stress score according to dietary habits, emotional dietary behavior, and insomnia level, and post hoc analysis was performed using Duncan's new multiple range test. Pearson's correlation coefficient test was performed to find the association among dietary habits, emotional dietary behavior, insomnia, and stress. All results were determined the statistical significance at P < 0.05.
Research ethics
For written questionnaire, the instruction was presented to the subjects and the consent form was obtained from the subjects who agreed to the instruction after sufficient explanation before the survey. For online questionnaire, the same instruction and agreement form as in the case of written questionnaire were presented and then the survey was proceeded only if the subject checked the ‘I agree’ box for agreement. It was clearly stated in the instruction and agreement form that the withdrawal of the agreement could be made after the participation in the study. Also, it was explained that data would not be used except for this study purpose, and related data would be stored in the Institutional Review Board (IRB) organization for 3 years after the termination of the study, and then all data would be discarded. The study was performed after the deliberation and approval of Myongji University IRB (deliberation No.: MJU-2020-04-002-01).
Go to :
RESULTS
General characteristics of the subjects
General characteristics of the study subjects are show in Table 1.
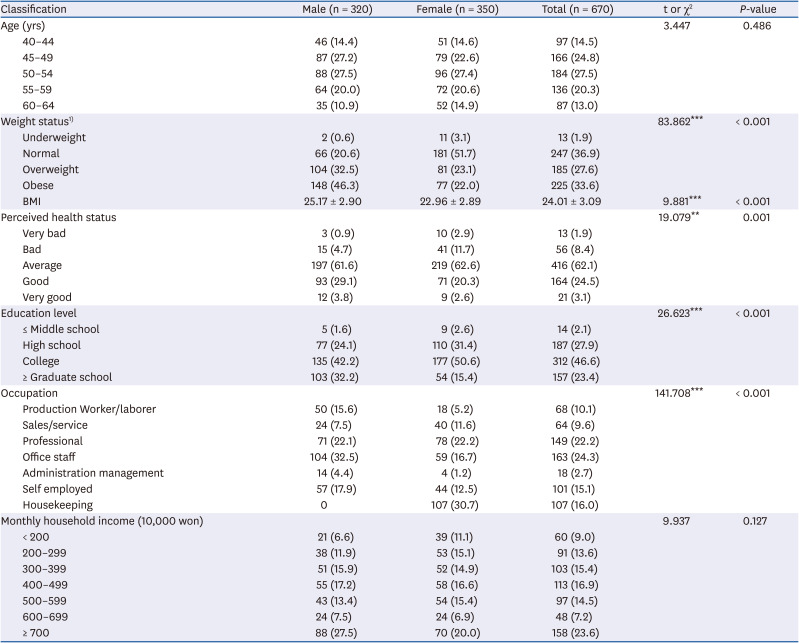
Table 1
General characteristics of subjects by sex
Data are shown as mean ± SD or number (%).
1)Underweight: < 18.5, normal: 18.5–22.9, overweight: 23–24.9, obese: ≥ 25.
**P < 0.01, ***P < 0.001 by independent samples t-test or χ2 test.
![]()
The highest age range was 50-54 years as 27.5% in men and 27.4% in women. For the weight status, ‘obese’ was the highest as 46.3% in men and ‘normal weight’ was the highest as 51.7% in women (P < 0.001). The BMI was 25.17 kg/m2 in men and 22.96 kg/m2 in women (P < 0.001). For the perceived health status, ‘average’ was the highest as 61.6% in men and 62.6% in women. The ratio of positive perceived health status was higher in men while the ratio of negative perceived health status was higher in women (P < 0.01). For education level, college graduate was 42.2% and over graduate school was 32.2% in men; college graduate was 50.6% and high school graduate was 31.4% in women (P < 0.001). For occupation, office staff was the highest as 32.5% and then in the order of 22.1% of professionals and 17.9% of self-employed in men. On the other hand, in women, housekeeping was the highest as 30.7% and then in the order of 22.2% of professionals and 16.7% of office staff (P < 0.001). For monthly household income, the highest was over 7 million won in 27.5% of men and 20.0% of women. The lowest distribution was under 2 million won as 6.6% in men and 6–6.99 million won as 6.9% in women.
Stress
Table 2 shows the stress score of middle-aged men and women. The perceived stress score by sex was not significantly different in middle-aged subjects: The total stress score was 17.75 ± 4.31 in men and 17.89 ± 4.76 in women, and 17.82 ± 4.55 in all subjects.
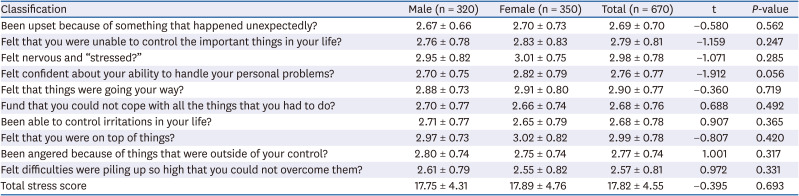
Table 2
Stress score of subjects by sex
![]()
Stress according to dietary habits
Table 3 shows the stress score according to dietary habits level of middle-aged men and women. Stress score according to dietary habits was significantly higher in men with ‘low’ dietary habits level compared to those with ‘moderate’ and ‘high’ levels (P < 0.001). In women, it was significantly higher in those with ‘low’ and ‘moderate’ dietary habits levels compared to those with ‘high’ level (P < 0.05). In all subjects, stress was significantly higher in groups with low dietary habits level (P < 0.001).
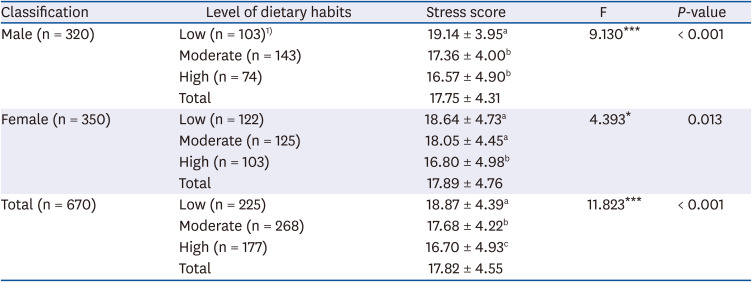
Table 3
Stress score according to dietary habits level of middle-aged men and women
Data are shown as mean ± SD. Means with different superscripts are significantly different from each other at P = 0.05 by Duncan's multiple range test.
1)Number of person.
*P < 0.05, ***P < 0.001 by one-way analysis of variance test.
![]()
Stress according to emotional dietary behavior
Table 4 shows the stress score according to emotional dietary behavior level of middle-aged men and women.
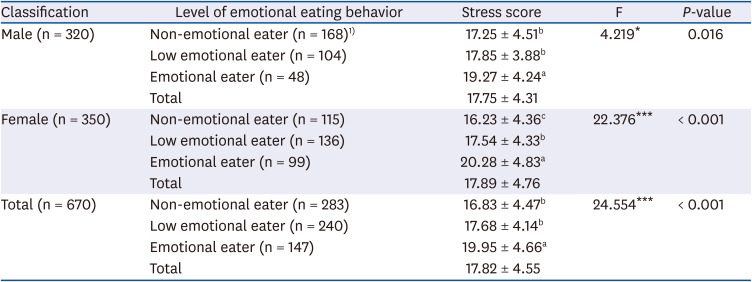
Table 4
Stress score according to emotional eating behavior level of middle-aged men and women
Data are shown as mean ± SD. Means with different superscripts are significantly different from each other at P = 0.05 by Duncan's multiple range test.
1)Number of person.
*P < 0.05, ***P < 0.001 by one-way analysis of variance test.
![]()
Stress score was higher in emotional eaters in men (P < 0.05) and all subjects (P < 0.001) with significant differences. In women, stress was higher in emotional eaters, with a significant difference (P < 0.001).
Stress according to insomnia level
Table 5 shows the stress score according to insomnia level of middle-aged men and women.
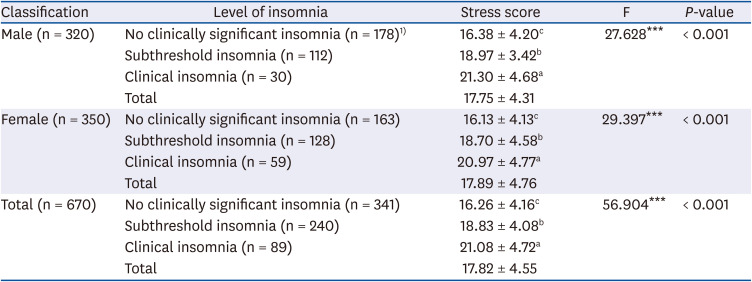
Table 5
Stress score according to insomnia level of middle-aged men and women
Data are shown as mean ± SD. Means with different superscripts are significantly different from each other at P = 0.05 by Duncan's multiple range test.
1)Number of person.
***P < 0.001 by one-way analysis of variance test.
![]()
Stress score was high in men, women, and all subjects in the order of group with no clinically significant insomnia < subthreshold insomnia < clinical insomnia, with a significant difference (P < 0.001).
Correlations among stress, dietary habits, emotional dietary behavior, and insomnia
Table 6 shows the correlations among stress and dietary habits, emotional dietary behavior, and insomnia.
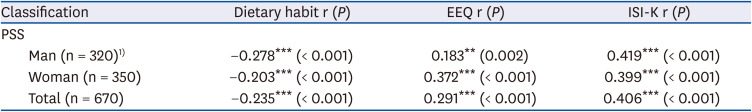
Table 6
Correlations among stress, dietary habit, emotional eating behavior and ISI-K of subjects
PSS, perceived stress scale; EEQ, emotional eating questionnaire; ISI-K, Korean version of the insomnia severity index.
1)Number of person.
**P < 0.01, ***P < 0.001 by Pearson's correlation coefficient.
![]()
The results of correlation analysis of stress and dietary habit, emotional dietary behavior, and sleep showed significantly negative correlations between stress and dietary habits in middle-aged men, women, and all subjects (P < 0.001), and significantly positive correlations between stress and emotional dietary behavior in men (P < 0.01), women (P < 0.001), and all subjects (P < 0.001). Significantly positive correlation was observed between stress and insomnia in men, women, and all subjects (P < 0.001). Therefore, as stress increased in middle-aged subjects, poorer dietary habits and the quality of sleep habit and more emotional dietary behavior was observed.
Go to :
DISCUSSION
The study was performed to investigate the degree of perceived stress by sex in middle-aged people, and to provide basic data to develop appropriate nutrition education and interventional measures for middle-aged people by determining the associations between stress and dietary habits, emotional dietary behavior, and sleep.
In the study, the perceived stress of middle-aged subjects was 17.75 ± 4.31 in men and 17.89 ± 4.76 in women, and 17.82 ± 4.55 in all subjects. In previous studies using the same stress perception measures, a study on college students showed that the perceived stress score was 15.57 ± 5.27 in male students and 16.67 ± 4.75 in female students [18]. In a study of public officials aged 19–59, the score of perceived stress was 16.17 ± 4.75 [19]. From these results, perceived stress seemed higher in middle-aged subjects compared to other age groups. Perceived stress in middle-aged subjects was not significantly different according to sex.
Stress according to dietary habits was significantly higher in men with low dietary habits level compared to other groups and significantly higher in women with low and moderate dietary habits levels compared to those with higher level. In all subjects, stress was significantly higher in groups with low dietary habits level. These results were consistent with those in a study on stress and dietary habits in adult men and women in Ulsan areas, in which stress was higher in the group with low dietary habits level [20]. Also, results of previous studies supported the results of this study in which it is highly possible for adults with higher stress to have undesirable dietary habits, causing health problems [212223].
Stress according to emotional dietary behavior level revealed that it was significantly higher in emotional eaters in men and women, compared to less emotional eaters. These results were similar to those from a study in high school girls [24] and the elderly [25], in which higher stress and depression levels were associated with poor dietary behaviors.
Stress was high in men, women, and all subjects as the quality of sleep became worse. From previous studies on sleep and depression, too short or too long sleep hours increased depression [2627]. Also, in a study of office workers, insufficient sleep caused higher work stress [28]. These results supported the fact that sufficient sleep can be an important factor in stress.
The results of correlation analysis of stress and dietary habit, emotional dietary behavior, and sleep in middle-aged subjects showed a significantly negative correlation between stress and dietary habits and significantly positive correlations between stress, emotional dietary behavior, and insomnia. In the previous research, the results showed the correlations among life stress, sleep, anthropometric measurement and nutrient intakes of college students [29]. Such data support our results that the causes of life stress have an association based on the sleep quality, anthropometric measurement, and nutrient intake.
In conclusion, stress was higher in middle-aged subjects as dietary habits became undesirable, as they were emotional eaters, and as the quality of sleep was lower. Thus, it is considered that stress management programs at the national level are necessary for middle-aged population to relieve and control stress first since stress might be associated with poor dietary habits, emotional dietary behavior, and sleep quality. In addition, it is necessary to investigate researches on lifestyle improvement in middle-aged people and to provide nutrition education for them, and individuals also should actively try for accomplishing these goals.
For the limitations of the study, it was impossible to meet many people as possible due to coronavirus disease 2019 situations and survey targets were middle-aged subjects who might feel uncomfortable for online survey methods; thus, the survey was performed by combining both online and self-administered methods. Since there might be some discrepancies due to survey methods, it is suggested to repeat this study using one method in the future. Also, this study did not reflect objective data of the subjects such as biochemical data or hormonal changes by stress. Therefore, it is suggested to perform a study in the future reflecting health status and objective stress level of the subjects on the basis of biochemical values. Despite these limitations, this study is meaningful in analyzing the stress status according to perceived stress and dietary habits, emotional dietary behavior, and insomnia by sex in middle-aged subjects. Thus, the study results will be used as basic data to develop nutrition education programs and nutrition intervention for lifestyle improvement according to sex and stress in middle-aged people.
Go to :
 XML Download