

 PDF
PDF Citation
 Print
Print


INTRODUCTION
Malnutrition in hospitalized children is prevalent, and it is associated with increased morbidity and mortality including a higher risk of infections due to poor immune defense, wound healing problems, reduced gut function, longer duration of mechanical ventilation dependency, and longer hospital stay [12].
Previous studies carried out in developed countries have estimated the prevalence of malnutrition in hospitalized children as 12% to 32% [34]. However, data from national studies of pediatric patients conducted to investigate nutritional status using pediatric malnutrition risk screening tools are limited.
Nutrition day (N day), a single day population-based standardized cross-sectional annual survey in hospitals, was implemented and set up by the European Society for Parenteral and Enteral Nutrition in 2006 to assess the nutritional status of hospitalized patients as well as to raise awareness of the nutritional status of patients [56]. However, its application is limited in pediatric patients because the nutritional screening and assessment methods used in the N day survey were mainly designed for adult patients. Consequently, to date, no nationwide studies have been conducted following the concept of N day survey in the pediatric population to investigate the prevalence of malnutrition and nutritional status in hospitalized children.
Therefore, the aim of this study was to evaluate the current nutritional status and the prevalence of malnutrition in hospitalized children in South Korea for the first time according to the N day survey. In particular, this nationwide survey was planned to identify the malnutrition risk and assess the nutritional status of children at the time of admission and during hospital stay.
SUBJECTS AND METHODS
Study design and protocol
This nationwide multicenter cross-sectional study was designed officially by the Nutrition Committee of the Korean Society of Pediatric Gastroenterology, Hepatology, and Nutrition (KSPGHAN) and conducted on the Pediatric N day (pNday) in 23 general and tertiary hospitals in South Korea. A general hospital was defined as a hospital with more than 100 beds for inpatients and 7 or more departments, including internal medicine, general surgery, pediatrics, obstetrics and gynecology, radiology, anesthesiology, and laboratory medicine. A tertiary hospital was defined as a general hospital with more than 500 beds for inpatients, according to the Minister of Health and Welfare in South Korea.
The study protocol, including questionnaires, was systematically developed and finalized by the nutrition committee of KSPGHAN through 7 regular meetings and direct feedback from committee members. The final protocol consisted of 4 sheets: 1) basic hospital information including hospital size, manpower for nutrition care, working process of nutrition support, and nutritional screening and assessment tools; 2) patient information on underlying disease conditions and nutritional status at admission; 3) patient information on nutritional status and nutritional support on pNday; and 4) laboratory test results.
This study was performed on a single day (pNday) on July 12, 2018. Two weeks before the survey, e-mails including the study design and protocol were sent to pediatric gastroenterologists from 23 general and tertiary hospitals who were members of the Nutrition Committee of the KSPGHAN. Pediatric gastroenterologists from each hospital made a complete list of children under 18 years of age who were hospitalized on pNday. Patients who were discharged from hospital on pNday were included, whereas newly admitted patients on pNday were excluded from the list. Neonates and infants admitted in the neonatal intensive care unit (ICU) and nursery room were also excluded. Finally, a total of 872 hospitalized children aged less than 18 years were enrolled in this pNday survey. Demographic, anthropometric, clinical, and laboratory data were collected for all subjects included in the survey.
The study protocol conformed to the ethical guidelines of the World Medical Association Declaration of Helsinki and was approved by the Institutional Review Board (IRB) of Seoul National University Bundang Hospital (IRB number: B-1809-492-107).
Screening and assessment of nutritional status
The risk of malnutrition was assessed using 2 pediatric nutritional screening tools: the Pediatric Yorkhill Malnutrition Score (PYMS) and the Screening Tool Risk on Nutritional Status and Growth (STRONGkids). Nutritional screening using the PYMS included recent weight loss, reduced intake for at least the past week, body mass index (BMI) below the cutoff value, and recent admission or a condition affecting the child's nutritional status; the presence of 2 or more points was used to determine the high-risk group that required a consultation with the nutritional support team (NST). Nutritional screening by the STRONGkids included subjective clinical assessment, presence of high-risk disease, reduced nutritional intake, and weight loss. According to the STRONGkids, pediatric patients with 1–3 points were classified as medium-risk group and 4–5 points as high-risk group. The medium- to high-risk groups were recommended for consultation with the NST for advice on individual nutrition [78].
Nutritional status in the pediatric patients was assessed by thorough history-taking and physical examination; anthropometric measurement including weight and height and/or body composition analysis; and biochemical measurement including hemoglobin and hematocrit levels, white blood cell (WBC), absolute neutrophil and lymphocyte counts, platelet count, serum levels of electrolyte, glucose, protein, albumin, iron panel, ferritin, 25-hydroxyvitamin D, alkaline phosphatase, total bilirubin, aspartate transaminase (AST), alanine transaminase (ALT), γ-glutamyl transferase (GGT), blood urea nitrogen (BUN), creatinine, C-reactive protein, and erythrocyte sedimentation rate (ESR).
For anthropometric measurement, body weight was determined to the nearest 0.1 kg using a calibrated digital scale, and height was measured to the nearest 0.1 cm on a standard height board. BMI was calculated as weight (kg) divided by height squared (m2). Weight was converted to weight-for-age (WFA) z-score for underweight and weight-for-height (WFH) z-score for wasting, and height was converted to height-for-age (HFA) z-score using the least mean squares method, adjusted for age and sex based on the 2017 Korean National Growth Charts, to assess acute and chronic malnutrition [9]. The z-scores from −1 to −1.9 were defined as mild malnutrition, −2 to −2.9 as moderate malnutrition, and −3 or less as severe malnutrition [10].
Statistical analysis
Data are expressed as mean ± standard deviations or number (%). All statistical analyses were performed using the SPSS software (version 25.0; SPSS Inc., Chicago, IL, USA). Data were compared between medical and surgical departments as well as among general ward, hemato-oncology (HO) ward, and the ICU. The Student's t-test or paired t-test and analysis of variance were used for continuous variables, and the χ2 test was used for categorical variables. A P-value less than 0.05 was considered to indicate statistical significance.
RESULTS
Baseline patient characteristics
A total of 872 children (504 boys, 368 girls, mean age 7.5 ± 6.4 years) from 23 hospitals in South Korea were recruited on pNday: 686 (78.7%) from the medical department and 186 (21.3%) from the surgical department. Duration of hospital stay till pNday was 10.9 ± 39.7 days. The number of patients admitted to the general ward were 768 (88.1%), HO ward 48 (5.5%), and the ICU 30 (3.4%). According to the main diagnosis of underlying diseases, infectious diseases were the most common diagnosis (n = 158), followed by gastrointestinal diseases (n = 121), respiratory diseases (n = 120), and neurological diseases (n = 83) (Table 1).
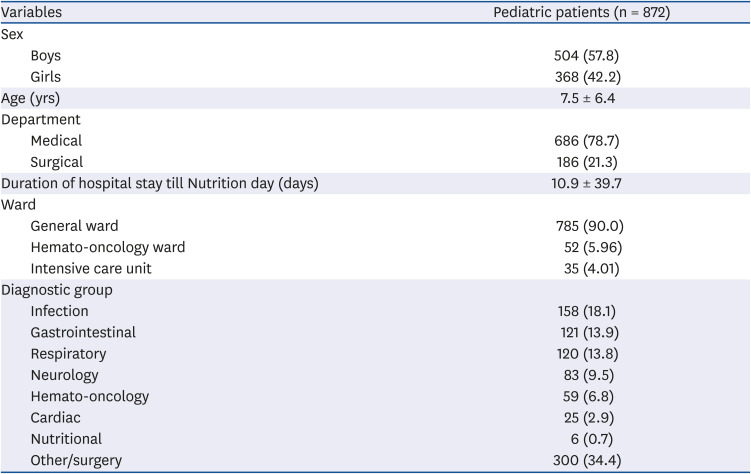
Table 1
Baseline clinical characteristics of hospitalized children
![]()
Prevalence of malnutrition in hospitalized children
At the time of admission, of the total 872 pediatric patients, 17.2% were underweight. Acute malnutrition (wasting) according to WFH z-scores was observed in 20.2% of the children and chronic malnutrition (stunting) based on HFA z-scores in 17.3%. During the hospital stay period till pNday, weight loss was observed in 10.8% of the pediatric patients including a significant weight loss more than 5% of initial body weight in 1.9%. During the aforementioned period, decreased oral intake was observed in 19.6% of the children and 2.9% were fasting.
According to the PYMS, 34.3% and 30% of the patients at admission and on pNday, respectively, were at a high-risk of malnutrition and required consultation with the NST. In addition, when they were screened with the STRONGkids, 55% and 47.1% of the patients at admission and on pNday, respectively, were classified as medium- to high-risk, requiring NST support (Table 2).
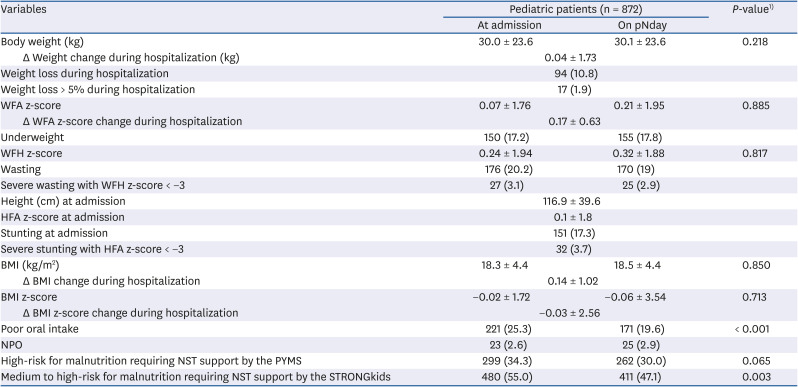
Table 2
Nutritional status of hospitalized pediatric patients at admission and on pNday during hospital stay
Data are reported as mean ± SD for continuous variables and number (%) for categorical variables.
pNday, Pediatric Nutrition Day; WFA, weight-for-age; WFH, weight-for-height; BMI, body mass index; NPO, non per os; NST, nutritional support team; PYMS, Pediatric Yorkhill Malnutrition Score; STRONGkids, Screening Tool Risk on Nutritional Status and Growth.
1)P-values were set at < 0.05 by paired t-test for continuous variables.
![]()
Comparison of nutritional status between medical and surgical departments
The number of pediatric patients admitted to the medical and surgical departments was 686 (384 boys, 302 girls) and 186 (120 boys, 66 girls), respectively. There was a significant difference in age between patients in the medical department (mean 6.4 ± 6.1 years) and those in the surgical department (12.0 ± 5.6 years; P = 0.043). The duration of hospitalization till pNday was 11.7 ± 43.9 days for the medical department patients and 8.2 ± 16.4 days for the surgical department patients (P = 0.087).
There was no difference in WFA z-score at admission between patients in the medical department and those in the surgical department (0.12 ± 1.61 vs. −0.09 ± 2.21; P = 0.126). However, WFA z-score on pNday of patients in the surgical department was significantly lower than that of patients in the medical department (−0.1 ± 2.16 vs. 0.18 ± 1.6; P = 0.085). Changes in WFA z-score during hospitalization till pNday was 0.06 ± 0.52 and −0.01 ± 0.27 among patients in the medical and surgical departments, respectively (P < 0.001). The prevalence of wasting at admission was 19.5% (134/686) in the medical department patients and 22.6% (42/186) in the surgical department patients (P = 0.214). The prevalence of stunting at admission was 18.1% (124/686) in the medical department patients and 14.5% (27/186) in the surgical department patients (P = 0.146) (Table 3).
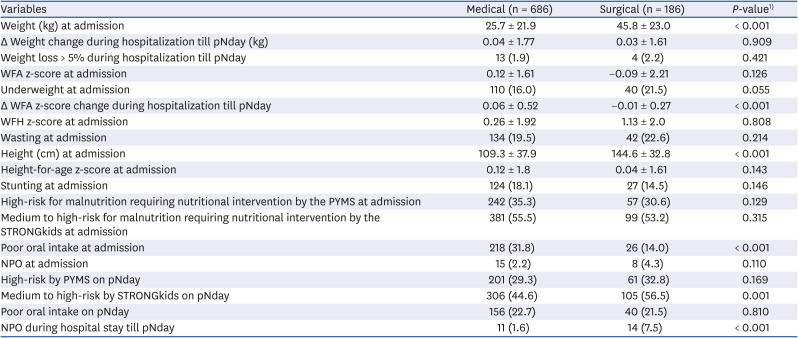
Table 3
Malnutrition status of hospitalized pediatric patients admitted to the medical and surgical departments at admission and on pNday
Data are expressed as mean ± SD for continuous variables and number (%) for categorical variables.
pNday, Pediatric Nutrition Day; WFA, weight-for-age; WFH, weight-for-height; PYMS, Pediatric Yorkhill Malnutrition Score; STRONGkids, Screening Tool Risk on Nutritional Status and Growth; NPO, non per os.
1)P-values were calculated by Student's t-test for continuous variables and the χ2 test for categorical variables.
![]()
BMI at admission and on pNday were significantly different between patients in both departments (both P < 0.001). Changes in BMI during hospital stay till pNday was 0.17 ± 1.11 and 0.02 ± 0.04 among patients in the medical and surgical departments, respectively (P = 0.011). However, there were no significant differences in BMI z-score at admission and on pNday between patients in both departments.
Reduced oral intake was noted in 31.8% (218/686) of children in the medical department and in 14% (26/186) of those in the surgical department, at admission (P < 0.001). Fasting was more prevalent in surgical department patients than in medical department patients, on pNday (7.5% vs. 1.6%; P < 0.001). According to the STRONGkids, 44.6% (306/686) and 56.5% (105/186) of patients in the medical and surgical departments, respectively (P = 0.001) were classified as medium- to high-risk groups, requiring NST support (Table 3).
As for laboratory findings, there were significant differences in hemoglobin and hematocrit levels, lymphocyte count, serum levels of protein, creatinine, calcium and phosphorus, and ESR between patients in the medical and surgical departments (Supplementary Table 1).
Comparison of nutritional status among general ward, HO ward, and the ICU
The number of pediatric patients admitted to the general ward, HO ward, and ICU was 785 (453 boys, 332 girls), 52 (30 boys, 22 girls), and 35 (21 boys, 14 girls), respectively. The duration of hospital stay till pNday was 9.6 ± 40.2, 20.4 ± 24.2, and 27.3 ± 41.4 days in the general ward, HO ward, and ICU, respectively (P = 0.007). Changes in body weight during hospitalization till pNday was 0.1 ± 1.4 kg, −0.8 ± 4.3 kg, and 0.2 ± 1.1 kg in the general ward, HO ward, and ICU, respectively (P = 0.002).
During hospitalization till pNday, significant weight loss of more than 5% of initial body weight was observed in 1.3% (10/785), 7.7% (4/52), and 8.6% (3/35) of patients in the general ward, HO ward, and ICU, respectively (P < 0.001). Changes in WFA z-score during hospitalization till pNday was 0.04 ± 0.4, −0.03 ± 0.77, and −0.03 ± 0.77 in the general ward, HO ward, and ICU, respectively (P = 0.676).
Overall, the prevalence of underweight was 42.9% among patients in the ICU, compared to 15.5% and 25% among patients in the general and HO wards, respectively. WFA z-score in ICU was −2.0 ± 4.1 at admission and −1.8 ± 4.2 on pNday, which was significantly lower than in the general and HO wards (both P < 0.001) (Table 4).
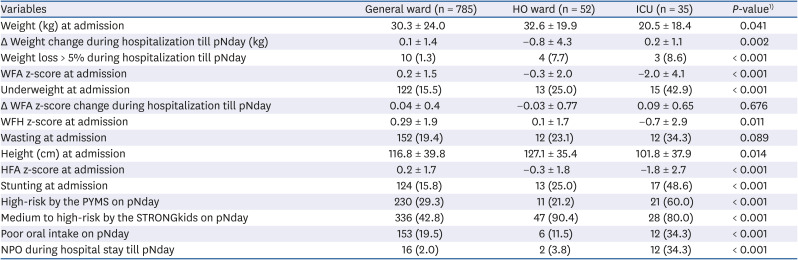
Table 4
Malnutrition status of hospitalized pediatric patients admitted to the general ward, HO ward, and ICU at admission and on pNday
Data are expressed as mean ± SD for continuous variables.
HO, hemato-oncology; ICU, intensive care unit; pNday, Pediatric Nutrition Day; WFA, weight-for-age; WFH, weight-for-height; HFA, height-for-age; NPO, non per os; STRONGkids, Screening Tool Risk on Nutritional Status and Growth; PYMS, Pediatric Yorkhill Malnutrition Score.
1)P-values were calculated by analysis of variance for continuous variables.
![]()
The prevalence of wasting was 19.4% (152/785), 23.1% (12/52), and 34.3% (12/35) among the children in the general ward, HO ward, and ICU, respectively (P = 0.089), whereas the prevalence of stunting was 48.6% in the ICU compared to 25% and 15.8% in the HO and general wards, respectively (P < 0.001).
The BMI z-score among patients in ICU was −1.57 ± 2.80 at admission and −4.5 ± 15.3 on pNday, both of which were significantly lower compared to general ward and HO ward patients (both P < 0.001). Changes in BMI z-score during hospital stay till pNday was −1.9 ± 12.0 in the ICU patients, which was a significant decrease compared to HO ward and general ward patients (P < 0.001). During hospitalization till pNday, 34.3% (12/35) of children in the ICU showed decreased oral intake and 34.3% (12/35) were fasting.
According to the PYMS, the proportion of patients in the ICU at a high-risk for malnutrition requiring a consultation with the NST was 65.7% (23/35) at admission and 60% (21/35) on pNday. In addition, according to the STRONGkids, the proportion of children in the medium- to high-risk groups requiring NST support was 85.7% (30/35) at admission and 80% (28/35) on pNday (Table 4).
For the comparison of laboratory findings at admission and on pNday, WBC, hemoglobin and hematocrit levels, and platelet counts in the HO ward patients were significantly lower than those observed in the other ward patients (P < 0.001). Moreover, serum levels of AST, ALT, ALP, GGT, BUN, and glucose in ICU patients were higher than those observed in the other ward patients (Supplementary Table 2).
DISCUSSION
To our knowledge, this study is the first nationwide cross-sectional N day survey to investigate the nutritional status and the prevalence of malnutrition in hospitalized children at admission and during hospitalization. In total, 23 general and tertiary hospitals in South Korea participated in this nationwide multicenter pNday survey, which was designed and conducted by the Nutrition Committee of the KSPGHAN. Our study revealed that 17.3% of the pediatric patients were underweight. Additionally, wasting (acute malnutrition) and stunting (chronic malnutrition) were observed in 20.2% and 17.3% of patients, respectively, at the time of admission.
The prevalence of acute malnutrition in children admitted to the hospital is considerably high. To date, several studies have investigated the nutritional status of hospitalized children; the reported prevalence of malnutrition in hospitalized children in developed countries including Germany, France, USA, and UK vary between 12% and 32%. [34]. As for developing countries, surveys in Brazil reported a relatively higher prevalence of malnutrition in pediatric inpatients, ranging from 18% to 58%; studies in Turkey have also reported the prevalence of malnutrition to be from 27.7% to 31.8% [1011]. However, no follow-up was made during the hospitalization period in those studies.
Our nationwide multicenter cross-sectional study overcomes this limitation. In our study, during the hospitalization period till pNday, there were significant differences in the WFA z-scores and WFH z-scores, and weight loss was noted in 10.8% of hospitalized children. Although there are socioeconomic, regional, and time differences among different countries, we reported the prevalence of malnutrition at admission similar to that of previous studies; we also found that malnutrition risk was high with significant weight loss even during hospitalization in pediatric patients.
In addition, previous studies on the prevalence of malnutrition among hospitalized children had some limitations because they assessed malnutrition risk by individual measurements [34101112]. Thus, the data from nationwide studies using pediatric malnutrition risk screening tools were limited. Since the criteria for determining malnutrition were different among studies, it was necessary to unify or validate them. The ideal screening tool should consist of objective tools such as anthropometry and assessment of weight change and subjective tools including assessment of disease conditions, food intake, and nutritional history, as the risk of malnutrition may increase during hospitalization, especially in the patients with chronic underlying disease [13]. Recent systematic reviews showed good clinical performance of malnutrition risk screening tools such as the STRONGkids and PYMS in pediatric patients [1415]. Even in Korean children, the aforementioned tools have been validated and found to be effective in screening hospitalized pediatric patients at the risk of malnutrition [16].
Our study is the first national survey to evaluate the risk of malnutrition at the time of admission and on pNday using these 2 well-validated pediatric nutritional screening tools (PYMS and STRONGkids). In this study, the proportion of pediatric patients at risk of malnutrition requiring NST consultation was 34.3% at the time of admission and 30% on pNday using the PYMS and 55% at admission and 47.1% on pNday using the STRONGkids. A significant proportion of inpatients showed poor oral intake as well as significant weight loss. During the hospitalization period, many pediatric patients with malnutrition needed a consultation with the NST and individualized nutritional support. However, according to the results from our national survey, only 4% of hospitalized children at risk for malnutrition were actually referred to the multidisciplinary NST for optimal nutritional support in South Korea.
Furthermore, in our study, the prevalence of malnutrition and nutritional status of pediatric patients were also evaluated and compared between patients admitted to the medical and the surgical departments as well as among patients in the general ward, HO ward, and ICU. When comparing medical and surgical patients, wasting was observed in 19.5% of inpatient children in the medical department compared to 22.6% of surgical department patients. Changes in WFA z-score during hospitalization were significantly higher among patients in the medical department compared to those in the surgical department. Furthermore, reduced oral intake was more frequently observed in 31.8% of children in the medical department compared to 14% in the surgical department. However, on pNday, fasting patients were more prevalent in the surgical department than in the medical department.
Appropriate nutritional management based on the results of nutritional screening and assessment may be important for optimal nutrition for better outcome in both medical and surgical patients. Provision of nutritional support to hospitalized children at risk of malnutrition starts with restoration of oral feeding or nutritional supplements. When enteral nutrition (EN) is indicated, interruptions should be minimized in an effort to achieve nutrition delivery goals by the enteral route. Thus, the stepwise algorithm must be included alongside nutritional support to guide the detection and management of EN tolerance and optimal rate of increase in EN delivery [17]. Considering the fact that many surgical patients fast during hospital stay, if enteral feeding is not indicated, appropriate parenteral nutrition should be considered [18]. Since nutrition status prior to surgery and nutrition rehabilitation after surgery can affect the morbidity and mortality of pediatric patients, adequate formula for enteral or parenteral nutrition should be selected, and individualized optimal nutritional support should be given. Thus, children at a high nutritional risk should be provided with guidance for optimal nutrition during hospital stay [19].
When comparing nutritional status among the patients in the general ward, HO ward, and ICU in our study, a significantly higher proportion of pediatric patients in the ICU showed poor oral intake and fasting during hospital stay. Moreover, length of hospital stay was the longest and the proportion of patients who showed significant weight loss during hospitalization was the highest among children admitted to the ICU. Additionally, the z-scores of WFA, WFH, HFA, and BMI were the lowest in patients in the ICU compared to those in other wards. Therefore, pediatric patients in the ICU are at a higher risk of malnutrition than those in the general and HO wards and may require additional intensive screening and assessment for malnutrition risk and nutritional interventions during ICU stay.
Our study has some limitations. Frist, this study did not recruit all general and tertiary hospitals in South Korea. Hence, it is debatable whether the findings of our survey are generalizable to the nutritional status of the entire nation. However, given that this is the first attempt of a nationwide pNday survey, our findings might inform further studies. Second, this study did not contain the exact reasons for reduced nutritional intake and weight changes during the hospitalization; in addition, detailed methods of nutrition support and its accessibility to inpatients are missing. Follow-up studies focusing on these issues may be required.
In conclusion, this first nationwide multicenter cross-sectional pNday survey in South Korea revealed that malnutrition was very prevalent at admission and even during hospitalization in pediatric patients, and a significant portion of hospitalized children experienced poor oral intake and weight loss during hospital stay. Nevertheless, the rate of consultation with the NST for individualized nutritional support was only 4% against clinical needs, and subsequent nutritional interventions were poorly performed. To improve the nutritional status of hospitalized children during hospital stay, it is essential to screen and identify all children at a risk of malnutrition and to refer all malnourished children to the multidisciplinary NST so that appropriate nutritional interventions can be initiated promptly.
 XML Download