INTRODUCTION
The global prevalence of metabolic syndrome (MetS) is really unknown, but it has been estimated from the incidence of diabetes mellitus (DM) and obesity. MetS is about 3 times more common than diabetes [
1]; and worldwide, a quarter of the people is affected by the syndrome [
2]. Dietary patterns considerably affect the development of chronic diseases. It has been estimated that a high consumption of sugar-sweetened beverages (SSBs) increases 20% the risk of MetS and 18% the risk of DM [
3]. Although World Health Organization recommends that ingest of free sugar should not exceed the 10% of the total caloric daily ingest [
4], worldwide daily intake of sugar varies between 5–27.8% [
567].
An adequate diagnostic and treatment for MetS requires a better understanding of the physiopathology. Experimental environments with rodents exposed to an enriched sweet diet have been proposed to mimic abnormalities attributed to MetS. Rodents exposed to sucrose solution (SS) have developed hypertension, dyslipidemia, dysglycemia, insulinemia, higher levels of adiposity, and in some cases changes in body weight (BW) [
8910]. Also, cognitive deficiencies have been reported [
1112]. Behavioral, metabolic and anthropometric changes have been reported in rodents that consumed SS [
910111213]. However, other anthropometric measures, such as body mass index (BMI) and percentage of adiposity; as well as behavioral patterns of liquid and chow intake have not been fully explored in rodents exposed to high SS. Additionally, these multi-organic effects have not been compared with other carbohydrate solutions in comparable concentrations.
Honey is a natural sweetener composed mainly of glucose, fructose and sucrose [
14]. Its use as a substitute of sucrose has been widely recommended. The 6-week exposure to 10% honey, 8% sucrose and 8% mixed sugars diets showed similar food intake between diets, but significantly lower weight gain in honey-fed rats [
15]. While the long-term effects of a diet containing 10% honey resulted in less weight gain, adiposity, hemoglobin A1c levels and higher high density lipoprotein-cholesterol (HDL-C), than sucrose [
16]. In rats exposed to 20% carbohydrate diet from honey, Nemoseck
et al. [
17] showed that honey caused less food ingest, weight gain, adiposity and less triglycerides levels than sucrose. Additionally, honey has proved behavioral effects, as less anxiety and better spatial memory, compared to sucrose [
18].
Sweet-tasting substances have different tastes and preference for sweeteners could be conditioned not only by its palatability, but also by its post-oral nutritive effects [
19]. These factors could affect its consumption and with that, its effects in the organism. Therefore, we hypothesized that the effects of the free access to the consumption of different sweet isoenergetic solutions would be different from that of sucrose. The aim of this research was to evaluate the feeding pattern of intake, biochemical, anthropometric and histological effects of the exposure to sucrose, honey and glucose/fructose solutions (SS, HS and GFS) at 30%.
Go to :

SUBJECTS AND METHODS
Subjects and habitat
Male Wistar rats, experimentally naïve and recently weaned (n = 30) were obtained in the vivarium of the Instituto de Investigaciones en Comportamiento Alimentario y Nutrición, Mexico. In the same place, the experiment was carried out. Three experimental groups (n = 10) were assigned by the matched group design based on the BW. The experiment was approved by the Ethics Committee of Centro de Estudios e Investigaciones en Comportamiento, University of Guadalajara (CUCBA/CEIC/CE/001/2020). All experimental procedures were conducted in accordance with the guidelines stipulated by the National Institutes of Health guide for the care and use of Laboratory animals (NIH Publications No. 8023, revised 1978). The 21 days old rats (weight of 70–90 g) were housed individually in acrylic cages (27 × 37 × 15 cm) with hardwood chips bedding and covered by a stainless steel cage top. The bedding was changed every third day or even daily if it was necessary. Animals were maintained on a 12:12 light/dark cycle (lights on at 07:00), in a colony room with climate controlled (23 ± 2°C; relative humidity of 45%; ventilation rate 15 air changes per hour).
Experimental diets and administration procedure
Rats were exposed to 3 ad libitum isoenergetic diet conditions with Purina® Rodent Laboratory Chow 5001 (standard diet); composition of 23% protein, 4.5% fat, 6% fiber, 46.5% carbohydrates, 12% humidity and 8% minerals and different liquid access for each group. Diet exposure took along 14 consecutively weeks.
• HS: standard diet + 30% multiflora pure HS (composition of 32.42 g/100 g glucose, 47.02 g/100 g fructose). To obtain a 30% concentration of sugars solution, accordance with the content of these in honey, 37.76 g of honey for every 100 mL of solution were used. Multiflora honey bee was purchased through a local producer in Zapotiltic, Jalisco, Mexico.
• SS: standard diet + 30% SS. The preparation was made using commercial refined sugar (Zulka®, Culiacán Rosales, Sinaloa, Mexico), mixed on a weight/volume basis (30 g of sugar for every 100 mL of solution).
• GFS: standard diet + 30% mixed glucose and fructose solution. The concentration of mixed sugars for this solution was comparable to the content of these in honey. For that, 11.35 g of glucose and 18.65 g of fructose for every 100 mL of solution were used. An anhydrous glucose and fructose analytical standard were used.
The solutions were prepared using purified water and were available instead of water in 240 mL plastic bottles with stainless-steel drinking spouts. The drinking bottles were sanitized and solution was replaced every 24 h at 9:00. All solutions were prepared every third day and stored at 3°C until 1 h before the access. Chow and liquid consumption over 23 h for each subject was recorded daily at 8:00 h (the missing hour was used to weigh the food, sanitize and fill drinking bottles).
Feeding pattern
Food consumption was determined with the difference of weight measured with a precision digital balance (AND GX 2000; A&D Company, San Jose, CA, USA); and liquid ingest was measured by direct observation of the bottle's measurement scale. Feed efficiency was used to determine how kilocalories (kcal) ingested increase BW, as follow: kcal/g of weight gain. Weight gain was obtained with the subtraction of the initial BW to the final BW [
20]. Values were expressed on milliliters of liquid and grams for chow. Total kcal consumed were determined with the sum of food and liquid.
Anthropometric measures
BW was measured using a precision digital balance (AND GX 2000; A&D Company, San Jose, CA, USA); abdominal circumference (AC) and craniocaudal length was assessed using a plastic measuring tape with an accuracy of 0.1 cm, as well as a homemade plastic restriction device to avoid anesthesia. The measurements were made every week.
To identify obesity, BMI was calculated as the BW (g)/length
2 (cm
2) [
13] and adiposity index (%) was calculated as (total body fat/final BW) × 100; total body fat was calculated with the sum of subcutaneous, visceral and epididymal AT weights, after the sacrifice [
21]. As a predictor of body fat mass
in vivo, the AC was calculated on the most prominent zone of the abdomen [
22], and the results were correlated with the weight of AT.
Euthanasia and dissection
All the rats were fasted and sacrificed rapidly by decapitation under brief CO2 narcosis (Grupo INFRA®;Estado de México, México); immediately blood sample was collected and bodies were dissected; AT (subcutaneous, visceral, epididymal), heart, kidneys, lungs, liver and pancreas were isolated and weighed. The liver was placed in 10% formalin solution for histopathological analysis.
Biochemical analysis
Blood sample was collected in tubes Vacutest® (KIMA, Arzegrande, Italy), incubated at 37°C for 30 min and centrifuging at 2,500 rpm × 10 min. Serum analysis for glucose and lipid profile were realized in a specialized laboratory using a dry chemistry technique with a VITROS® 250 automatic chemistry analyzer and Micro Slides kits of the same brand (Ortho-Clinical Diagnostics, Raritan, NJ, USA).
Insulin and leptin were measured using rats ELISA kits (Sigma-Aldrich, Co., St. Louis, MO, USA). For insulin concentration, serum samples were diluted with specific sample kit diluent buffer (1:2 dilutions) and the assay was carried out in accordance to the certificate of analysis. Absorbance was read at 450 nm on a xMark™ Microplate Absorbance Spectrophotometer (Bio-Rad®, Hercules, CA, USA). Concentrations for each sample were determined as mean absorbance using a standard curve of samples (0–300 μIU/mL). For leptin concentration, serum samples were diluted with specific sample kit diluent buffer (1:3 dilutions) and the assay was carried out in accordance to the certificate of analysis. Absorbance was read at 450 nm on a xMark™ Microplate Absorbance Spectrophotometer (Bio-Rad®). Concentrations for each sample were determined as mean absorbance using a standard curve of samples (0–8,000 pg/mL).
The atherogenic risk index (ARI) was calculated from the TC levels and the HDL fraction as previously reported [
23], thus:
The Homeostatic Model As sessment (HOMA) for insulin resistance (HOMA2-IR) and β-cell function percent (HOMA2-%B) were calculated using HOMA-2 calculator software (Available at
https://www.dtu.ox.ac.uk/homacalculator, Oxford University) [
24].
Histological examination
The analysis for cellular damage and fatty degeneration was performed in the Morphology Laboratory of the Centro Universitario del Sur. Immediately after removal, liver tissues were fixed in 10% formalin for 8 h. The sectioned tissues were dehydrated in 96% ethyl alcohol 4 times along 5 h each; then were embedded in 2 recipients of xylol along 3 h each. Finally, the tissues were embedded in paraffin, sectioned (4 µm), stained with hematoxylin and eosin and observed under a Leica DME microscope (Leica Microsystems Inc., Wetzlar, Germany).
Statistical analysis
Statistical analyses were performed using Statistical Package for the Social Sciences version 24 (IBM
® SPSS Statistics, Armonk, NY, USA). Normality and homoscedasticity of data were evaluated. Later, one-way analysis of variance with Tukey's
post hoc analyses were used to determine differences among variables and groups. An α level of
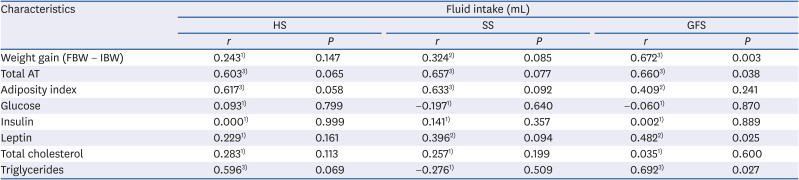
P < 0.05 was considered statistically significant. Data are expressed as means ± standard deviation. The degree of association between fluid intake and anthropometric and biochemical parameters was analyzed through the calculation of Pearson's correlation coefficient for quantitative variables. The interpretation of the correlation size was considered as reported by Mukaka [
25].
Go to :
DISCUSSION
The consumption of SSBs has been increased in parallel with the incidence of obesity, MetS and DM [
327]. Alternative dietary products are necessary to reduce these side effects; replacing sucrose for other carbohydrates could mitigate the adverse effects of its high glycemic index (GI) [
16]. Previously, fructose has been considered safe because it does not raise blood sugar fast [
28] and natural sweeteners such as honey has a lower GI and bioactive compounds [
2930]. However, it is necessary to consider that the effect in the organism caused by the carbohydrates is dependent on the amount of consumption. For example, the development of non-communicable diseases is related with the access to palatable food that increases its consumption beyond the organism needs by the activation of brain reward circuitry that generates a compulsive eating behavior [
31].
Sweetened carbohydrate solutions are greatly consumed and preferred by experimental rats [
32], inclusive over water [
33]. Sclafani and Clyne [
32] referred that rodents increases its hedonic reaction (i.e., intake, lick rates, preference) to sweet solutions when the concentration increases and its reaction is modified depending on the type of carbohydrate. For our interest, most experiments with a 30% SS have used this concentration to develop an animal model of MetS and DM [
9103435]; but none of these have been interested in associating the amount of ingested solution with the physiological effects. In this sense, our objective was not to evaluate the acceptance, since many previous reports have demonstrated that rats voluntary consumeSS, GFS and HS in different concentrations [
3234363738]; instead the interest was for the multiple effects derived from the consumption of different sweet isoenergetic, high concentrated solutions. Thus, this study sought to determine the feeding pattern of intake, biochemical, anthropometric and histological effects of the exposure to different 30% carbohydrate solutions. Overall, interesting differences were found in the rats exposed to the consumption of HS, SS and GFS.
Similar to the reported by Chepulis [
15], Chepulis
et al. [
18] and Chepulis and Starkey [
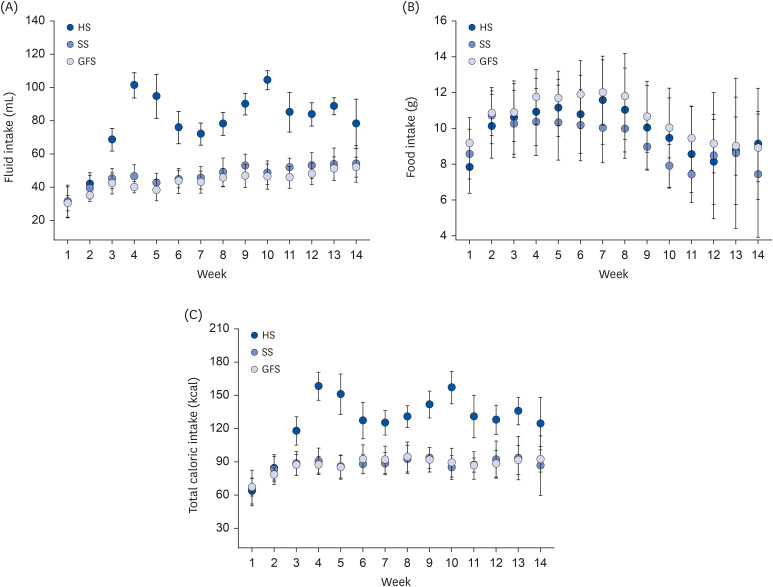
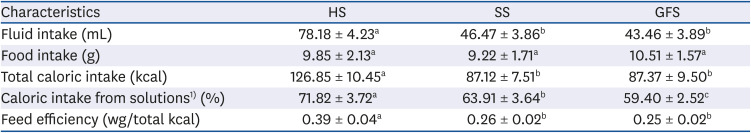
16] in rats exposed to honey for short and long-term; food intake among groups was similar. Whilst, for fluid intake, HS group consumed significantly (
P = 0.000) higher liquid and higher total caloric intake (
P = 0.000). A regular feeding pattern was observed for the amount of fluid and food intake by SS and GFS, while an irregular pattern was observed for fluid intake in HS, probably due to the organoleptic properties of honey. Liquid calories from sugar solution are less satiating than solid calories and this stimulates an overconsumption [
39]; in our study, although the liquid access was restrained to a sweet beverage, all the rats consumed more than their physiological need, and more of the 50% of the total caloric intake was obtained from the solution. The explanations could be the following: fructose intake has been associated with activation of reward processing that could stimulate eating behavior and due to the less satiating effect observed with the ingestion of fructose [
40]; while sucrose has been related with addiction-like profile due to the stimulation of similar neural circuitry to drugs rewards [
31]. The 42% higher solution intake by the HS could be related to these mechanisms; since fructose was the most contained carbohydrate in honey. Nevertheless, the GFS that had an equivalent content of glucose and fructose of the honey (to distinguish the effect of other compounds presented in honey), consumed significantly less fluid (
P = 0.000). This amount of intake seems not be related with the mechanism proposed previously. We suggest that probably the other compounds in honey, as minerals and polyphenols, could determine and modify its palatability and increase its consumption. Besides that, neither low or high concentrations of fructose alone have been preferred by rats [
32] and fructose have generated minimal post-ingestive reinforcing effects [
41].
Metabolic effects related to honey have reported an improvement of HDL-C and glucose concentration [
151637]. In albino rats exposed to honey (1 mL of honey in 10 mL water) along 22 weeks, Alagwu
et al. [
37] reported a higher HDL-C, VLDL and triglycerides concentration, and lower TC and low density lipoprotein (LDL) than control group. In rats exposed to 10% honey diet
ad libitum for 6 weeks, Chepulis [
15] observed lower HbA1c, TC, HDL-C, triglycerides and higher LDL concentration, compared to sucrose group. While, in rats exposed to 10% honey
ad libitum for 52 weeks, Chepulis and Starkey [
16] found that, compared to sucrose, honey feed rats had lower LDL, triglycerides and HbA1c; and higher HDL-C and TC. Nemoseck
et al. [
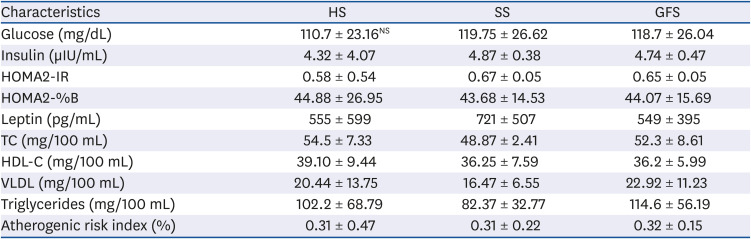
17] reported that rats exposed to 20% honey along 33 days, compared to sucrose, developed lower glucose and triglycerides levels, similar insulin and HDL-C levels and higher TC. In our experiment, non-statistical differences were observed in biochemical analysis among groups (
P > 0.407). Nevertheless, means were different in some cases (
Table 2). Honey-feed rats developed in average 8% higher TC and HDL-C, 24% higher VLDL and triglycerides; compared to SS group and similar to glucose/fructose feed group. Similar to our results, Busserolles
et al. [
42] reported that male Wistar rats feed with honey along 2 weeks developed less triglycerides levels than fructose feed group. As has been explained by Hannou
et al. [
43], the alterations developed in these groups could be attributed to the fructose content of both GFS solution and of the honey. Probably, the differences between previous experiments could be related with the period of time and the particular biochemical characteristics of each honey.
Importantly, in spite of that HS group consumed more liquid than the other groups; this group has an 8% higher HDL-C level (
P > 0.680) and a 7% lower glucose concentration (
P > 0.730). The increased in HDL-C fraction has been related with antioxidant composition of honey [
37]. While, the lower glucose level could be attributed to less prolonged postprandial hyperglycemia associated with a lower GI. Otherwise, fructose content of the honey has been related with its effects on glycaemia trough the following mechanisms: the higher fructose content of the honey does not stimulate insulin secretion [
44]; the stimulation of glucokinase mediated by fructose affects the storage of glucose as glycogen in the liver and the stimulation of insulin segregation [
45]. However, our findings do not fully agree with this perspective as has also been mentioned by Ramli
et al. [
46], since the GFS group was equivalent in the amount of glucose and fructose to the content in honey and the effects in this group were different from honey. Other perspectives suggest that honey increases levels of adiponectin, a hormone that regulates glucose metabolism [
46] and honey reduces glucose levels through inhibition of α-amylase and α-glycosidase enzymes activities [
47]. It is probably that antioxidants [
4648], oligosaccharides [
49] and minerals such as chromium, copper and zinc present in honey [
48] could be the responsible of these effects.
Leptin concentration was in average similar among HS and GFS, but 30% in average higher for SS (
P > 0.883); these findings are in accordance with previous reports [
17]. As leptin production by adipocytes is regulated by insulin-mediated glucose metabolism, and the ingestion of fructose does not stimulate insulin segregation [
50]; the less concentration of insulin and leptin observed in HS and GFS could be explained by the fructose metabolism. In this sense, the more food intake by GFS could be partially related with reduction in anorexigenic signal of leptin. In spite of we did not have a control group, normal values in Wistar rats measured at ages similar to ours, are dissimilar to those shown in experimental subjects. Glucose values have been reported between 76–98 mg/dL [
910], insulin 5–10 μIU/mL [
3536], triglycerides 74–150 mg/dL [
1036], TC 49 mg/dL [
36] and HDL 65–124 mg/dL [
1035].
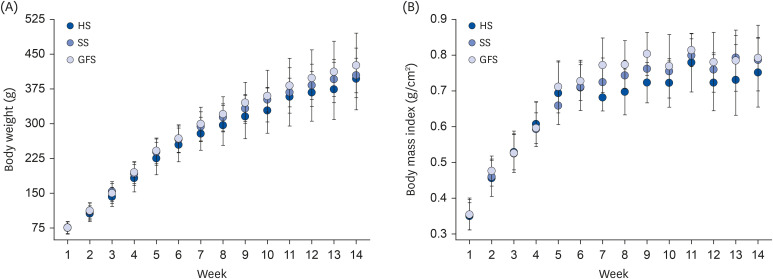
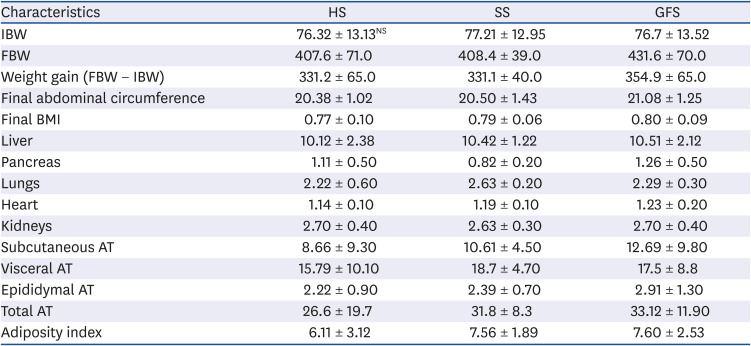
Rats exposed to honey for short and long-term developed less weight gain than rats exposed to sucrose based diet [
15161718]. However, as seen in our experiment non-statistical differences were observed in anthropometric measures among groups; rats exposed to honey and sucrose developed 7% less weight gain and 3% less AC than GFS. In spite of this minimal differences, honey feed group developed 18% less total AT and adiposity index. The greatest percentage of weight gain, AC, BMI, AT and adiposity index was developed by GFS. Fructose intake could be responsible of these changes due to the hepatic
de novo lipogenesis stimulation [
28]. Similar to our findings have been mentioned by Chepulis and Starkey [
16] in rats fed 60% carbohydrate concentration from honey, which exhibited lower weight gain than rats feed mixed sugars in equivalent amount and Nemoseck
et al. [
17] that exposed rats to 20% honey along 33 days and observed significantly lower fat pad compared to sucrose. According to the adiposity index reported by Leopoldo
et al. [
21], from the 3 groups no rats had a normal weight; some developed overweight, but most developed obesity. The normal BMI in male adult Wistar rats range between 0.45 and 0.68 g/cm
2 [
13]; in our experiment the 3 groups developed a BMI associated with obesity. While, the AC was similar among groups and agrees with the 20.7 ± 1.4 cm reported by Novelli
et al. [
13] in their group exposed to 30% SS. Also, the AC was positive correlated with the total AT in the 3 groups (Anthropometric measures of RESULTS); according to Gerbaix
et al. [
22] these data is useful as an anthropometric predictor of obesity
in vivo. Taken together, these anthropometric measurements, to our knowledge, have not been previously evaluated and such as they are indicators of the body composition these could be useful additionally for the establishment of diagnosis criteria for MetS in rodents.
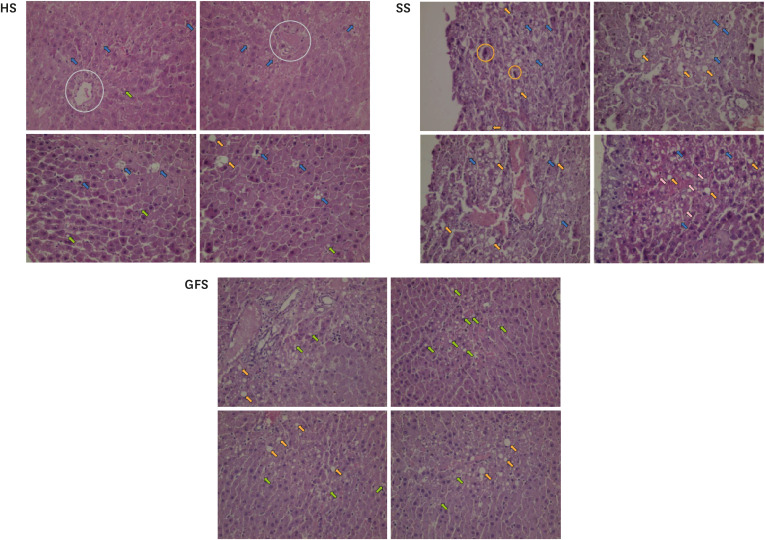
In spite of the relation between SSBs consumption with fatty liver is still controversial [
43], we evaluated the impact of free access to 3 different sweetened solutions with the liver tissue damage and the development of hepatic steatosis. As has been mentioned in the results, all the groups developed different signs related with fatty liver, such as the presence of fat vacuoles. However, the highest damage was observed in all subjects from SS. While, it is important to note that for HS and GFS, only 3 subjects of each group developed important tissue damage, while for the rest of subjects, minimus changes or normal estructure were observed (data not shown). From the HS, one of the subjects with tissue damage was the rat that individually had the highest solution consumption (average of 85 mL/day), while the other 2 rats had a consumption similar to the group average. For the GFS, the 3 subjects affected had a solution consumption nearly to the group average. We suggest that individual characteristics of each subject made them more prone to damage, since the amount of consumption seems not to have been the trigger in most cases. While the greatest biochemical and anthropometric alterations were observed in GFS, the greatest histological damage was observed in all subjects from SS. In contrast to the reported by Sánchez-Lozada
et al. [
51] and Sheludiakova
et al. [
39]; in our experiment, sucrose led to greater fat deposits than free fructose and glucose. However, although the solution was consumed freely and the average of consumption for both groups was similar, we suggest that a possible explanation is that sucrose could lead to steatosis earlier than “free” glucose/fructose. For the case of honey; previously, Ajibola
et al. [
52] reported that rats exposed to a low (20% of the diet v/w) and a high dose (50% of the diet v/w) of natural honey along 10-weeks showed normal cytology of liver. In our experiment, few rats developed multiple microvacuoles; these histologic features have been related with higher grade of steatosis and damage [
26]. Nevertheless, if we consider the high solution consumption expressed by all the HS; the honey really exerted a tissue protection in most of the subjects. However, this assertion needs to be proven.
Although previous reports support the idea that honey could be useful as a substitute for other carbohydrate sources and as an adjunct in reducing the risk of cardiovascular diseases, we suggest that these statements should not promote overconsumption of honey, due to that, as we have mentioned, this sweetener could generate adverse biochemical and anthropometric effects such as those developed by sucrose and fructose. This argument requires a special attention, since people could perceive these products as healthy and exceed the consumption.
This experimental method has some limitations that must be recognized. Diverse types of honey can exhibit distinct results due to different chemical composition [
48]. Humans perceive fructose sweeter than sucrose, while rodents perceive the opposite [
19]. The carbohydrate concentration used in this experiment probably exceeds the average concentration for the most consumed sweetened beverages in people. The caloric intake from solutions in the 3 groups exceeds the consumption reported in humans [
567]. In these controlled environments, rats only have access to a palatable food found in the solution, in contrast, humans are exposed to multiple solid and liquid palatable foods. Nevertheless, an important issue is that in both rats and humans, similar brain regions are activated by palatable food intake [
53].
Studies about the multiple effects of sugar beverages could help to understand the developmental mechanism and the treatment of diseases such as obesity, MetS and DM. Our results allow us to demonstrate how different types of carbohydrates, including those most commonly consumed, trigger different feeding pattern, biochemical and anthropometric effects. This experiment demonstrates the relevance and interest in measuring the amount of consumption of a SSBs; since other animal experiments have not mentioned and evaluated the impact of consumption in the development of diseases.
In conclusion, the rodents showed a significantly higher consumption of HS, despite this, there were no significant differences in biochemical, anthropometric and histological measures compared to other isoenergetic sweeteners. In high consumption, honey caused symptoms of illness similar to those seen with other carbohydrates.
Go to :


 PDF
PDF Citation
 Print
Print


 XML Download