

 PDF
PDF Citation
 Print
Print


INTRODUCTION
Muscle loss has been reported to progress gradually after the age of 50 years and accelerate after the age of 70 years [1]. Age-related loss of skeletal muscle mass has been associated with health problems such as decreased physical activity [2], increased risk of fractures and falls [3], and mortality [4]. The Hertfordshire Cohort Study in the United Kingdom estimated that the health and social care costs of skeletal muscle weakness are approximately £2.5 billion per year, and that its economic burden will continue to increase [5]. In particular, muscle loss progresses gradually over a period of several years, which provides an opportunity for active prevention and management at the individual and national levels in the middle-aged population [6].
Muscle synthesis can be influenced by dietary habits and obesity [6]; it can especially be affected by protein and amino acid intakes. Leucine, a branched-chain amino acid (BCAA), has been reported to play a role in promoting the synthesis of muscle proteins [78]. According to a meta-analysis, the muscle protein fractional synthetic rate increased in people receiving leucine supplementation [9]. In contrast, obesity is associated with mitochondrial dysfunction in the muscles, which can lead to decreased muscle protein synthesis [10111213]. In addition, obesity-associated insulin resistance can promote muscle protein catabolism that results in muscle loss [14]. The United States National Health and Nutrition Examination Survey study analyzed the association between dietary protein intake and skeletal muscle mass index (SMI) by categorizing participants aged over 50 years into obesity and non-obesity groups [15]. The results showed that high dietary protein intake was associated with high SMI in the non-obesity group; however, there was no significant association in the obesity group. Thus, we hypothesized that the association between amino acid intake levels and SMI may vary depending on the weight status, which influences muscle synthesis.
Most previous studies analyzing the effect of dietary amino acid intakes on muscle mass have been conducted in the United States and Europe; however, limited studies have been conducted in the Korean population, with relatively low protein intake levels compared to the Western population [161718]. In addition, previous studies were primarily focused on the elderly population, and they showed insufficient consideration regarding potential confounding factors and effect modifiers of the association between dietary protein intake and sarcopenia [19]. Protein synthesis rate varies with aging; thus, it is assumed that amino acid intakes may have more beneficial effects in the middle-aged and pre-elderly adults than in the elderly [20].
Therefore, this study aimed to analyze the association between dietary BCAA intake and SMI in the middle-aged and pre-elderly adults aged 50–64 years in Korea, while considering the effect of obesity status, which may be a potential effect modifier of this association.
Go to : 
SUBJECTS AND METHODS
Study population
The Korea National Health and Nutrition Examination Survey (KNHANES), a nationwide representative cross-sectional study was initiated in 1998 (I), and has been regularly conducted thereafter. It was initially conducted at intervals of 3–4 years; from 2007, an annual survey with a rolling sample that is generated every 3 years to avoid seasonal bias has been used. The KNHANES includes health interviews, health examinations, and nutrition surveys. A detailed description of the data collection procedures and survey design are described in a previous study [21].
This study analyzed data from the 2008–2011 KNHANES, during which appendicular skeletal muscle mass (ASM) variables were evaluated. A total of 37,753 participants completed the survey, and the exclusion criteria were as follows: 1) < 50 or > 65 years of age (n = 30,441); 2) total energy intake < 500 or > 5,000 kcal/day (n = 809) [22]; 3) diagnosis of cancer or cardiovascular disease (n = 512); and 4) missing dietary amino acid and lean body mass variables (n = 2,025). Finally, 3,966 participants were included in this study, and all of them provided written informed consent. The study followed the guidelines of the Declaration of Helsinki and was approved by the Institutional Review Board of the Korea Centers for Disease Control and Prevention (approval No. 2008-04EXP-01-C, 2009-01CON-03-2C, 2010-02CON-21-C, and 2011-02CON-06-C).
Demographic and lifestyle information
Data on health behavior, such as smoking, physical activity, and alcohol consumption, were collected via a self-administered questionnaire, and demographic information on sex, age, income, and education level was collected through interviews [21]. Education level was classified as less than high school graduation or as high school graduation or higher, and income level was divided into 4 quartiles based on the equalized household income. Information on the frequency and duration of high intensity, moderate, or walking levels of physical activity were estimated per week. Then, metabolic equivalents were calculated by multiplying weighted values according to the intensity of physical activity [23] and dividing them into tertiles. Smoking status was classified as non-smoker and current smoker. Alcohol consumption status was defined as non-drinker and drinker.
Anthropometry and dietary assessment
Anthropometric measurements of participants with shoes and socks removed were taken by trained investigators. Height and weight were measured in an upright position, using a standardized height and weight scale. Waist circumference (WC) was measured at the midpoint between the bottom of the least palpable rib and the top of the iliac crest using a stretch-resistant tape. Body mass index was calculated by dividing the body weight (kg) by the squared height (m2). Obesity status was classified as non-obesity (< 25 kg/m2) and obesity (≥ 25 kg/m2), and abdominal obesity was defined as WC ≥ 90 cm in men and ≥ 80 cm in women based on the World Health Organization criteria for Asian populations [24].
For dietary information, 24-hour recall data were used. Trained interviewers surveyed dietary behavior, and to determine food and beverage intakes, supplementary tools such as measuring cups, measuring spoons, and a tape measure were used to improve recall. The data were converted into individual food intakes using the food recipe database [25], and the food composition table [26] was used to calculate the nutrient intake. In this study, the total energy intake was analyzed.
A total of 2,071 food items were selected from the 24-hour recall data. A dietary amino acid database was constructed using the Computer Aided Nutritional analysis program (CAN-Pro) [27]. The detailed process of the development of the amino acid database has been explained in a previous study [28]. The daily individual amino acids intake (g/day) was calculated by multiplying the amino acid content per 100 g of food by the individual daily food intake. Additionally, we analyzed the intake levels of BCAA, including leucine, isoleucine, and valine [2930].
Calculation of SMI
ASM was calculated by excluding the bone and fat weights from the arm and leg weights measured using dual energy X-ray absorptiometry. SMI was calculated by dividing the ASM by body weight and multiplying the result by 100 [31].
Statistical analysis
Stratification variables and a primary sampling unit were used, considering the complex sampling design of the KNHANES. Appropriate weights for the health interview, health examinations, and nutrition surveys were used. Multivariable linear regression analysis was used to examine the association between BCAA intake and SMI, and the effect modifiers and potential confounding factors that could affect this association were selected through a preliminary analysis and literature search [151632]. Nutrient intake levels were adjusted for total energy intake using the residual method [33]. We built 3 covariate models: model 1 was unadjusted; model 2 was adjusted for sex, age, household income, education level, alcohol consumption, smoking status, and physical activity; and model 3 was additionally adjusted for intake levels of non-BCAA. Statistical significance was indicated by α = 0.05 using 2-tailed tests; statistical analysis was performed using Statistical Analysis System ver. 9.4 (SAS Institute, Cary, NC, USA).
Go to :
RESULTS
General characteristics of participants by obesity status
Characteristics of the study participants according to obesity status are presented in Table 1. In the non-obesity and obesity groups, the proportions of men were 40.9% and 42.0% and the average ages were 56.8 ± 0.09 and 56.8 ± 0.11 years, respectively. More than half of the participants reported that they consumed alcohol, while the current smoking rates were very low (15–19%). The average levels of SMI were 28.4 ± 0.08% and 26.6 ± 0.11% in the non-obesity and obesity groups, respectively.
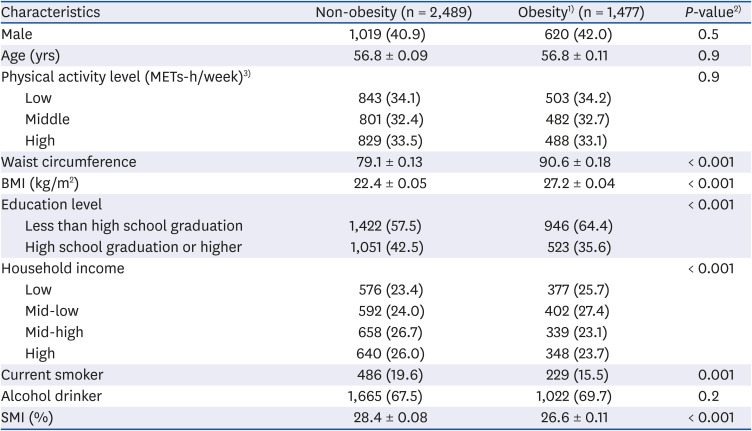
Table 1
Characteristics of the participants according to obesity status
Values are expressed as mean ± SE or number (%).
METs-h/week, metabolic equivalents-hours per week; SMI, skeletal muscle mass index; BMI, body mass index.
1)Obesity status was categorized as follows: non-obesity, BMI < 25 kg/m2; obesity, BMI ≥ 25 kg/m2.
2)P-values were derived from the χ2 test for categorical variables and from a general linear regression analysis for continuous variables.
3)Physical activity was categorized into 3 groups, according to the tertiles of METs-h/week.
![]()
BCAA intake levels by obesity/abdominal obesity status
Table 2 presents the intake levels of dietary BCAA according to obesity and abdominal obesity status. There were no significant differences in dietary intake levels of BCAA, isoleucine, leucine, and valine according to obesity and abdominal obesity status (P > 0.05).
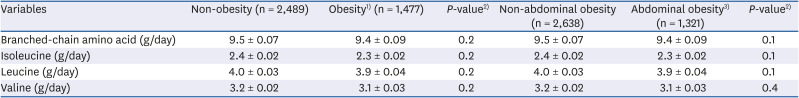
Table 2
Energy-adjusted intake levels of branched-chain amino acids according to obesity/abdominal obesity status
Values are expressed as mean ± SE.
BMI, body mass index.
1)Obesity status was categorized as follows: non-obesity, BMI < 25 kg/m2; obesity, BMI ≥ 25 kg/m2.
2)P-values were derived from a general linear regression analysis.
3)Abdominal obesity was defined as waist circumference ≥ 80 cm in women and ≥ 90 cm in men.
![]()
Association between BCAA intake levels and SMI by obesity status
The associations between dietary BCAA intakes and SMI were analyzed according to obesity status and the results are presented in Table 3. Intakes of BCAA (P = 0.6), isoleucine (P = 0.6), and leucine (P = 0.8) were not significantly associated with SMI in the obesity group. Conversely, we observed positive associations of BCAA (P = 0.02), isoleucine (P = 0.03), and leucine (P = 0.005) intakes with SMI in the non-obesity group, and these associations were stronger and significant. Valine intake was not significantly associated with SMI, regardless of obesity status.
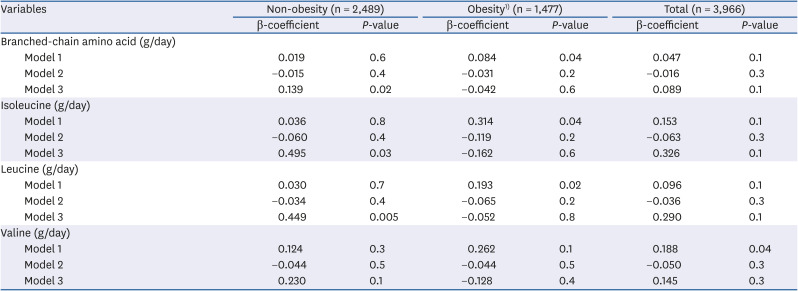
Table 3
Multiple regression analysis for the association between energy-adjusted intake levels of branched-chain amino acids and skeletal muscle mass index stratified by obesity status
Data calculated using 3 following models: model 1, unadjusted; model 2, adjusted for sex, age, household income, education level, alcohol consumption, smoking status, and physical activity; model 3, additionally adjusted for intake levels of non-branched chain amino acids.
BMI, body mass index.
1)Obesity status was categorized as follows: non-obesity, BMI < 25 kg/m2; obesity, BMI ≥ 25 kg/m2.
![]()
Association between BCAA intake levels and SMI by abdominal obesity status
Table 4 shows the association between dietary BCAA and SMI according to abdominal obesity status. Similarly, as in the analysis stratified by obesity status, BCAA (P = 0.001), isoleucine (P < 0.001), leucine (P < 0.001) and valine (P = 0.02) intakes in the non-abdominal obesity group were associated with high SMI, while no significant association was observed in the abdominal obesity group.
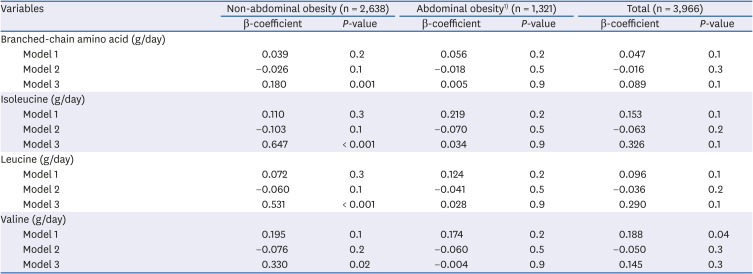
Table 4
Multiple regression analysis for the association between energy-adjusted intake levels of branched-chain amino acids and skeletal muscle mass index stratified by abdominal obesity status
Data calculated using 3 following models: model 1, unadjusted; model 2, adjusted for sex, age, household income, education level, alcohol consumption, smoking status, and physical activity; model 3, additionally adjusted for intake levels of non-branched chain amino acids.
1)Abdominal obesity was defined as waist circumference ≥ 80 cm in women and ≥ 90 cm in men.
![]()
Go to :
DISCUSSION
In this cross-sectional study of middle-aged Koreans, higher dietary intake levels of BCAA, isoleucine, and leucine were significantly correlated with higher levels of SMI. However, these correlations were counteracted by obesity and abdominal obesity. The positive correlations of dietary BCAA intakes with SMI were shown to be stronger in the non-obesity/non-abdominal obesity groups; however, these correlations became weak and non-significant in the obesity/abdominal obesity groups.
Our study showed that the beneficial effects of dietary BCAA intake on SMI were greater in the non-obesity group, compared to the obesity group. This may be attributed to insulin resistance and mitochondrial dysfunction in the muscles. BCAA and leucine have also been reported to increase adenosine triphosphate (ATP) production in the mitochondria [34], thereby promoting muscle protein synthesis [9]. However, excessive body fat is associated with mitochondrial dysfunction in the muscles [10], and this can lead to decreased muscle protein synthesis [11]. In a clinical study of Americans, increased plasma amino acid concentrations enhanced ATP production in lean individuals but not in obese individuals [12]. It was thought that the muscle synthesis function of BCAA might have been inhibited by mitochondrial dysfunction in the obesity group. In addition, obesity is associated with low-grade inflammation of the adipose tissue [35]. Adipose tissue secretes inflammatory cytokines, including interleukin-6 and tumor necrosis factor-α, which can lead to insulin resistance [35], and obesity-induced insulin resistance can promote muscle catabolism that results in muscle loss [14]. A cross-sectional study of adults aged over 20 years in the United States described a negative association between SMI and insulin resistance [32]. In addition, the Korean Sarcopenic Obesity Study, which included healthy adults over 20 years of age, showed that high-sensitivity C-reactive protein and homeostasis model assessment of insulin resistance (HOMA-IR) levels were negatively correlated with SMI [36]. Furthermore, HOMA-IR levels were higher in the group with visceral obesity and sarcopenia than in the group without these conditions [36]. Thus, mitochondrial dysfunction and insulin resistance in our participants with obesity may have masked any positive effect of dietary BCAA intake on SMI.
As a BCAA, leucine activates mammalian target of rapamycin complex 1 (mTORC1), a protein kinase involved in intracellular signaling [37]. Activated mTORC1 increases protein synthesis in the skeletal muscle by regulating mRNA translation through the phosphorylation of ribosomal protein S6 kinase 1 (S6K1) and eukaryotic initiation factor 4E-binding protein-1 (4E-BP1) [38]. Experimental studies have indicated that isoleucine enhances the phosphorylation of S6K1 and 4E-BP1, which is required for protein biosynthesis, in the skeletal muscle [39]. Therefore, the results of this study could be due to the synergistic effect of leucine and isoleucine [40]. However, previous studies on the mechanisms underlying the role of isoleucine and valine in protein synthesis of skeletal muscle are limited, and further studies are required. According to a cross-sectional study conducted in Norway, sarcopenia was associated with low plasma concentrations of BCAA, isoleucine, and leucine [41]. In a recent clinical study conducted in Japan, BCAA supplement intake was shown to improve muscle strength and muscle mass in adults with sarcopenia aged 65 years and older [42]. A meta-analysis of eight clinical studies also reported that BCAA intake improved muscle function by reducing the concentration of creatine kinase (a muscle damage marker), and reduced muscle soreness [43].
According to a randomized controlled trial of Korean participants, ASM and SMI were higher in the group receiving an additional 1.5 g/kg/day of protein powder while maintaining a usual diet than in the groups receiving 0.8 and 1.2 g/kg/day of protein powder [44]. However, in this study, dietary protein intake was not associated with muscle index, and this may be a result of the Korean plant protein-based dietary habits. According to a study on Korean participants, plant proteins, such as those from grains, had the highest contribution to protein intake [1628]. A cross-sectional study of middle-aged Americans analyzed the association between the type of protein intake and muscle mass [45]. They found that there was a positive correlation between animal protein intake and muscle mass index, but no significant correlation was found with total protein or plant protein intake. Plant proteins were reported to contain lower levels of essential amino acids such as leucine, methionine, lysine, and tryptophan than animal proteins [46]. Nevertheless, the mechanism underlying the effect of plant protein-based dietary habits on SMI is unclear, and further research is required to investigate this association.
There are several limitations to this study. First, the KNHANES is a cross-sectional study that did not clarify the causal relationship between dietary BCAA intake and SMI. Second, since this study estimated amino acid intake using a 24-hour recall, the obtained data may not reflect the usual diet. However, using standardized protocols, trained interviewers conducted nutrition surveys, and quality control and operational support were provided [47]. Third, unmeasured or unknown confounding factors that can affect skeletal muscle mass, such as the use of supplements and strength activities, may have been presented. Fourth, because of the limitations in the CAN-Pro database, this study did not include the amino acid content values for all foods consumed by the participants; thus, we may have underestimated the actual intake. However, in this study, the amino acid content was calculated by applying a conversion factor for similar foodstuffs to compensate for this limitation.
In conclusion, there was a significant positive association between the intake of dietary BCAA and SMI among the middle-aged and pre-elderly adults in Korea. This association was also observed in the non-obesity group. A clinical or prospective cohort study in the Korean population should be conducted to examine the effects of other potential confounders (e.g., resistance, aerobic exercise) and supplemental intakes of amino acids.
Go to :
 XML Download