

 PDF
PDF Citation
 Print
Print


INTRODUCTION
Metabolic processes during pre- and postnatal development influence the likelihood of developing metabolic disease later in life. Fetal programming has been reported to affect adult health, with nutrition during the perinatal period reported as one of the most influential variables thereof [1]. A maternal high-fat diet during pregnancy increases the risk of her offspring to develop metabolic diseases in adulthood [2], and maternal fructose intake has also been associated with epigenetic modifications in her offspring [3]. Although fructose consumption has declined significantly over the last decade, it is still a common sweetener in many processed foods and sugar-sweetened beverages such as sodas, fruit drinks, and even sports drinks [4]. Evidence from experimental and clinical studies indicates that liquid forms of sugar confer greater risks of metabolic syndrome than solid forms [5]. Caloric overconsumption and body weight gain can result from fructose intake through prolonged activation of hunger and reward signals and depression of satiety signals [6]. Excessive fructose intake can induce several signs of metabolic syndrome [7].
Owing to overweight and inactive lifestyles, the incidence of metabolic syndrome is steadily increasing in developed countries [89]. Metabolic syndrome refers to a series of metabolic conditions that can lead to heart disease. According to American Heart Association guidelines, the person is diagnosed as having metabolic syndrome if 3 or more of the following traits are met: abdominal obesity, serum triglycerides (TGs) of > 150 mg/dL, HDL cholesterol of < 50 mg/dL in women, blood pressure of > 130/85 mm Hg, and fasting blood glucose of > 100 mg/dL [10]. Most of all, hypertension is a key factor in metabolic syndrome; hypertensive patients have been reported to be more likely to have metabolic syndrome [11]. The body contains multiple mechanisms for controlling blood pressure, of which the renin-angiotensin-aldosterone system (RAAS) is a critical regulator. In response to decreased blood pressure, the kidneys release renin to help make angiotensin II, its physiologically active form. Angiotensin II has diverse effects on the kidneys, vascular smooth muscle, and the brain and stimulates aldosterone secretion by the adrenal cortex. Aldosterone, a steroid hormone, regulates epithelial sodium channels (ENaC, encoded by the scnn1b) and sodium-chloride cotransporters (NCCs, encoded by the slc12a3) [12]. Renal transporters, such as sodium-hydrogen antiporter3 (NHE3, encoded by the slc9a3), sodium-potassium-chloride cotransporter (NKCC, encoded by the slc12a1), NCC, and ENaC, cause an increase in sodium reabsorption at the nephron, which raises circulating blood volume and blood pressure [13].
We hypothesized that maternal high-fructose intake during pregnancy and lactation induces metabolic syndrome in adult offspring. Thus, we assessed offspring by supplying pregnant mice with large quantities of liquid fructose during pregnancy and lactation, and their offspring were evaluated for metabolic syndrome-associated parameters.
SUBJECTS AND METHODS
Animals
This study was conducted in accordance with the National Institutes of Health Guide for the Care and Use of Laboratory Animals after approval by the Institutional Review Board of Kyungpook National University (2018-0176). Every effort was made to minimize both the number of animals used and their suffering. Breeding was carried out between nulliparous one male and three females to produce the next generation for a week. Eight-week-old pregnant C57BL/6J mice (F0) were randomly divided into two groups (n = 4 in each group) and offered fructose solution (treatment group, 20% wt/vol) [14] or regular water (control group) throughout pregnancy and lactation. Fructose was purchased from Millipore (Billerica, MA, USA). After the lactation for 4 weeks, all pups (F1) were separated from dams and were fed regular chow. Pups were sacrificed at 7 months of age for additional analysis. Mice were anesthetized with pentobarbital sodium (50 mg/kg intraperitoneally; Hanlim Pharm, Yongin, Korea). Tissues were frozen in liquid nitrogen and stored at −80°C until further study.
Histological analysis
Liver and kidney tissues were fixed in 4% formalin overnight, then dehydrated and embedded in paraffin using conventional methods. Paraffin-embedded samples were sectioned to a thickness of 2 μm. Liver sections were stained with Oil Red O and hematoxylin and eosin (H&E). Kidney sections were stained with trichrome and H&E. After staining, slides were examined with light microscopy.
Hepatic TG assay
Lipids were extracted by homogenizing 100 mg liver tissue in 1ml 5% NP-40/ ddH2O solution using pestles, then slowly heated to 90°C in water bath for 5 min. The samples were cooled down and again heated to solubilize all TGs into solution. The samples were centrifuged for 2 min and supernatants were diluted 10 fold with ddH2O for quantification. Hepatic TG analyzed using the TG assay kit-quantification (ab65336, Abcam, Cambridge, UK).
Western blot
For protein expression analysis, frozen tissues were homogenized in RIPA buffer containing protease inhibitors. Protein-matched samples (Bradford assay) were electrophoresed (SDS- PAGE) and then transferred to nitrocellulose (NC) membranes. The NC membranes were blocked with 5% skim milk in TBS (25 mmol/L Tris base and 150 mmol/L NaCl) for 2 h at room temperature and then incubated with the following primary antibodies (1:1000 diluted) at 4°C overnight. SREBP1 antibody (Santa Cruz Biotechnology, CA, USA), ac-K antibody (Cell Signaling Technology, MA, USA), ACC antibody (Thermo Fisher, MA, USA), FAS antibody (Thermo Fisher), GAPDH antibody (Thermo Fisher), and SCD1 antibody (Abcam, Cambridge, UK). The membranes were incubated with secondary antibodies (1:5,000 diluted) at room temperature for 1 hour and then washed three times for 10 min each in TBST. The target proteins were detected with ECL plus detection reagents (Amersham, Pittsburgh, PA, USA). The expression levels were quantified using optical densitometry and the ImageJ software (ImageJ software; http://rsbweb.nih.gov).
Glucose tolerance test (GTT)
GTTs were performed on offspring at 7 months of age. Mice were fasted for 16 h, after which fasting glucose levels were determined using an Accu-CHEK Performa (Roche, Berlin, Germany). Glucose (20% solution, 2 g/kg; Sigma-Aldrich, St. Louis, MO, USA) was then injected intraperitoneally, and blood glucose levels were measured at 30, 60, and 120 min.
Blood chemistry
Whole blood was collected from the tail vein. HbA1c was measured using a Mouse Hemoglobin A1c (HbA1c) Assay Kit (#83010, Crystal Chem, Downers Grove, IL, USA) for the quantitative determination of HbA1c in whole blood depending on manufacturer's instructions. Serum was isolated by centrifugation at 2,000 rpm for 10 min. Blood chemistry analysis was performed at the Pohang Center for Evaluation of Biomaterials, Pohang Technopark in Pohang, Korea.
Blood pressure measurement
Blood pressure was measured in mice using the tail-cuff method. Mice were warmed on a hotplate at 35°C for 10 min and then placed in a plastic restrainer. A cuff with a pneumatic pulse sensor was attached to the tail. Blood pressure values were recorded on a CODA system (Kent Scientific Corporation, Torrington, CT, USA) with heating, and at least 10 consecutive readings obtained from each mouse for averaging [1516].
Quantitative polymerase chain reaction (qPCR)
RNA from whole kidneys was extracted using Trizol Reagent (Invitrogen, Carlsbad, CA, USA) according to the manufacturer's instructions. Total RNA (5 μg) was reverse-transcribed into cDNA using RevertAid first strand cDNA synthesis (Fermentas EU, Glen Burnie, MD). QPCR was performed using SYBR Green PCR master mix (Applied Biosystems, Foster City, CA, USA) and an ABI PRISM® 7000 Sequence Detection System (Applied Biosystems, California, USA). Relative mRNA expression levels were determined by calculating the values of Δ cycle threshold (ΔCt) by normalizing the average Ct value compared with its endogenous control (Gapdh) and then calculating 2−ΔΔCt. All primer sets used in the present study are shown in Supplementary Table 1.
Hormone measurements
Serum renin, angiotensin II, and aldosterone levels were analyzed individually by ELISA (E-EL-M0061, E-EL-M2612, E-EL-0070, Elabscience Biotechnology Inc., Houston, TX, USA). All samples were analyzed in duplicate.
Statistics
Results are expressed as mean ± SE. Data were analyzed with Student's t-test for the two comparisons or ANOVA followed by Tukey's post hoc tests for multiple comparisons. A P value of less than 0.05 was considered significant. Statistical calculations were performed using SPSS software (version 19.0, SPSS, Chicago, IL, USA).
RESULTS
Maternal high-fructose intake induced dyslipidemia and hyperglycemia in adult offspring
The offspring of fructose-fed dams presented with noticeable increases in liver size and body weight at the age of 7 months (Fig. 1A and B). Oil Red O staining for the liver revealed that maternal high-fructose intake also induced steatosis in their offspring (Fig. 2A). Quantification of TG accumulation in the liver supported this observation (Fig. 2B). The expression of lipogenesis proteins was detected by western blotting in female (Fig. 3A) and male offspring (Fig. 3B). High-fructose intake during pregnancy and lactation increases the levels of acetyl-CoA carboxylase (ACC), fatty acid synthase (FAS), stearoyl-CoA desaturase 1 (SCD1), and sterol regulatory element-binding proteins (SREBP) in both offspring. In addition, male offspring had higher basal expression levels of FAS, SCD1, and SREBP than female offspring (Fig. 3C). These results suggested that maternal high fructose induced steatosis and lipogenesis in the liver.
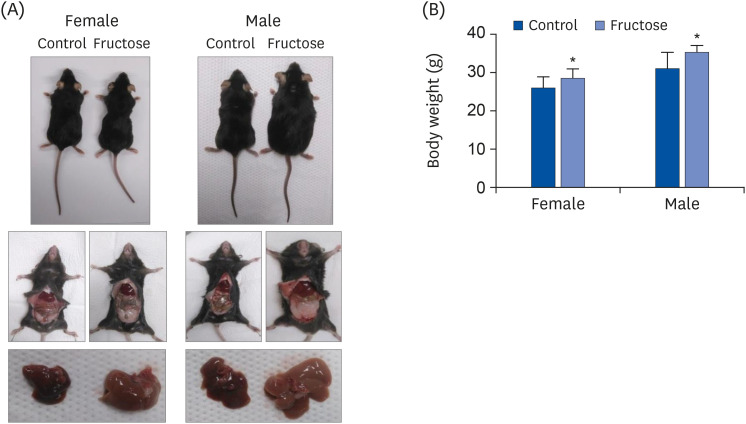
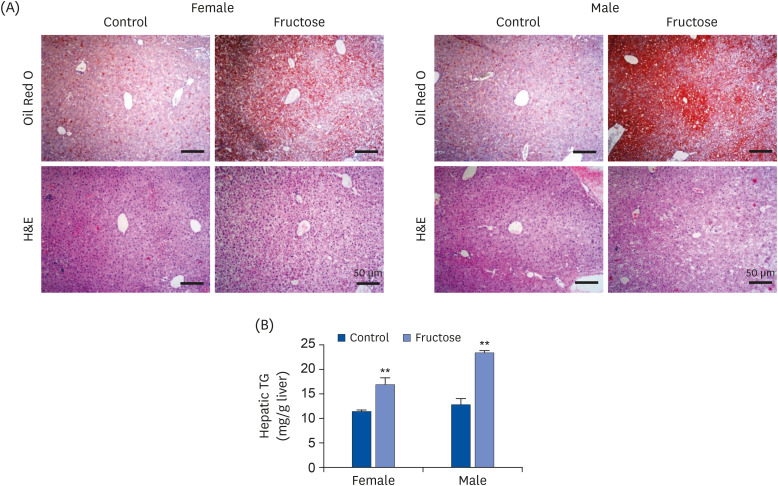
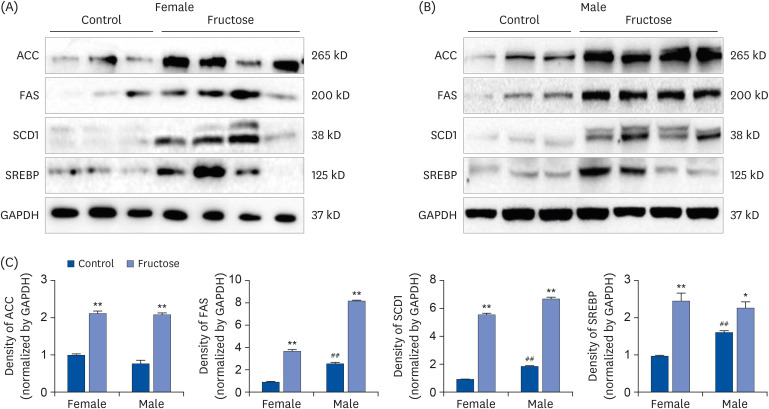
Fig. 1
Effects of maternal high-fructose intake on body weight and liver size. The representative pictures of female and male offspring at 7 months of age. Dams were fed drinking water, either with or without 20% fructose. Offspring were fed chow diets and drunken tepid water after weaning. (A) Photographs of representative mice of each group after 7 months. Photograph of visceral fat and liver in offspring. (B) Body weight at 7 months of offspring. Data are presented as mean ± SE (n = 8). Statistical analyses were conducted using 2-way analysis of variance, followed by Tukey's post hoc tests for multiple comparisons (*P < 0.05, control vs. fructose).
![]()
Fig. 2
Effects of maternal high-fructose intake on fatty liver development. (A) Representative microscopic images of livers from female and male offspring at 7 months. Liver sections were stained with Oil Red O or H&E (bar = 50 μm, 100× magnification). (B) Hepatic TG level was measured by colorimetric method using TG quantification kit. Data are presented as mean ± SE of 6 mice in each group.
TG, triglyceride; H&E, hematoxylin and eosin.
Statistical analyses were conducted using 2-way analysis of variance, followed by Tukey's post hoc tests for multiple comparisons (**P < 0.01, control vs. fructose).
![]()
Fig. 3
Effects of maternal high-fructose intake on lipid metabolism in liver. (A, B) The expression of lipogenesis proteins was detected by western blotting in female and male offspring. Maternal high-fructose exposure increased the expression of lipogenesis in both gender. The gel is representative of 3 independent experiments. Glyceraldehyde-3-phosphate dehydrogenase expression was used as control. (C) Densitometry analysis of expressed ACC, FAS, SCD1, and SREBP using ImageJ program and normalized by the control level.
Statistical analyses were conducted using 2-way analysis of variance, followed by Tukey's post hoc tests for multiple comparisons (*P < 0.05, **P < 0.01, control vs. fructose. ##
P < 0.01, between female and male controls).
![]()
Compared with the control group, maternal high-fructose exposure induced glucose intolerance and hyperglycemia at 7 months in offspring of both sexes and higher area under the curve (AUC) values (Fig. 4A and B). Glycated hemoglobin A1c in the whole blood was measured, and an increase in HbA1c by high-fructose intake was observed in male offspring than female offspring, similar to GTT (Fig. 4C). The serum levels of aspartate transaminase, TG, and total cholesterol were higher in both fructose groups than in control. We found that male offspring had higher basal expression levels of alanine aminotransferase and total cholesterol than female offspring (Table 1).
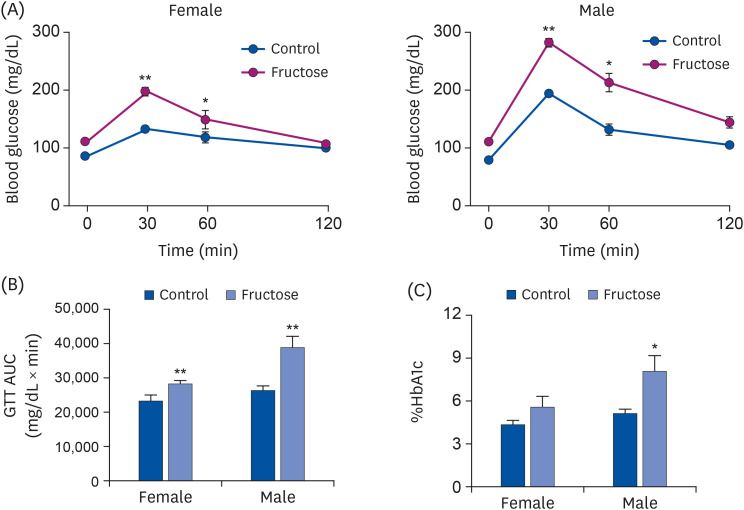
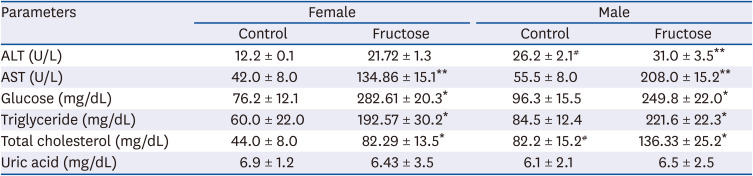
Fig. 4
Effects of maternal high-fructose intake on glucose tolerance. (A) GTTs were performed on female and male offspring at 7 months. Statistical analyses were conducted using Student's t-test. (B) Corresponding AUC values were obtained (A). Maternal high-fructose intake was strongly associated with glucose intolerance. (C) Glycated HbA1c was measured by colorimetric method using HbA1c Assay Kit.
GTT, glucose tolerance test; AUC, area under the curve; HbA1c, hemoglobin A1c.
Statistical analyses were conducted using 2-way analysis of variance, followed by Tukey's post hoc tests for multiple comparisons. Data are presented as mean ± SE of 8 mice in each group (*P < 0.05, **P < 0.01, control vs. fructose).
![]()
Table 1
Effects of maternal high-fructose intake on serum biochemical parameters in 7-month-old-offspring
Blood was obtained from eight mice in each group.
ALT, alanine aminotransferase; AST, aspartate aminotransferase.
Statistical analyses were conducted using Student's t-test. (*P < 0.05, **P < 0.01, control vs. fructose. #P < 0.05, between female and male controls).
![]()
Maternal high-fructose intake induced hypertension in adult offspring
To determine the effect of maternal high-fructose intake on the blood pressure of their offspring, blood pressures of all study animals were measured at the age of 7 months. Systolic blood pressure values were elevated in the offspring of fructose-fed dams (Fig. 5A). However, there were no statistically significant differences in serum levels of renin (Fig. 5B), angiotensin II (Fig. 5C), and aldosterone (Fig. 5D) between treatment and control groups.
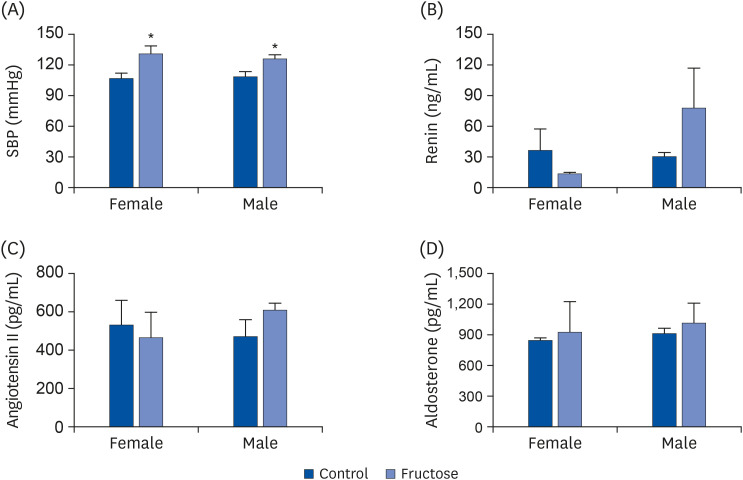
Fig. 5
Maternal high-fructose intake induced hypertension. (A) SBP was measured using a tail-cuff method in female and male mice at 7 months. Maternal high-fructose intake induced hypertension. (B-D) Serum renin, angiotensin II, and aldosterone (renin; expressed as ng/mL of the serum) were measured using enzyme-linked immunosorbent assay. Data are presented as mean ± SE of 6 mice in each group.
SBP, systolic blood pressure.
Statistical analyses were conducted using 2-way analysis of variance, followed by Tukey's post hoc tests for multiple comparisons (*P < 0.05, control vs. fructose).
![]()
Quantitative real-time polymerase chain reaction (qRT-PCR) of sodium transporter genes was performed to ascertain whether maternal high-fructose intake caused increased blood pressure by overexpression of these genes in the kidneys of their offspring. Maternal high-fructose intake did not affect expression levels of sodium transporters in offspring. However, we found that male offspring had higher basal expression levels of Slc9a3 and Slc12a3 than female offspring (Supplemental Fig. 1A-D).
The expression patterns of genes related to oxidative and antioxidative enzymes was evaluated using qRT-PCR. Maternal high-fructose intake increased the expression of Cyba in female offspring, but not in male offspring (Fig. 6A), and did not affect the expression levels of Cybb and Nox4, but females presented with a higher basal expression level thereof than males (Fig. 6B and C). Maternal high-fructose intake increased the expression of Sod1 in female offspring, but not in male offspring (Fig. 6D), and there was no difference in the Cat expression in either sex (Fig. 6E).
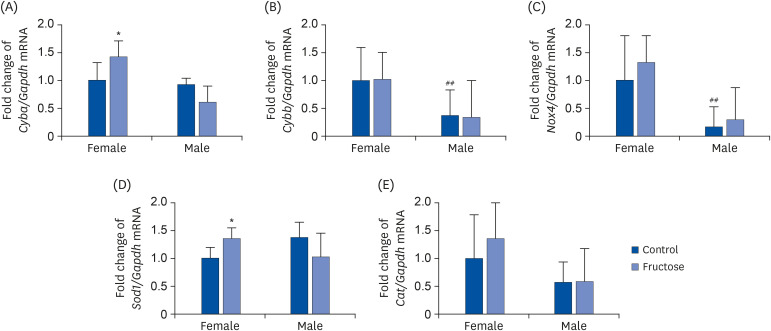
Fig. 6
Effects of maternal high-fructose intake on the expression of oxidant enzyme and antioxidant enzyme genes in offspring kidneys. Expression of oxidant enzyme genes such as (A) Cyba, (B) Cybb, and (C) Nox4 in the kidney was quantified using qPCR. Expression of antioxidant enzyme genes such as (D) Sod1 and (E) Cat in the kidney was quantified using qPCR. Data are presented as mean ± SE of 6 mice in each group.
qPCR, quantitative polymerase chain reaction.
Statistical analyses were conducted using 2-way analysis of variance, followed by Tukey's post hoc tests for multiple comparisons (*P < 0.05, control vs. fructose. ##
P < 0.01, between female and male controls).
![]()
Trichrome staining was performed to analyze levels of fibrosis. Supplemental Fig. 2A showed slight collagen deposition, but there were no significant differences in the expression levels of inflammatory factors Tgfb, Nfkb, and Il6 between groups (Supplemental Fig. 2B).
DISCUSSION
This study demonstrates that maternal high-fructose intake during pregnancy and lactation is associated with metabolic syndrome in adult offspring. We found that a fructose solution intake in pregnant dams was associated with higher body weights, dyslipidemia, hyperglycemia, hypercholesterolemia, and hypertension in their 7-month-old offspring and increased inflammation in the treatment group.
During pregnancy, maternal nutrition is the major contributing factor in the intrauterine environment associated with altered expression of the fetal genome, and poor maternal nutrition can have lifelong consequences [17]. The composition of breast milk is directly influenced by maternal nutrient intake and thereby influences neonatal nutrition [18]. Some researchers have suggested the negative effects of maternal fructose intake during gestation and lactation on their offspring [19]. Clayton et al. [20] investigated the maternal, fetal, and neonatal hepatic gene expression at embryonic day 21 and postnatal day 10, whereas we investigated gene expression in adult offspring of 7 months after birth. Fructose consumption is strongly implicated in obesity and changes the effects of physical exercise on hepatic metabolism [21]. This study demonstrated that the offspring of fructose-fed dams presented with increased body weights and altered size and morphology of the liver (Figs. 1 and 2). Fetuses of dams fed a high-fructose diet exhibited activated hepatic fructose transporters and reduced fructokinase mRNA levels and presented with hepatic lipid accumulation, hepatic endoplasmic reticulum (ER) stress, and suppression of genes that regulate beta-oxidation [20]. Maternal consumption of a high-fructose diet during fetal development might alter fetal programming in a way that predisposes offspring to adult obesity and dyslipidemia (Table 1). The metabolic pathway of fructose is uniquely increased SREBP1c and downstream fatty acid synthesis genes [22]. In our study, maternal high-fructose intake caused steatosis and increased the expression of lipogenesis in both sexes (Fig. 3). SREBPs directly activate the expression of enzymes for synthesis and uptake of cholesterol, fatty acids, TGs, and phospholipids [23]. In our previous study, ACC, FAS, and SCD1 play important roles in the development of steatosis [2425]. De novo lipogenesis involves 2 key enzymes, that is, FAS and ACC; the latter carboxylates acetyl-CoA to form malonyl-CoA, which is further converted to long-chain fatty acids by FAS [26].
As expected, maternal high-fructose intake was significantly associated with offspring glucose intolerance, which is a prodromal stage of diabetes mellitus (Fig. 4). Although fructose and glucose metabolism share many intermediates, they have different metabolic fates in animals [7]. Owing to its hepatic metabolism and low levels of expression of the fructose transporter GLUT5 in insulin-secreting pancreatic β-cells, fructose, unlike glucose, does not stimulate insulin secretion [27]. Insulin resistance contributes to impaired glucose tolerance in some combination of liver, muscle, and adipose tissues [28]. In addition, fructose intake mediates epigenetic modifications associated with nonalcoholic fatty liver disease pathogenesis [29]. Our laboratory recently reported a paper that maternal high-fructose intake induces hypertension in subsequent generation offspring through activating histone codes on the pattern recognition receptor promoter [30].
Although there were no significant differences in circulating hormones related to RAAS between experimental and control groups, systolic blood pressure was elevated in the offspring of fructose-fed dams (Fig. 5). Expression levels of genes related to RAAS in kidney were examined, but maternal fructose intake was not associated with RAAS-related blood pressure increases in offspring (Supplemental Figs. 3 and 4). It has been reported to be the effect of maternal fructose intake on the expression of RAAS genes is more prominent in second-generation offspring than first-generation offspring [16]. Although renal sodium transporters regulate blood pressure [31], there were no differences in gene expression of transporters in several tubules of the offspring. Sodium transporters in the nephron are regulated by the hormones angiotensin II, insulin, nitric oxide, and others [32], of which angiotensin II is the most powerful stimulator [33]. Therefore, we speculate that other factors caused the increase in blood pressure of treatment offspring.
Renal injury occurs after oxidative stress, insulin resistance, increased proinflammatory cytokine production, and many more [34]. Oxidative stress elevates intracellular levels of reactive oxygen species [35] using a superoxide-generating NADPH oxidase (NOX) [36]. P22phox, encoded by the Cyba gene, is a component of the NOX1, NOX2, NOX3, and NOX4 [37]. Conversely, superoxide dismutase 1 (SOD1) is an antioxidant that scavenges free superoxide radicals [38]. Fibrosis in kidney tissues stained with trichrome was so mild in treatment group offspring that the expression of genes involved in inflammation did not differ between groups (Supplementary Fig. 2). Inflammation is a predominant sign of metabolic syndrome and often aggravates it [39]. Chronic low-grade inflammation is a comorbidity of obesity caused by the activation of inflammatory signaling pathways [40]. Fructose increases intracellular cortisol and expands visceral adiposity by increasing adipocyte size and adipocyte number [41]. The increased adipose mass induces ER stress, oxidative stress, and inflammasome activation [42]. Increased expression of both prooxidative Cyba and antioxidative sod1 was found in female offspring of fructose-fed dams, which presented with slightly more inflammation than males (Fig. 6).
Interestingly, our data revealed the differences in basal gene expression between female and male control groups. Cybb and Nox4 were expressed in female more than in male (Fig. 6), whereas Ace, Mas1, Slc9a3, and Slc12a3 were expressed in males more than in females (Supplementary Figs. 1, 3, and 4). The incidence of hypertension in fructose-fed rats varies by sex. Hypertension is regulated not only by sex but also by the interaction of certain sex hormones such as estrogen, androgen, and testosterone [434445]. The level of proteins involved in fructose metabolism in male mice that consumed fructose for 3 months increased, but not in female mice under the same condition. However, female mice had increased urine output and plasma K+ and decreased plasma Na+ and NKCC2 expression in the kidney [46]. Further investigation is needed to understand the basic mechanisms of fructose-induced metabolic syndrome by sex.
Our results indicate that maternal high-fructose intake induces metabolic syndrome, including increased body weight, dyslipidemia, hyperglycemia, hypercholesterolemia, and hypertension in adult offspring.
 XML Download