

 PDF
PDF Citation
 Print
Print


Chronic hyperglycemia and glucose variability from peaks to nadirs is known to induce vascular complications by activating oxidative stress, raising the importance of efforts to minimize glucose variability.1 In older adults with diabetes, poor glycemic control accelerates frailty and disability, eventually shortening life expectancy.23 Frailty is a clinical syndrome of having multiple dysregulation in biological and physiological systems. Geriatric adults undergo a gradual deterioration in physiological reserve and regulatory systems; however, frailty can make this deterioration faster.4 Frailty is of interest in diabetes care because substantial studies have reported its association with high glycated hemoglobin.25 impaired insulin sensitivity, and altered resting metabolic rate.67 However, underlying mechanism of this dysregulation has been rarely studied. Nor are studies to explore the relationship between glucose variability and frailty scarce. Therefore, we evaluated the glucose variability indices associated with frailty using continuous glucose monitoring (CGM) in older adults with type 2 diabetes (T2D).
This study enrolled 48 T2D patients (38 inpatients, 10 outpatients) who agreed to undergo CGM and a comprehensive geriatric assessment and who visited Severance Hospital from December 2017 to December 2019. All the 48 participants were aged ≥ 65 years. Anthropometric measurements and blood tests were performed, and diabetes medications and complications were evaluated. CGM attachment, training and geriatric assessment were performed by an interprofessional team. A CGM system (iPro2 and Enlite Glucose Sensor; Medtronic, Tolochenaz, Switzerland) was attached for ≥ 7 days and calibration was performed using the same self-monitoring glucometers at least twice a day to increase the accuracy of the data. Self-monitored blood glucose levels were measured before each meal and/or before sleep to maintain a stable state without major changes in blood glucose levels. Based on the International Consensus statement,8 key CGM metrics were collected: mean glucose, glucose management indicator (GMI), coefficient of variation (%CV), time in range (TIR, 70–180 mg/dL), time above range (TAR, > 180 mg/dL), and time below range (TBR, < 70 mg/dL). Microvascular complication studies were performed at the time of hospitalization or outpatient clinic for all patient groups. Macrovascular complications were confirmed by the patient's previous test results and diagnosis. The FRAIL scale (range 0–5), consisting of five domains (fatigue, resistance, ambulation, illnesses, and loss of weight), was used to classify patients into healthy (0), pre-frail (1–2), and frail (3–5) status.9 The degree of physical activity was classified into no physical activity, minimal physical activity, and health promotive activity by calculating the International Physical Activity Questionnaire (IPAQ) and metabolic equivalent of task level (walking 3.3, moderate 4.0, vigorous 8.0) × duration (min) x frequency per week.10 Mann-Whitney U test, Fisher's exact test, and multiple logistic regression analyses were performed using SPSS 21.0 software (SPSS Inc., Chicago, IL, USA).
The mean age of participants was 79.6 years (range 65–96) and the male to female ratio was 1.82:1. The mean duration of diabetes was 10.7 years and the average HbA1c was 8.1%. Those who achieved less than high school education accounted for 45.8%. Current smokers and consumers of alcohol were 4.2% and 10.8%, respectively, and half of the patients had a history of fractures and falls. Three-quarters of patients had no physical activity. The most common glucose-lowering treatment for patients was an oral anti-hyperglycemic agent (OHA) alone (n = 26), followed by an OHA + insulin (n = 12), insulin alone (n = 5), and no treatment (n = 5). Comorbidities included hypertension (n = 26), dyslipidemia (n = 21), macrovascular complications (n = 7), diabetic retinopathy (n = 12), diabetic kidney disease (n = 18), and diabetic peripheral neuropathy (n = 16). The average duration of the CGM system attachment was 6.9 ± 1.6 days and calibration was performed 2.9 ± 0.7 times/day. The averages for TIR, TAR, and TBR were 52.1% (range 0–100), 47.1% (range 0–100), and 0.8% (range 0–8), respectively. Frail, pre-frail, and healthy status accounted for 50% (n = 24), 37.5% (n = 18), and 12.5% (n = 6), respectively. The major cause of hospitalization among inpatients were infection (n = 16), acute complications of diabetes (hypo- or hyperglycemia, n = 7), and others (cardiovascular disease, cancer, and neurologic disorder etc., n = 13). The proportion of OHA and insulin treatments between inpatients and outpatients were not different (P > 0.05).
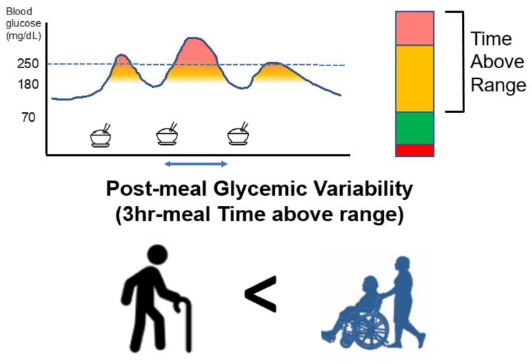
We analyzed the data according to a ‘frail’ group (n = 24) and a ‘healthy & pre-frail’ group (n = 24) (Table 1). There were no differences in age, sex, inpatient ratio, body mass index, presence of macro- and microvascular complications, blood pressure, levels of HbA1c, fasting glucose, total cholesterol, liver function, and renal function. However, CGM metrics did show a difference. In the frail group, the mean glucose (178 mg/dL vs. 207 mg/dL, P = 0.043) and GMI (7.8% vs. 8.8%, P = 0.041) were significantly higher compared to the healthy & pre-frail group. The TIR (60.0% vs. 44.2%, P = 0.053) was lower and TAR (39.2% vs. 55.0%, P = 0.053) was higher in the frail group without significant difference. The %CV and TBR showed no differences (P > 0.1). In addition, we analyzed the value of difference between GMI and HbA1c (GMI-HbA1c), TAR in the 3hr-postprandial periods, and TBR in the evening. The GMI-HbA1c (1.4 vs. 2.1, P = 0.014), TAR in the 3hr-post-breakfast (45% vs. 76%, P = 0.004), 3hr-post-lunch (36% vs. 70%, P = 0.003), and 3hr-post-dinner (44% vs. 70%, P = 0.019) were higher in the frail group. TBR in the evening showed no difference between groups.
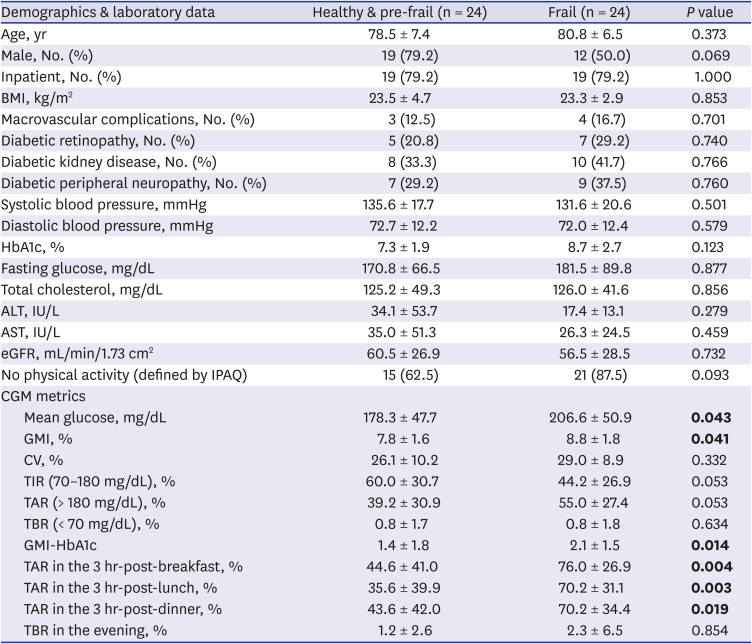
Table 1
Characteristics according to frailty defined by the FRAIL scale
Mann-Whitney U test for continuous variables and Fisher's exact test for categorical variables were performed. Bold font indicates statistical significance.
BMI = body mass index, ALT = alaine aminotransferase, AST = aspartate aminotransferase, eGFR = estimated glomerular filtration rate, IPAQ = international physical activity questionnaire, CGM = continuous glucose monitoring, GMI = glucose management indicator, CV = coefficient of variation, TIR = time in range, TAR = time above range, TBR = time below range.
![]()
We further analyzed the association between CGM metrics and frailty occurrence (Table 2). Age, sex, physical activity, and CGM metrics were considered as covariates. Before adjustments, female (OR = 3.8, P = 0.039), TAR in the 3-hr-post-breakfast (OR = 1.03, P = 0.006), and 3hr-post-lunch (OR = 1.03, P = 0.004) was associated with the risk of frailty. After adjustments, TAR in the 3hr-post-lunch remained valid (OR = 1.12, P = 0.019).
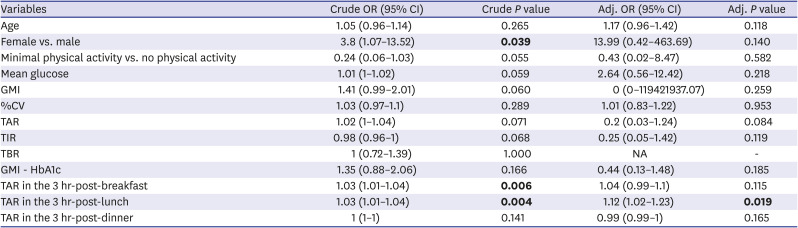
Table 2
The ORs of CGM metrics for prevalence of frailty
Bold font indicates statistical significance.
OR = odds ratio, CGM = continuous glucose monitoring, CI = confidence interval, GMI = glucose management indicator, CV = coefficient of variation, TAR = time above range, TIR = time in range, TBR = time below range.
![]()
TIR is used as a key variable in many clinical trials.11 The TIR is associated with the risk of microvascular complications,12131415 macrovascular complications,16 and cardiovascular and all-cause mortality.17 A decrease in TIR is accompanied by an increase in TBR or TAR. In older T2D patients, the target TIR is > 50%, TAR is < 50%, and TBR is < 1%.8 In our study, in the frail group, TIR was lower and TAR was higher than the recommended target. In particular, the daytime prandial TARs increased the risk of frailty, suggesting that it is important to focus on TARs in relation to frailty in older T2D patients. The average TBR in the ‘healthy & pre-frail’ group and the 'frail' group was within the target range. Presumably because this study was conducted mainly on inpatients, who were more likely to have stress hyperglycemia. Also, there was no difference in %CV between the ‘healthy & pre-frail’ and ‘frail’ groups, which were within the target (< 36%).18
HbA1c is an index that reflects the average blood glucose of the preceding 8–12 weeks, while CGM metrics reflect the acute fluctuation of the preceding 7–14 days. As a result of evaluating 18 articles, there was a clear inverse relationship between HbA1c and TIR (R = −0.84).19 Therefore, it is helpful to check CGM metrics when there is a discrepancy between HbA1c and mean blood glucose. Likewise, the larger GMI-HbA1c suggests that acute and excessive hyperglycemia (or hypoglycemia) is more frequent than the HbA1c predicted, requiring adjustment of the target HbA1c.20 Although there was no impact of GMI-HbA1c on frailty in our study, it suggests the possibility of a novel marker through larger population studies.
Like diabetes, frailty is a consequence of multiple organic dysregulation, rather than just one system. Targeting intervention focus on a more specific goal, therefore, is needed when diabetes and frailty are combined. In this regard, physical activity is considered a good option to lower TARs for frail diabetes older adults. As is well known, the benefits of physical activity in diabetes are many. Also, in frail, physical activity can positively affect cellular and molecular function and physiologic dysregulation, which further mitigate frailty.21 In addition to physical activity, adequate protein intake, avoiding a diet that rapidly raises blood sugar after meals, and selecting anti-hyperglycemic drugs that can manage postprandial excursions may be helpful.22
To our knowledge, this study is the first to explore the association between CGM metrics and frailty in older patients with diabetes, revealing the importance of TAR. The regulation of acute glycemic fluctuations, particularly postprandial hyperglycemia, can be useful for attenuating frailty in patients with diabetes.
 XML Download