Journal List > Ann Hepatobiliary Pancreat Surg > v.25(2) > 1147101

Yang, Hwang, Song, and Jung: Comparison of skeletal muscle index-based formula and body surface area-based formula for calculating standard liver volume

Abstract

Backgrounds/Aims

Formula-derived standard liver volume (SLV) has been clinically used for living donor liver transplantation and hepatic resection. The majority of currently available SLV formulae are based on body surface are (BSA). However, they often show a wide range of error. Skeletal muscle index measured at the third lumbar vertebra level (L3SMI) appears to reflect lean body mass. The objective of this study was to compare the accuracy of L3SMI-based formula and BSA-based formula for calculating SLV.

Methods

The study cohort was 500 hundred living liver donors who underwent surgery between January 2010 and December 2013. Computed tomography images were used for liver volumetry and skeletal muscle area measurement.

Results

The study cohort included 250 male and 250 female donors. Their age, BSA, L3SMI, and body mass index were 26.8±8.7 years, 1.68±0.16 m2, 45.6±9.0 cm2/m2, and 21.7±2.5 kg/m2, respectively. The BSA-based SLV formula was “SLV (ml)=−362.3+901.5×BSA (m2) (r=0.71, r2=0.50, p<0.001)”. The L3SMI-based SLV formula was “SLV (ml)=471.9+14.9×L3SMI (cm2/m2) (r=0.65, r2=0.42, p<0.001)”. Correlation coefficients were similar in subgroup analyses with 250 male donors and 250 female donors. There was a crude correlation between L3SMI and body mass index (r=0.51, r2=0.27, p<0.001).

Conclusions

The results of this study suggest that SLV calculation with L3SMI-based formula does not appear to be superior to the currently available BSA-based formulae.

INTRODUCTION

Formula-derived calculation of the standard liver volume (SLV) has been clinically used for relative graft size assessment for living donor liver transplantation (LDLT) and for calculation of the standardized parenchymal resection rate for major resection of cirrhotic livers.1-3 The majority of currently available SLV formulae are based on the body surface area (BSA), thus they are greatly influenced by sex, obesity, aging changes and other factors. Recently, skeletal muscle index measured at the third lumbar vertebra level (L3SMI) is known to be a surrogate marker of sarcopenia.4-8 L3SMI also appears to more reliably reflect the lean body mass than BSA. The objective of this study was to compare the accuracy of the L3SMI-formula and BSA-based formula for calculating SLV using a high-volume living liver donor cohort.

MATERIALS AND METHODS

Study design and patient selection

This was a retrospective double-arm observation study. After reviewing our institutional database for LDLT, each 250 male and 250 female donors who underwent either right or left hepatectomy from January 2010 to December 2013 were randomly selected for this study. Donors who took preoperative donor computed tomography (CT) not including the pelvis were excluded because L3SMI could not be assessed. The institutional review board of Asan Medical Center approved this study protocol, which waived the requirement for informed consent due to the retrospective nature of this study. This study was performed in accordance with the ethical guidelines of the World Medical Association Declaration of Helsinki 2013.

Anthropometric measurement and calculation

The BSA was calculated with Mosteller’s formula, which is simplified as “body weight (kg)×height (cm)/36000.5”.9 Body mass index (BMI) was calculated with the following formula: “body weight (kg)/height (m)2”. L3SMI was calculated as the skeletal muscle area (cm2) at the third lumbar vertebra level/height (m)2. Total liver volume (TLV) and skeletal muscle area at the third lumbar vertebra level were measured by CT volumetry using 3-5 mm-thick dynamic CT images. CT images were stored in a Picture Archiving and Communication System (PACS; Petavision2, Asan Medical Center, Seoul, Korea), enabling image processing and various measurements, including liver volumetry and area measurement.

Statistics

Continuous numeric variables are expressed as mean and standard deviation or as median and range. Continuous variables were compared with Student t-test. Simple linear regression analysis was performed to obtain regression equation, correlation coefficient (r), and coefficient of determination (r2). Spearman correlation coefficient (ρ [rho]) was used for correlation analysis. A p value <0.05 was considered statistically significant.

RESULTS

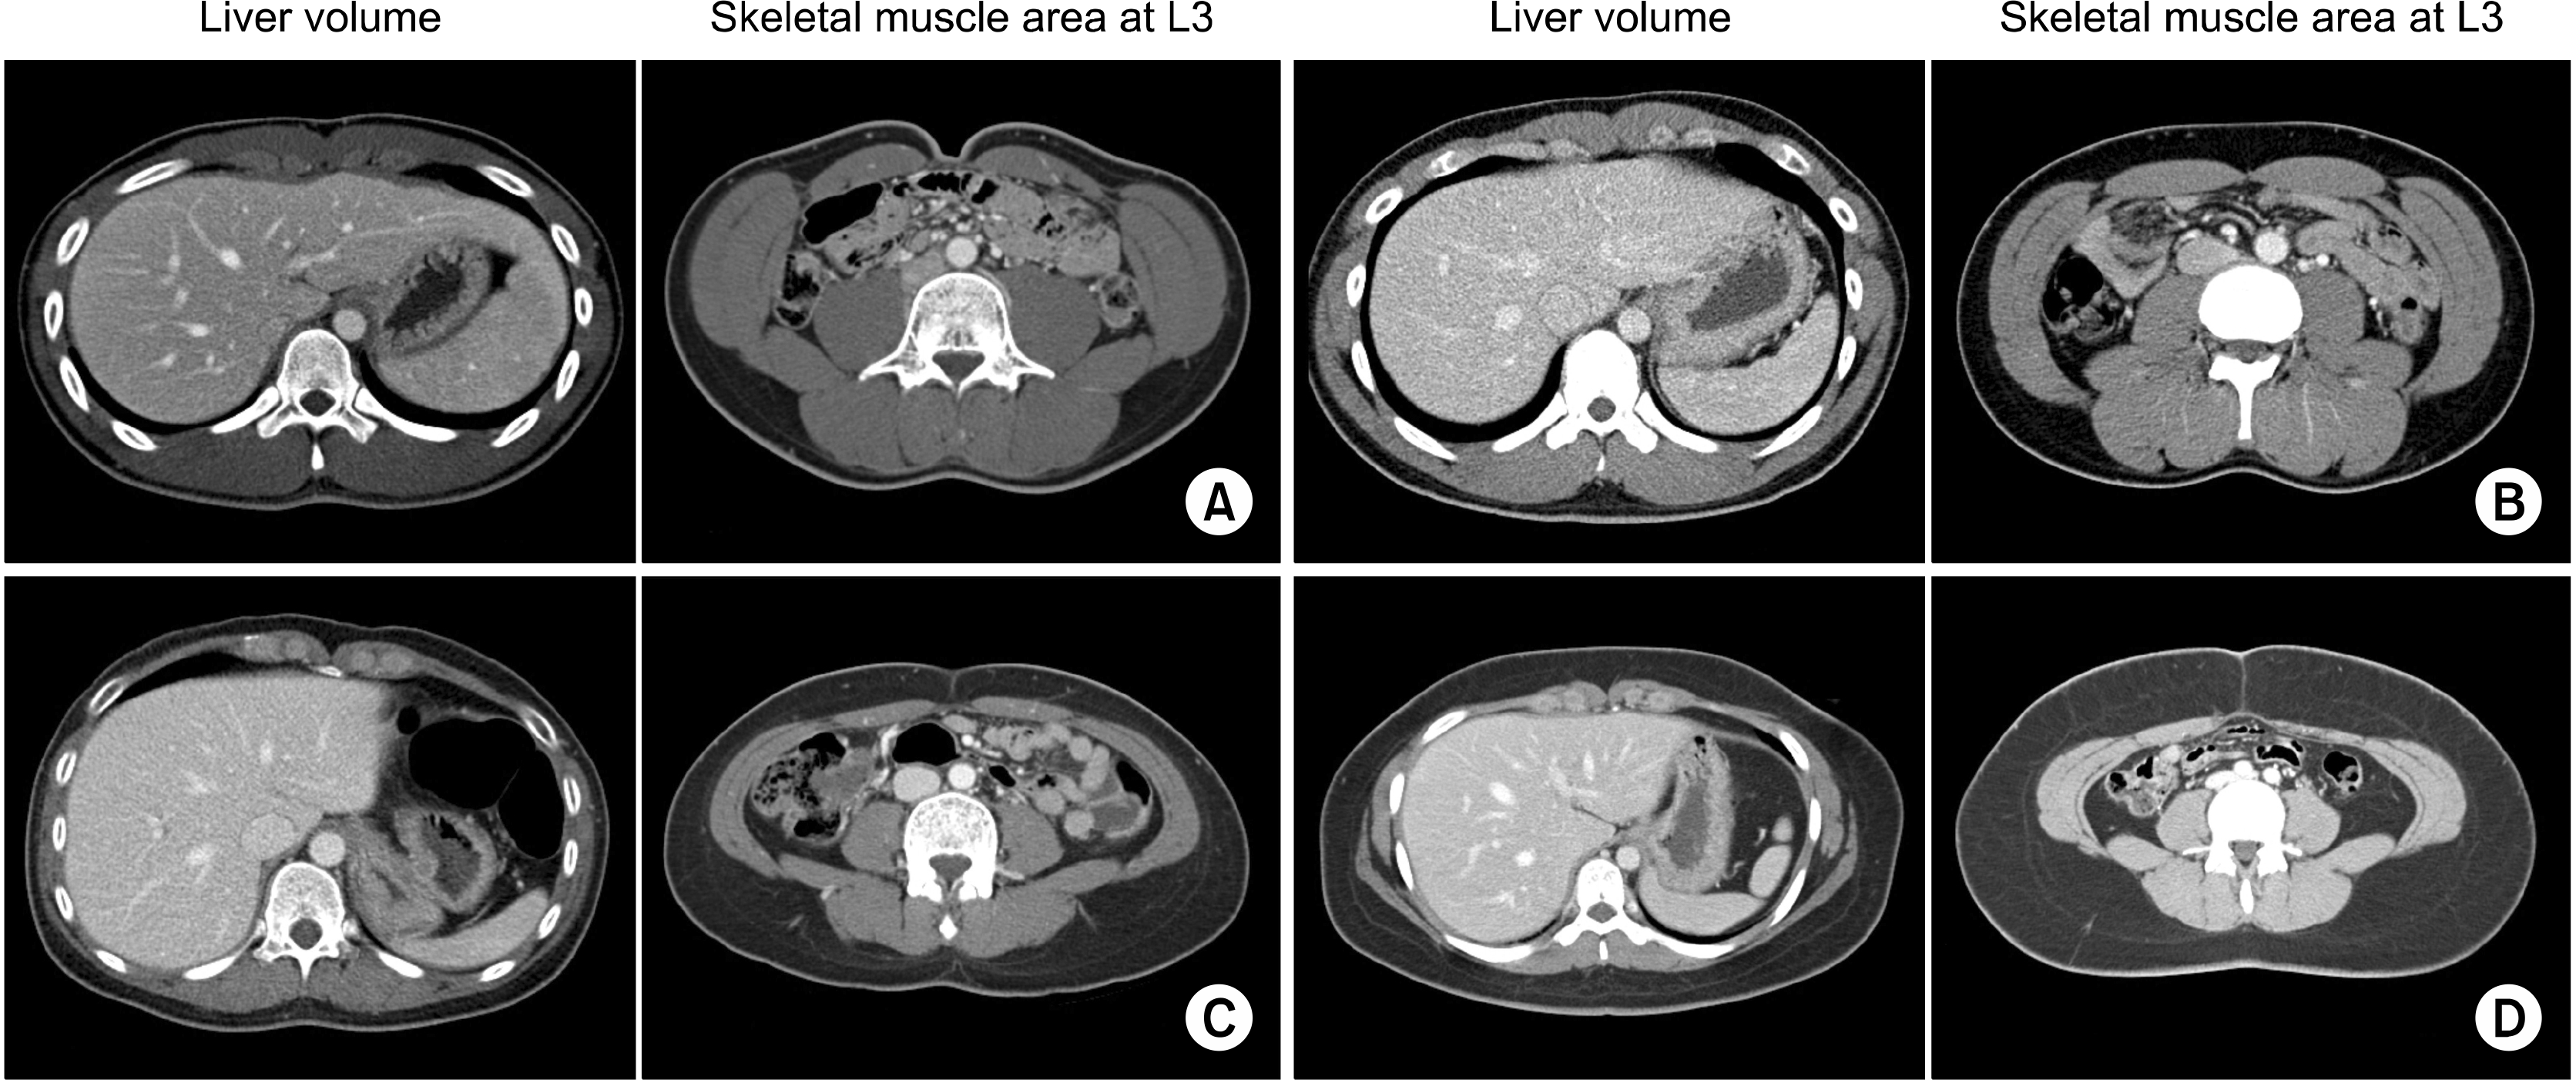
Demographic and anthropometric profiles of 500 living donors are summarized in Table 1. There were 250 (50.0%) male and 250 (50%) female donors. Their median values of BSA, L3SMI, and TLV were 1.67 m2, 44.8 cm2/m2, and 1129 ml, respectively. The median value of TLV per BSA (standardized TLV) was 673 ml/m2. Various samples of skeletal muscle area measurement were presented in Fig. 1.
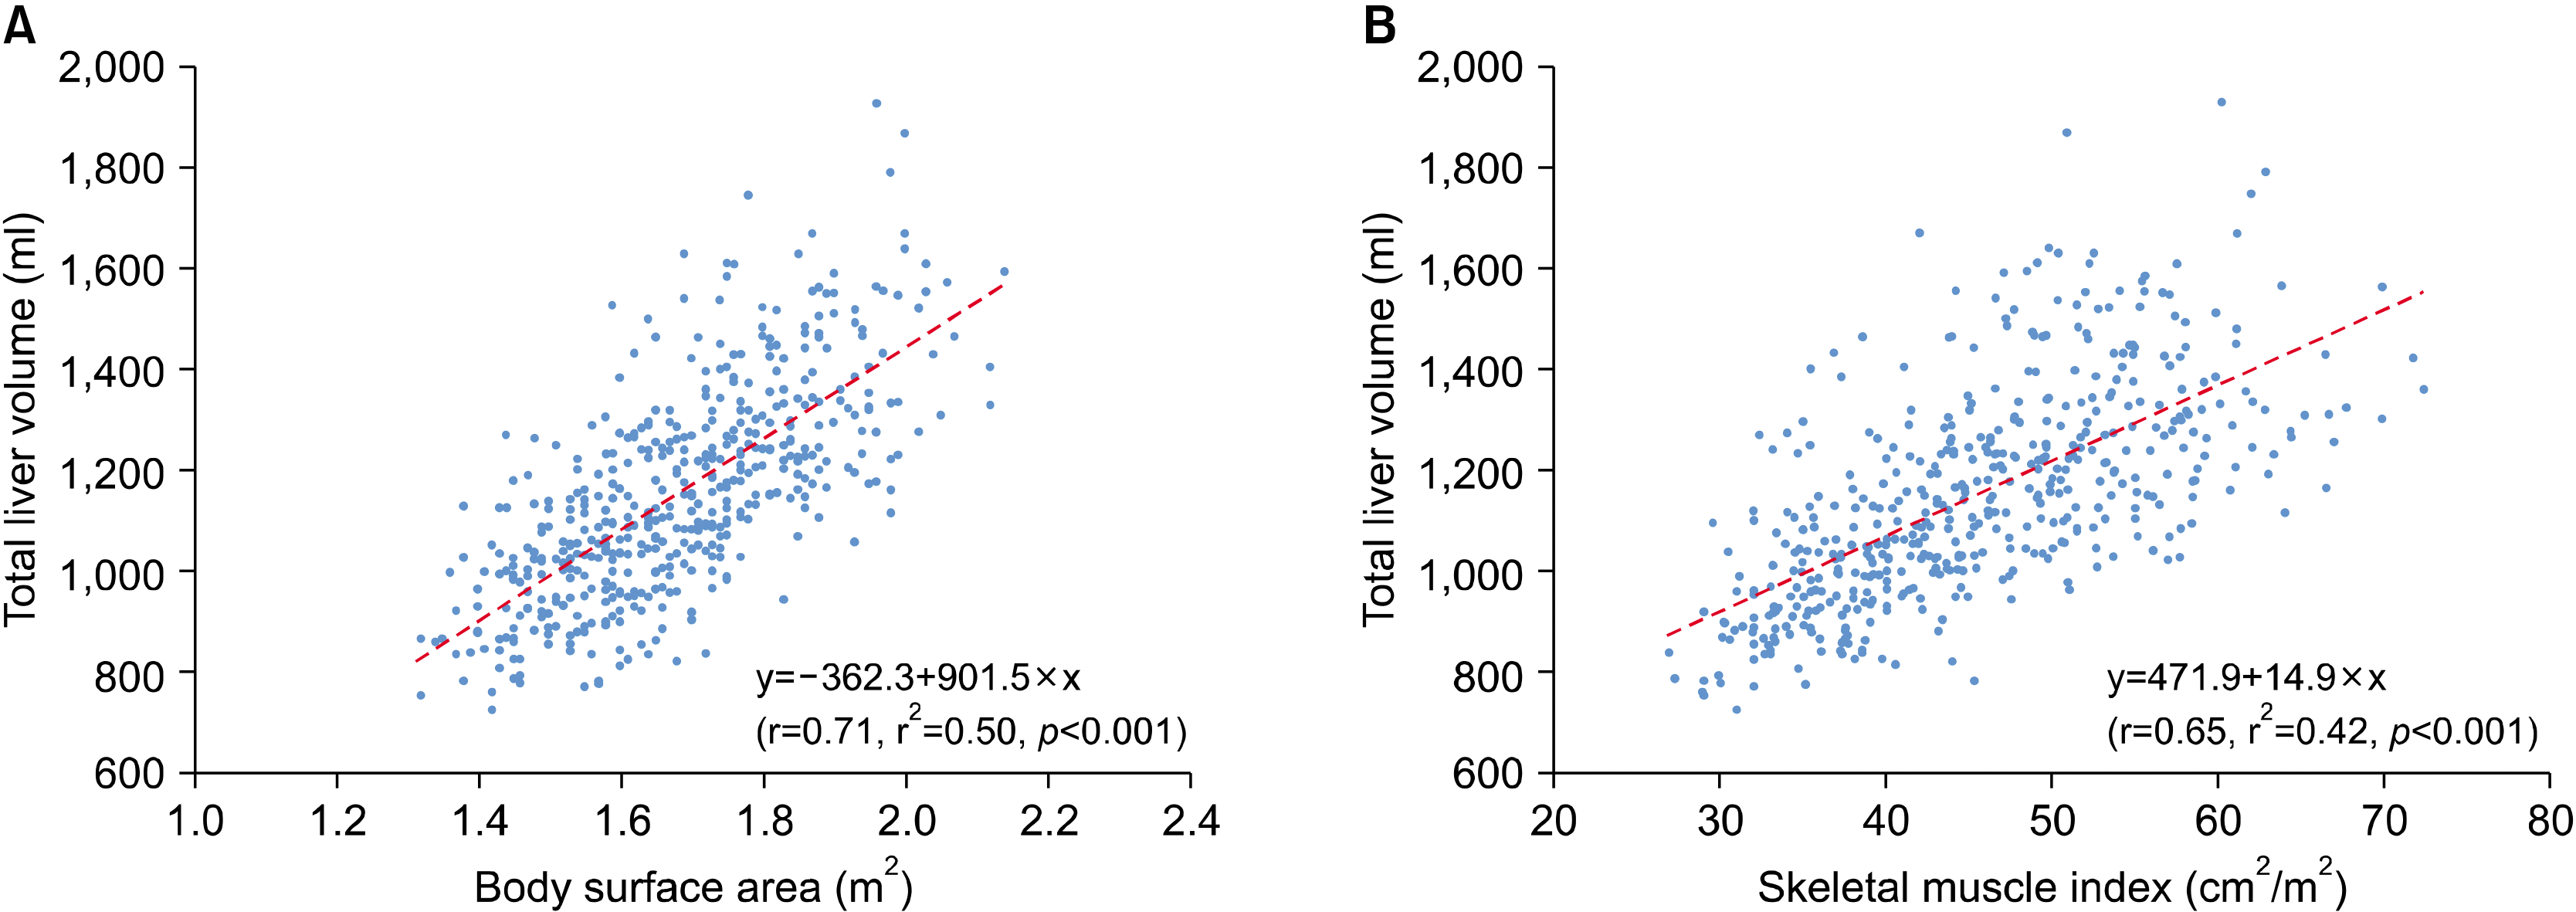
In all 500 donors, the correlation between TLV and BSA is depicted in Fig. 2A. The regression equation for SLV was as follows: SLV (ml)=−362.3+901.5×BSA (m2) (r=0.71, r2=0.50, p<0.001). The correlation between TLV and L3SMI is depicted in Fig. 2B. The regression equation for SLV was as follows: SLV (ml)=471.9+14.9×L3SMI (cm2/m2) (r=0.65, r2=0.42, p<0.001).
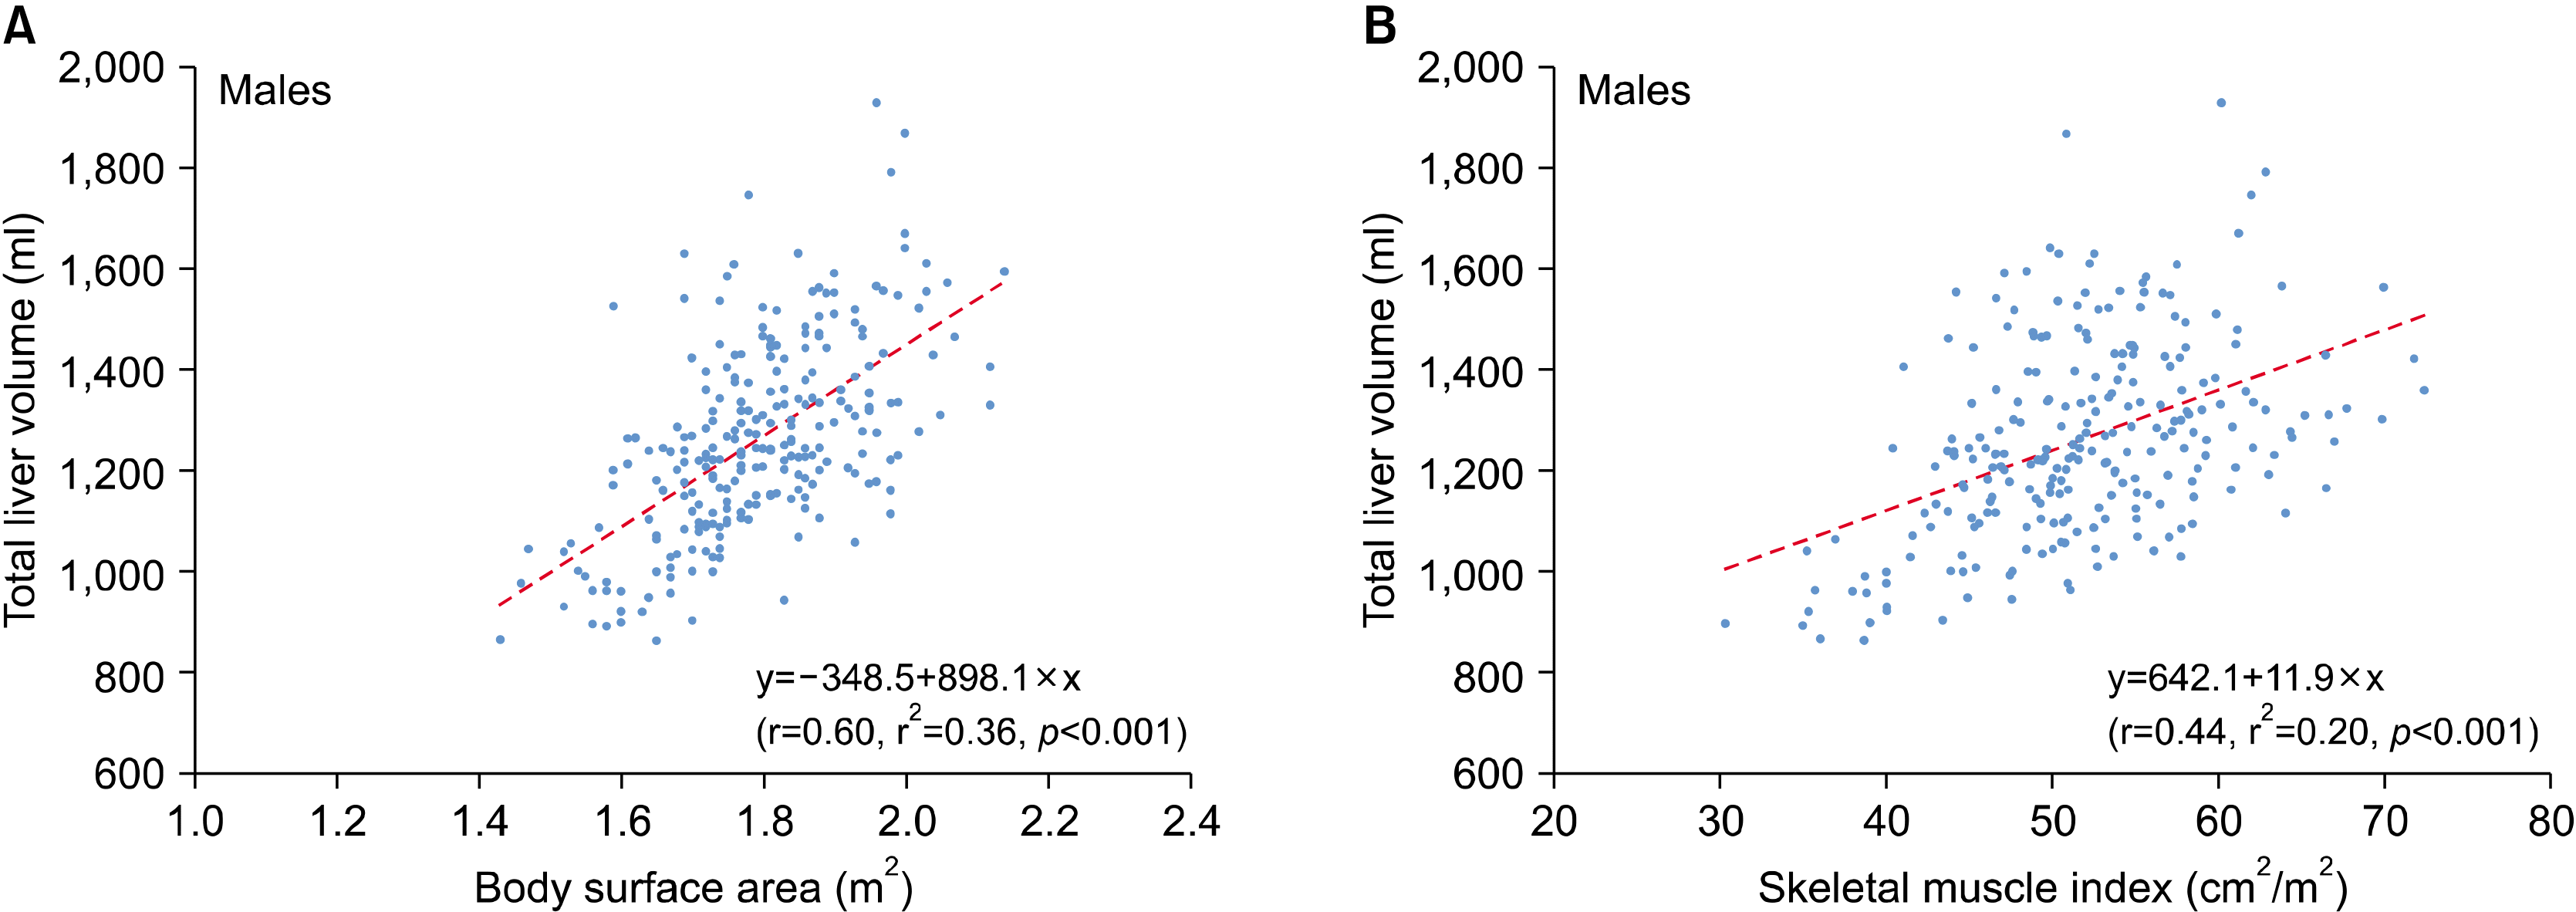
In 250 male donors, the correlation between TLV and BSA is depicted in Fig. 3A. The regression equation for SLV was as follows: SLV (ml)=−348.5+898.1×BSA (m2) (r=0.60, r2=0.36, p<0.001). The correlation between TLV and L3SMI is depicted in Fig. 3B. The regression equation for SLV was as follows: SLV (ml)=642.1+11.9×L3SMI (cm2/m2) (r=0.44, r2=0.20, p<0.001).
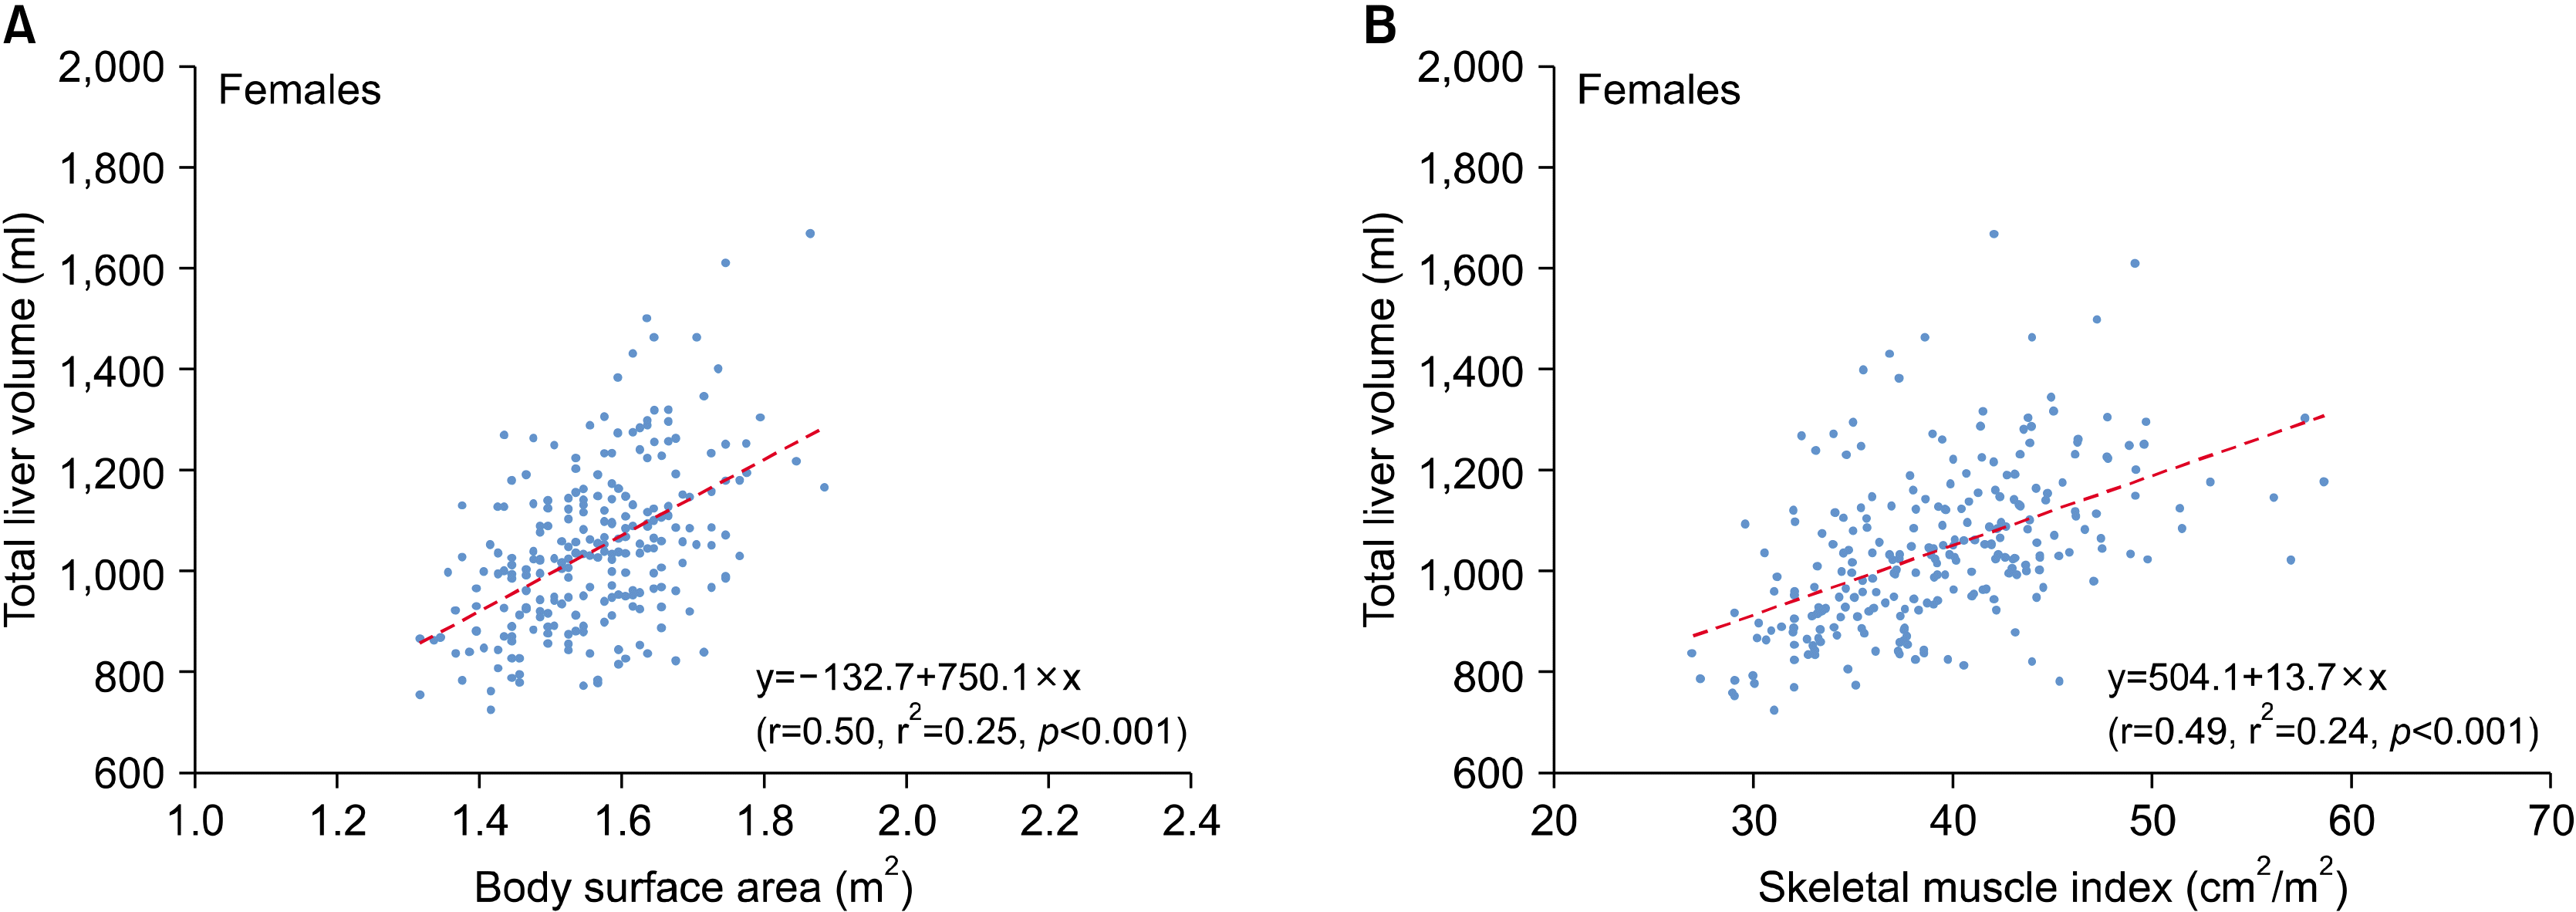
In 250 female donors, the correlation between TLV and BSA is depicted in Fig. 4A. The regression equation for SLV was as follows: SLV (ml)=−132.7+750.1×BSA (m2) (r=0.50, r2=0.25, p<0.001). The correlation between TLV and L3SMI is depicted in Fig. 4B. The regression equation for SLV was as follows: SLV (ml)=504.1+13.7×L3SMI (cm2/m2) (r=0.49, r2=0.24, p<0.001).
In all 500 donors, the Spearman correlation coefficient ρ was 0.72 (p<0.001) for the correlation between TLV and BSA and 0.69 (p<0.001) for the correlation between TLV and L3SMI. In 250 male donors, ρ was 0.60 (p<0.001) for the correlation between TLV and BSA and 0.43 (p<0.001) for the correlation between TLV and L3SMI. In 250 female donors, ρ was 0.47 (p<0.001) for the correlation between TLV and BSA and 0.53 (p<0.001) for the correlation between TLV and L3SMI.
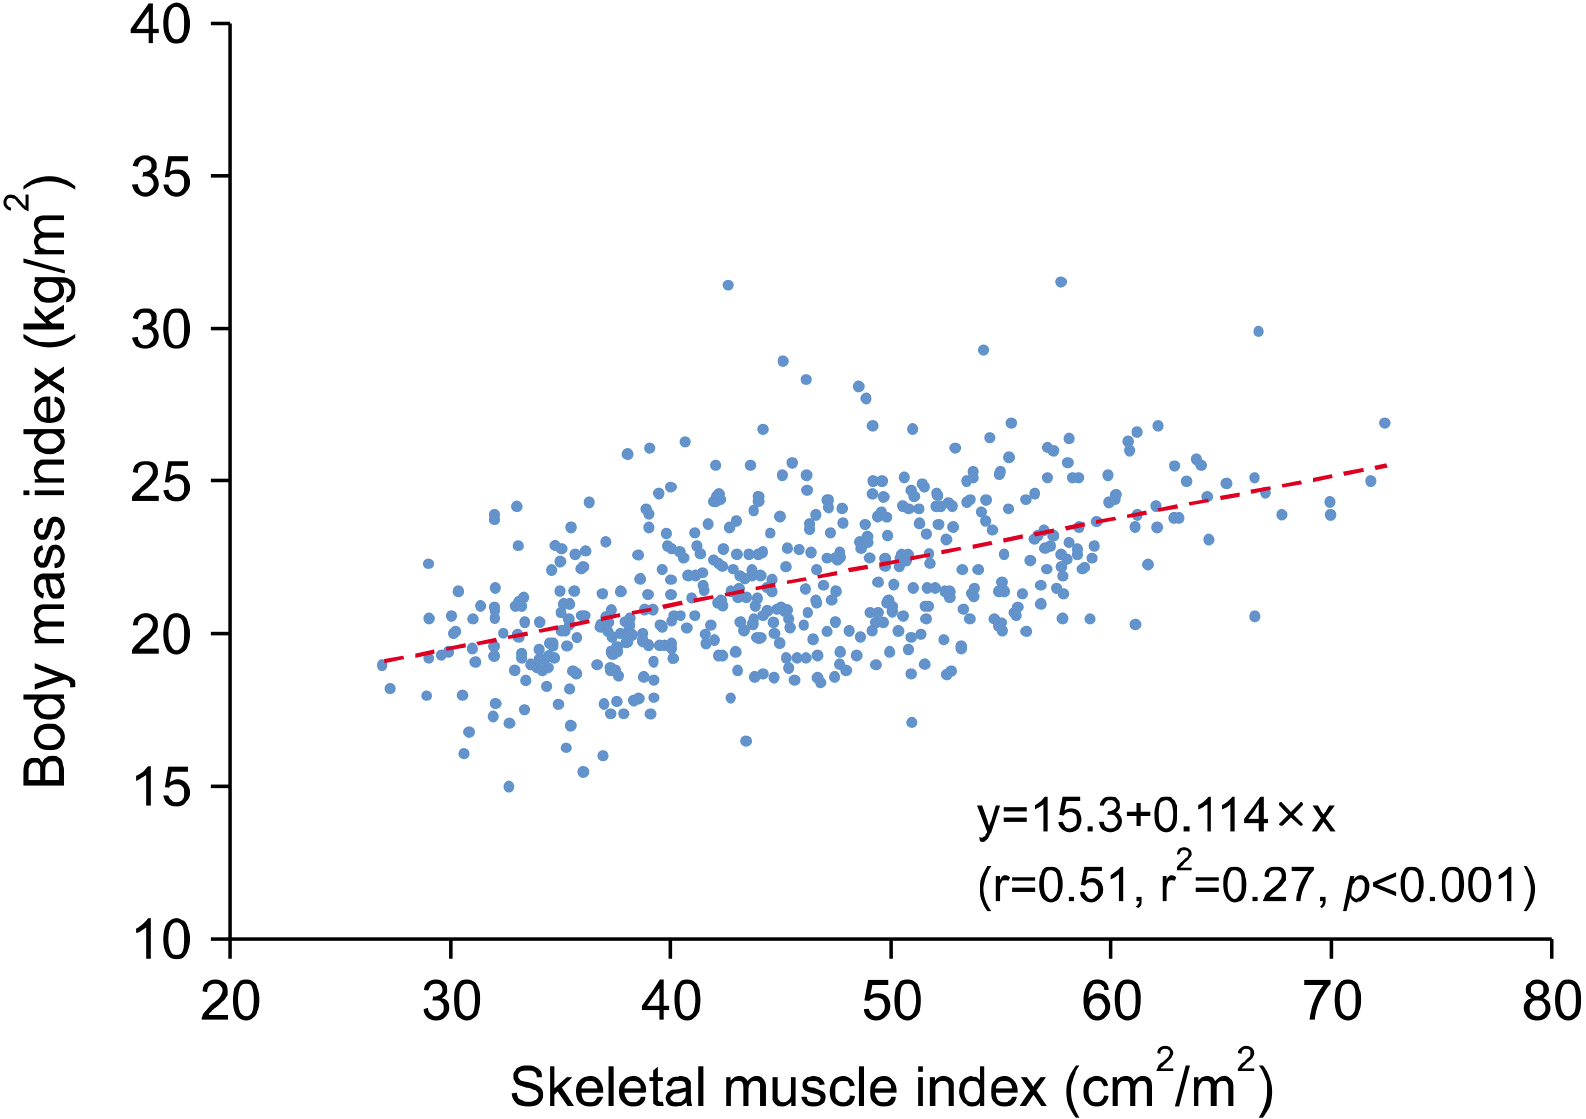
There was a crude correlation between L3SMI and BMI (Fig. 5), in which the regression equation for BMI was as follows: BMI (kg/m2)=15.3+0.114×L3SMI (cm2/m2) (r=0.51, r2=0.27, p<0.001). The Spearman correlation coefficient ρ was 0.72 for the correlation between BMI and L3SMI (p<0.001).

DISCUSSION

Currently, there are more than 16 formulae for SLV calculation since the first introduced in 1995 by Urata et al.1 We presented our first SLV formula in 199710 and the second formula in 2015.3 Because CT volumetry has been often used for liver volume assessment in patients with huge hepatocellular carcinoma or other hepatobiliary malignancies combined with liver cirrhosis, SLV formula derived from CT volumetry was selected. However, we previously reported that comparisons between the pre-existing formula-based SLV and individual TLVs showed volume errors of more than 10%, regardless of SLV formula type. When our SLV formula was validated with the native mother population, the mean proportion of volume error was still 10.5%, primarily due to the innate wide variability of individual TLVs.2,3,11-13 The presence of a considerable error in SLV derived from BSA-based formulae is natural because of obesity, BMI, sex, aging changes, and other factors.
In order to accurately predict the SLV, we testified the L3SMI-based formula for SLV calculation in the present study. However, unlike our expectation, SLV calculation with L3SMI-based formula was not superior to that with the conventional BSA-based formula. To the best of our knowledge, the present study is the first attempt to estimate SLV using L3SMI.
L3SMI has been frequently studied as a surrogate marker of sarcopenia. Sarcopenia is defined as low L3SMI (lower than 41 cm2/m2 for women and lower than 53 cm2/m2 for men in Western countries).14 L3SMI has been found to be clinically predictive and associated with clinical endpoints such as survival and length of hospitalization in various patients’ populations including post-liver transplantation and in various cancer types.4-8,15-17 According to the abovementioned definition, 146 (58.4%) of 250 male donors and 154 (61.5%) of 250 female donors were regarded as individuals with sarcopenia. Considering that all of them were regarded as normally healthy in the Korean society, the abovementioned definitions of sarcopenia using L3SMI should be revised to reliably apply to the Korean population.18
Aging processes are inevitably accompanied by structural and functional changes in vital organs. Skeletal muscle, which accounts for 40% of total body weight, deteriorates quantitatively and qualitatively with aging. Skeletal muscle is known to play diverse crucial physical and metabolic roles in humans. Sarcopenia is a condition characterized by significant loss of muscle mass and strength. It is related to subsequent frailty and instability in the elderly population. Because muscle tissues have multiple functions, sarcopenia is closely related to various adverse health outcomes. In practical terms, various skeletal muscle mass indices have been suggested for assessing sarcopenia, including appendicular skeletal muscle mass adjusted for height squared, weight, or body mass index.18 Different prevalence and clinical implications of sarcopenia are highlighted by each definition. Discordances among these indices have emerged as an issue in defining sarcopenia. A unifying definition for sarcopenia has not been attained yet.18,19
This study has some limitations. This was a high-volume but retrospective single-center study. Further validation studies with a high number of healthy individuals are necessary to obtain more reliable results.
In conclusion, the results of this study suggest that SLV calculation with L3SMI-based formula does not appear to be superior to the currently available BSA-based formulae.

Notes

CONFLICT OF INTEREST

The authors have no potential conflicts of interest relevant to this study to disclose.

AUTHOR CONTRIBUTIONS

Conceptualization: SH. Data curation: GY, SH. Formal analysis: SH, GWS. Methodology: GWS, DHJ. Project administration: SH. Visualization: SH. Writing - original draft: SH. Writing - review & editing: All.

REFERENCES

1. Urata K, Kawasaki S, Matsunami H, Hashikura Y, Ikegami T, Ishizone S, et al. 1995; Calculation of child and adult standard liver volume for liver transplantation. Hepatology. 21:1317–1321. DOI: 10.1002/hep.1840210515. PMID: 7737637.
crossref
2. Pomposelli JJ, Tongyoo A, Wald C, Pomfret EA. 2012; Variability of standard liver volume estimation versus software-assisted total liver volume measurement. Liver Transpl. 18:1083–1092. DOI: 10.1002/lt.23461. PMID: 22532341.
crossref
3. Hwang S, Ha TY, Song GW, Jung DH, Ahn CS, Moon DB, et al. 2015; Quantified risk assessment for major hepatectomy via the indocyanine green clearance rate and liver volumetry combined with standard liver volume. J Gastrointest Surg. 19:1305–1314. DOI: 10.1007/s11605-015-2846-8. PMID: 25947549.
crossref
4. Fearon K, Strasser F, Anker SD, Bosaeus I, Bruera E, Fainsinger RL, et al. 2011; Definition and classification of cancer cachexia: an international consensus. Lancet Oncol. 12:489–495. DOI: 10.1016/S1470-2045(10)70218-7.
crossref
5. Montano-Loza AJ, Meza-Junco J, Baracos VE, Prado CM, Ma M, Meeberg G, et al. 2014; Severe muscle depletion predicts postoperative length of stay but is not associated with survival after liver transplantation. Liver Transpl. 20:640–648. DOI: 10.1002/lt.23863. PMID: 24678005.
crossref
6. Shen W, Punyanitya M, Wang Z, Gallagher D, St-Onge MP, Albu J, et al. 2004; Total body skeletal muscle and adipose tissue volumes: estimation from a single abdominal cross-sectional image. J Appl Physiol (1985). 97:2333–2338. DOI: 10.1152/japplphysiol.00744.2004. PMID: 15310748.
crossref
7. Golse N, Bucur PO, Ciacio O, Pittau G, Sa Cunha A, Adam R, et al. 2017; A new definition of sarcopenia in patients with cirrhosis undergoing liver transplantation. Liver Transpl. 23:143–154. DOI: 10.1002/lt.24671. PMID: 28061014.
crossref
8. Prado CM, Lieffers JR, McCargar LJ, Reiman T, Sawyer MB, Martin L, et al. 2008; Prevalence and clinical implications of sarcopenic obesity in patients with solid tumours of the respiratory and gastrointestinal tracts: a population-based study. Lancet Oncol. 9:629–635. DOI: 10.1016/S1470-2045(08)70153-0.
crossref
9. Mosteller RD. 1987; Simplified calculation of body-surface area. N Engl J Med. 317:1098. DOI: 10.1056/NEJM198710223171717. PMID: 3657876.
crossref
10. Hwang S, Lee SG, Lee YJ, Park KM, Jeon HB, Kim PN, et al. 1997; Calculation of standard liver volume of Korean adults. Korean J Hepatobiliary Pancreat Surg. 1:59–65.
11. Hashimoto T, Sugawara Y, Tamura S, Hasegawa K, Kishi Y, Kokudo N, et al. 2006; Estimation of standard liver volume in Japanese living liver donors. J Gastroenterol Hepatol. 21:1710–1713. DOI: 10.1111/j.1440-1746.2006.04433.x. PMID: 16984594.
crossref
12. Yuan D, Lu T, Wei YG, Li B, Yan LN, Zeng Y, et al. 2008; Estimation of standard liver volume for liver transplantation in the Chinese population. Transplant Proc. 40:3536–3540. DOI: 10.1016/j.transproceed.2008.07.135. PMID: 19100432.
crossref
13. Poovathumkadavil A, Leung KF, Al Ghamdi HM, Othman Iel H, Meshikhes AW. 2010; Standard formula for liver volume in Middle Eastern Arabic adults. Transplant Proc. 42:3600–3605. DOI: 10.1016/j.transproceed.2010.07.098. PMID: 21094823.
crossref
14. Martin L, Birdsell L, Macdonald N, Reiman T, Clandinin MT, McCargar LJ, et al. 2013; Cancer cachexia in the age of obesity: skeletal muscle depletion is a powerful prognostic factor, independent of body mass index. J Clin Oncol. 31:1539–1547. DOI: 10.1200/JCO.2012.45.2722. PMID: 23530101.
crossref
15. Kim EY, Kim YS, Park I, Ahn HK, Cho EK, Jeong YM. 2015; Prognostic significance of CT-determined sarcopenia in patients with small-cell lung cancer. J Thorac Oncol. 10:1795–1799. DOI: 10.1097/JTO.0000000000000690. PMID: 26484630.
crossref
16. Kim EY, Lee HY, Kim YS, Park I, Ahn HK, Cho EK, et al. 2018; Prognostic significance of cachexia score assessed by CT in male patients with small cell lung cancer. Eur J Cancer Care (Engl). 27:e12695. DOI: 10.1111/ecc.12695. PMID: 28426181.
crossref
17. Zheng ZF, Lu J, Zheng CH, Li P, Xie JW, Wang JB, et al. 2017; A novel prognostic scoring system based on preoperative sarcopenia predicts the long-term outcome for patients after r0 resection for gastric cancer: experiences of a high-volume center. Ann Surg Oncol. 24:1795–1803. DOI: 10.1245/s10434-017-5813-7. PMID: 28213789.
crossref
18. Kim KM, Jang HC, Lim S. 2016; Differences among skeletal muscle mass indices derived from height-, weight-, and body mass index-adjusted models in assessing sarcopenia. Korean J Intern Med. 31:643–650. DOI: 10.3904/kjim.2016.015. PMID: 27334763. PMCID: PMC4939509.
crossref
19. Merrill Z, Perera S, Chambers A, Cham R. 2019; Age and body mass index associations with body segment parameters. J Biomech. 88:38–47. DOI: 10.1016/j.jbiomech.2019.03.016. PMID: 30914188.
crossref

Fig. 1
Samples of skeletal muscle area measurement at the third lumbar vertebra level (L3). (A) A 19-year-old male with body mass index (BMI) 20.8 kg/m2, skeletal muscle index at L3 (L3SMI) 55.6 cm2/m2, total liver volume 1210 (TLV) ml, and L3SMI-based standard liver volume (SLV) 1294 ml. (B) A 28-year-old male with BMI 24.6 kg/m2, L3SMI 53.2 cm2/m2, TLV 1329 ml, and L3SMI-based SLV 1265 ml. (C) A 31-year-old female with BMI 22.5 kg/m2, L3SMI 47.5 cm2/m2, TLV 1066 ml, and L3SMI-based SLV 1197 ml. (D) A 21-year-old female with BMI 28.9 kg/m2, L3SMI 45.1 cm2/m2, TLV 1071 ml, and L3SMI-based SLV 1169 ml.
ahbps-25-2-192-f1.tif
Fig. 2
Scatter plots of standard liver volume formulae using body surface area (A) and skeletal muscle index (B) in 500 donors.
ahbps-25-2-192-f2.tif
Fig. 3
Scatter plots of standard liver volume formulae using body surface area (A) and skeletal muscle index (B) in 250 male donors.
ahbps-25-2-192-f3.tif
Fig. 4
Scatter plots of standard liver volume formulae using body surface area (A) and skeletal muscle index (B) in 250 female donors.
ahbps-25-2-192-f4.tif
Fig. 5
Scatter plots for correlation between the skeletal muscle index and body mass index in 500 donors.
ahbps-25-2-192-f5.tif
Table 1
Demographic and anthropometric profiles of 500 living donors
Variables All donors (n=500) Male donors (n=250) Female donors (n=250) p-value


Mean±SD Median (range) Mean±SD Mean±SD
Age (years) 26.8±8.7 24.0 (16–56) 24.5±7.7 29.1±9.2 <0.001
Height (cm) 167.3±8.6 167.1 (144.2–187.6) 173.7±6.1 160.8±5.3 0.11
Body weight (kg) 60.9±9.5 59.8 (40–91.7) 66.8±8.2 55.1±6.7 0.001
Body surface area (m2) 1.68±0.16 1.67 (1.32–2.14) 1.79±0.13 1.57±0.11 0.006
Body mass index (kg/m2) 21.7±2.5 21.4 (15–31.5) 22.1±2.4 21.3±2.5 0.99
Total liver volume (ml) 1151.8±207.4 1129 (726–1926) 1260.9±192.3 1042.6±158.9 0.003
Standardized total liver volume (ml/m2) 683.8±88.9 673 (487–983) 702.5±87.1 665.0±86.8 0.72
Skeletal muscle area at L3 level (cm2) 131.8±32.7 127 (71–235) 159.1±21.3 104.5±13.6 <0.001
L3 skeletal muscle index (cm2/m2) 45.6±9.0 44.8 (27.0–72.4) 51.9±7.2 39.3±5.7 0.007
TOOLS
Similar articles