

 PDF
PDF Citation
 Print
Print


INTRODUCTION
With the popularization of chest computed tomography (CT) and growing interest in health, the incidence of lung diseases that require early diagnosis has increased significantly. It is important to obtain appropriate lung samples safely to diagnose these. As a result of the development of endobronchial ultrasound (EBUS), increasing numbers of lung diseases are being diagnosed with bronchoscopy.1
Radial probe EBUS (RP-EBUS) uses a rotating transducer that can be inserted with or without a guide sheath (GS) through the bronchoscope's working channel. RP-EBUS produces a 360° (radial) image of the surrounding structures external to the airway wall and allows the real-time detection of a lesion.2 Kurimoto et al.3 reported that the overall diagnostic yield of EBUS with a GS (EBUS-GS) was 81% and 69% for malignant and benign lesions, respectively. A meta-analysis revealed that RP-EBUS had a point specificity of 1.00 (95% confidence interval [CI], 0.99–1.00) and a point sensitivity for the detection of lung cancer of 0.73 (95% CI, 0.70–0.76).4 A more recent study investigating 7,872 lesions showed that the overall weighted diagnostic yield for RP-EBUS was 70.6% (95% CI, 68.0–73.1%). The diagnostic yield was significantly higher for lesions > 2 cm in size and malignant in nature.5
The bronchus sign on CT scan is associated with an accurate diagnosis. The diagnostic yields of RP-EBUS in bronchus sign positive and negative peripheral pulmonary lesions (PPLs) on CT scan were 76.5% (95% CI, 65.9–85.6%) and 52.4% (95% CI, 37.6–67.0%), respectively.567 Until now, no study has focused on the utility of RP-EBUS guided transbronchial lung biopsy (RP-EBUS-TBLB) in bronchus sign negative PPLs on thin-section CT. In this study, we evaluated the EBUS visualization and diagnostic yield of RP-EBUS in bronchus sign negative PPLs and identified the factors associated with the EBUS visualization yield and diagnostic yield. The complications of RP-EBUS-TBLB in bronchus sign negative PPLs were also investigated.
Go to : 
METHODS
Study design and subjects
From January 2019 to August 2020, a total of 685 RP-EBUS were performed at our institution. We performed a retrospective observational study of 109 consecutive patients (15.9%) who underwent RP-EBUS in bronchus sign negative PPLs at Yeungnam University Hospital (a 930-bed, university-affiliated, tertiary referral hospital in Daegu, South Korea). All EBUS visualization lesions (n = 68) were biopsied with RP-EBUS-TBLB. Of the 41 EBUS non-visualization lesions, 30 were definitively diagnosed on clinical course, chest CT, bronchoalveolar lavage fluid, microbiological results, percutaneous transthoracic needle biopsy, EBUS-transbronchial needle aspiration, or surgical resection. Lung lesion that is neither benign nor malignant was defined as indefinite. From among all patients, 17 were without a definitive diagnosis (Fig. 1).

CT and bronchoscopy
All patients underwent thin-section chest CT (0.75 mm slice thickness at intervals of 0.75 mm; SOMATOM Definition AS 64-slice CT system; Siemens Healthcare, Erlangen, Germany) less than 7 days ahead of EBUS-GS. Three experienced pulmonologists (Hong KS, Jang JG, Ahn JH) reviewed the chest CT images together before the procedure and planned a bronchial route to reach the target lesion without using a virtual bronchoscopic navigation (VBN) system.8 In all cases, we identified a target bronchus to approach the target lesion. The bronchus sign on CT was defined as the presence of a bronchus leading to the target lesion. Referring to previous literature, we defined as bronchus sign negative in case of type B or type C. In type A, the bronchus clearly approach inside of the target lesion. In type C, no bronchus detected in relation to the target lesion. Neither A nor C, it was categorized as type B.9 Three pulmonologists independently reviewed chest CT scan and determined the type of CT bronchus sign. In case of disagreement, it was decided through discussion. Of the 109 PPLs, 90 were agreed upon by three reviewers and 19 were disagreed upon and type of CT bronchus sign was decided through discussion. Using the concept of the bronchovascular bundle, an anatomical structure of the normal lung, the nearest bronchus was identified using the pathways of the pulmonary vessels travelling with the bronchus that entered the target PPL. We defined EBUS visualization as an image on EBUS with the probe within or adjacent to the lesion and non-visualization as no visible image of the lesion on EBUS. The distance from the lesion to the pleura was measured as the shortest distance on an axial plane CT scan, as in a previous study.10
All bronchoscopy procedures were performed by three pulmonologists, each with more than 5 years of experience in respiratory medicine. A 4 mm bronchoscope (BF P260F; Olympus, Tokyo, Japan) was used to reach the bronchus nearest the target lesion. Then an RP-EBUS (UM S20-17S; Olympus) inside a GS was inserted through the bronchoscope working channel. After the PPL was found, the RP was withdrawn, leaving the GS in place. Then a bronchial brush and biopsy forceps were introduced into the GS, and brushings and biopsy specimens were collected. If the PPL was not found, the examination was completed without a bronchial brush or biopsy. X-ray fluoroscopy was not used.
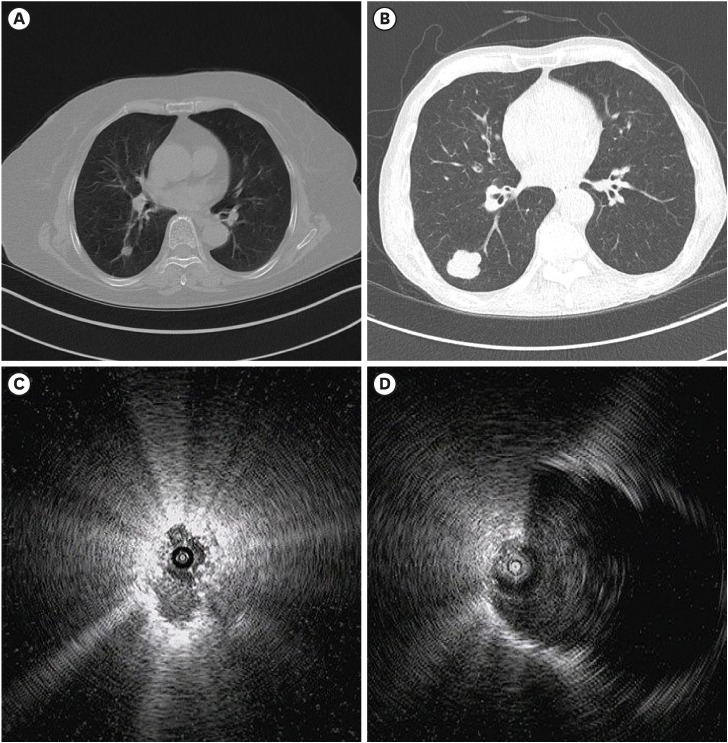
Fig. 2 shows representative cases of RP-EBUS-TBLB with GS in bronchus sign negative PPLs.
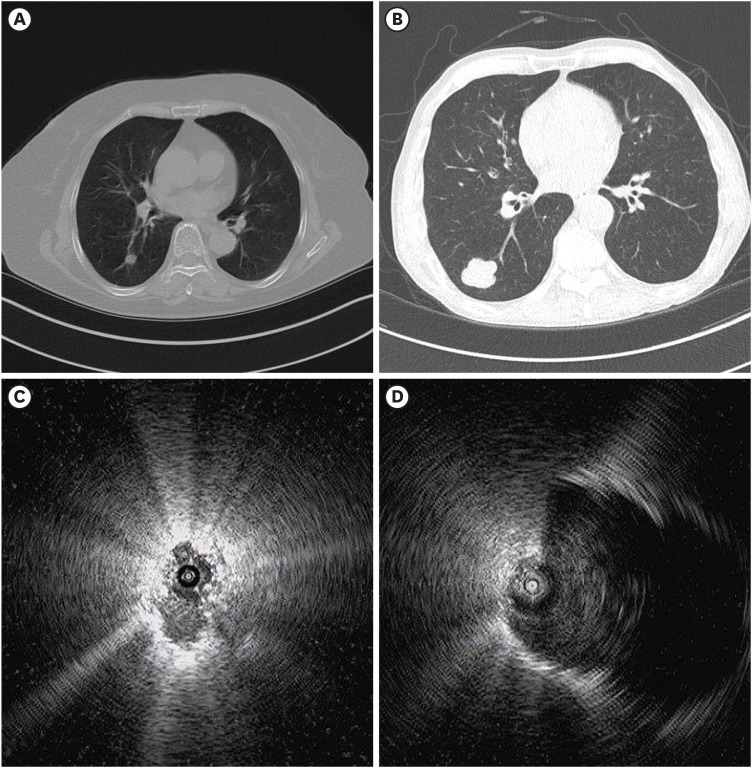 | Fig. 2Representative cases. (A) CT scan showing a 12 mm sized nodule. (B) CT scan showing a 32 mm sized solid nodule. (C) RP-EBUS in the superior segment of the right lower lobe showing an EBUS image within the lesion and biopsy revealed squamous cell carcinoma. (D) RP-EBUS in the superior segment of the right lower lobe showing an EBUS image adjacent to the lesion and biopsy revealed small cell carcinoma.CT = computed tomography, EBUS = endobronchial ultrasound, RP-EBUS = radial probe EBUS.
|
Statistical analyses
Continuous variables are expressed as means ± standard deviations and were compared with Student's t test or the Mann–Whitney U test. Categorical variables are described as frequencies (percentages) and were compared with the χ2 test or Fisher's exact test. Fleiss' kappa was calculated to assess interobserver agreement of CT bronchus sign. We calculated the EBUS visualization yield by dividing the number of EBUS visualization cases by the total number of cases. We calculated the diagnostic yield by dividing the number of diagnostic successes by the total number of cases. To determine the factors for diagnostic yield, we divided the study population into two groups: a diagnostic success group (true-positive and true-negative results) and a diagnostic failure group (false-positive, and false-negative results). EBUS non-visualization and indefinite final diagnosis cases were also considered as false negative. Univariable and multivariable (using the factors with P < 0.1 in univariable analyses) logistic regression analyses were performed to identify the factors affecting the EBUS visualization and diagnostic yields. In all analyses, P < 0.05 under a two-tailed test was considered statistically significant. All statistical procedures were performed with SPSS (version 24.0; IBM, Chicago, IL, USA).
Ethics statement
This study was conducted in accordance with the tenets of the Declaration of Helsinki, and its protocol was reviewed and approved by the institutional review board of Yeungnam University Hospital (YUH IRB 2020-09-025). The requirement for informed consent was waived because of the retrospective study design.
Go to :
RESULTS
Baseline characteristics
The baseline characteristics of the 109 patients according to EBUS visualization status are presented in Table 1. Their mean age was 66.8 ± 12.0 years, and 76 patients were men (69.7%). A total of 53 patients (48.6%) had underlying lung disease, including chronic obstructive pulmonary disease, asthma, idiopathic pulmonary fibrosis, combined pulmonary fibrosis and emphysema, old pulmonary tuberculosis, and pneumoconiosis. The most common location of the lung lesion was the left upper lobe (n = 31, 28.4%), and the mean distance from the pleura to the lung lesion was 12.9 ± 13.5 mm. The PPLs were significantly larger in the EBUS visualization group than in the EBUS non-visualization group (25.3 ± 11.5 mm vs. 19.3 ± 10.4 mm, P = 0.007). The lung lesions were classified as solid (n = 88, 80.7%), part-solid (n = 13, 11.9%), and ground-glass opacity (n = 8, 7.3%). Procedure times were significantly longer in the visualization group (18.2 ± 7.4 min vs. 10.2 ± 5.2 min, P < 0.001).
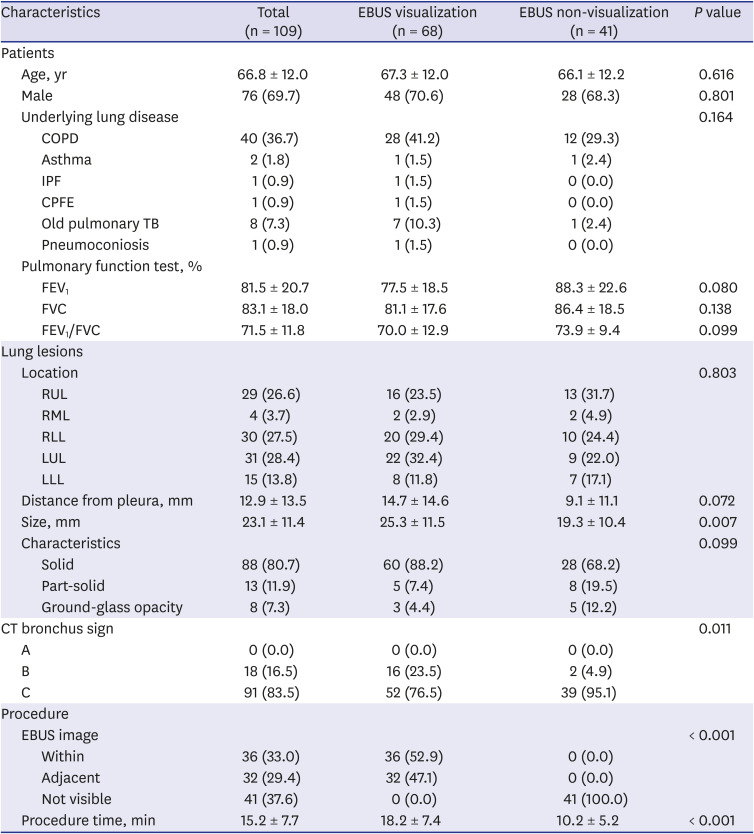
Table 1
Baseline characteristics of the patients
EBUS = endobronchial ultrasound, COPD = chronic obstructive pulmonary disease, IPF = idiopathic pulmonary fibrosis, CPFE = combined pulmonary fibrosis and emphysema, TB = tuberculosis, FEV1 = forced expiratory volume in one second, FVC = forced vital capacity, RUL = right upper lobe, RML = right middle lobe, RLL = right lower lobe, LUL = left upper lobe, LLL = left lower lobe.
![]()
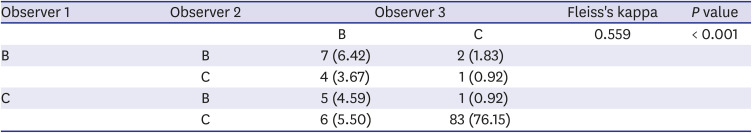
Table 2 shows the interobserver agreement of CT bronchus sign, and Fleiss' Kappa showed moderate agreement (0.559).
Pathologic results and diagnostic performance
The initial pathologic results and final diagnosis are listed in Table 3. Of the 109 lung lesions, 53 (48.6%) were diagnosed as malignant, 39 (35.8%) as benign, and 17 (15.6%) as not definitive. The 41 lesions with biopsy failure due to EBUS non-visualization were ultimately diagnosed as malignant (n = 17), benign (n = 13), and not definitive (n = 11). Of the malignant lesions (n = 53), 29 (54.7%) were diagnosed by RP-EBUS-TBLB. Lesions with false-negatives (n = 7) and EBUS non-visualization (n = 17) were diagnosed as malignant by percutaneous transthoracic needle biopsy (n = 14), surgical resection (n = 6), EBUS transbronchial needle aspiration (n = 3), and bone biopsy (n = 1). Adenocarcinoma of the lung (n = 26, 49.1%) was the most common diagnosis among definitive malignant diagnoses. Among the benign lesions (n = 39), pneumonia (n = 16, 41.0%) was the most common diagnosis among definitive benign features. The diagnostic performance of RP-EBUS-TBLB in bronchus sign negative PPLs is summarized in Table 4. The sensitivity, specificity, positive predictive value, negative predictive value, and diagnostic accuracy of RP-EBUS-TBLB were 34.9% (29/83), 100% (26/26), 100% (29/29), 32.5% (26/80), and 50.5% (55/109), respectively. The diagnostic performance of RP-EBUS-TBLB was better in PPLs ≥ 20 mm.
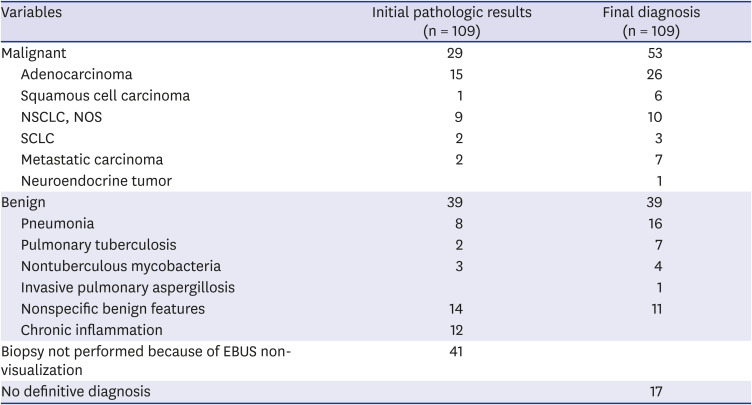
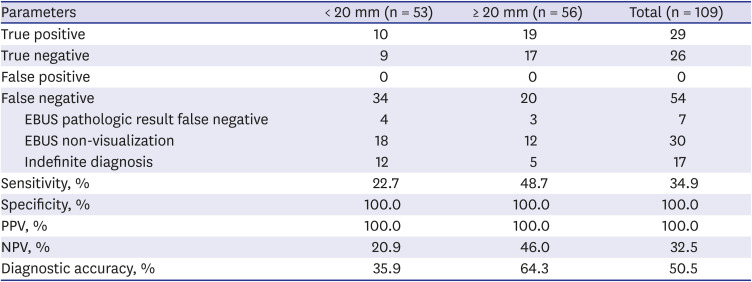
Table 3
Initial pathologic results and final diagnosis
NSCLC = non-small cell lung cancer, NOS = not otherwise specified, SCLC = small cell lung cancer, EBUS = endobronchial ultrasound.
![]()
Table 4
Diagnostic performance of radial probe EBUS-guided transbronchial lung biopsy in bronchus sign negative peripheral pulmonary lesions (n = 109)
Values are presented as number, unless otherwise indicated.
EBUS = endobronchial ultrasound, NPV = negative predictive value, PPV = positive predictive value.
![]()
Factors affecting EBUS visualization
In the patients with RP-EBUS performed in bronchus sign negative PPLs, we investigated the factors affecting EBUS visualization (Table 5). Univariable analyses revealed that larger size (≥ 20 mm; odds ratio [OR], 1.47; 95% CI, 1.08–2.02; P = 0.011), distance from the pleura > 10 mm (OR, 1.40; 95% CI, 1.05–1.87; P = 0.023), and a solid lesion (OR, 1.79; 95% CI, 1.02–3.15; P = 0.011) were significantly associated with EBUS visualization. In the multivariable analyses, larger size (≥ 20 mm; OR, 2.62; 95% CI, 1.16–5.93; P = 0.021) and distance from the pleura > 10 mm (OR, 2.37; 95% CI, 1.02–5.52; P = 0.045) were independent factors affecting EBUS visualization.
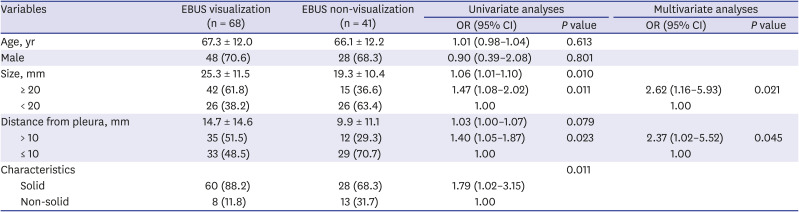
Table 5
Factors affecting EBUS visualization in bronchus sign negative peripheral pulmonary lesions (n = 109)
![]()
Factors affecting diagnostic success
In patients with definitive final diagnoses, we investigated the factors affecting diagnostic success (Table 6). Univariable analyses revealed that larger size (≥ 20 mm; OR, 2.98; 95% CI, 1.37–6.49; P = 0.005), a solid lesion (OR, 4.21; 95% CI, 1.42–12.51; P = 0.007), and an EBUS image with the probe within the lesion (OR, 12.66; 95% CI, 4.37–36.66; P < 0.001) were significantly associated with diagnostic success. In the multivariable analyses, a solid lesion (OR, 14.58; 95% CI, 2.64–80.38; P = 0.002) and an EBUS image with the probe within the lesion (OR, 28.50; 95% CI, 6.26–129.85; P < 0.001) were independent factors affecting diagnostic success.
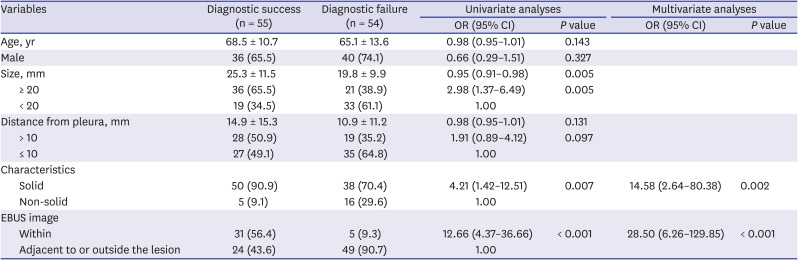
Table 6
Factors affecting diagnostic success in bronchus sign negative peripheral pulmonary lesions (n = 109)
![]()
Complications
Among the total 109 patients, four cases of pneumothorax (3.7%) occurred, but all patients recovered after oxygen therapy and close observation. Hemoptysis occurred in one case (0.9%) and resolved spontaneously.
Go to :
DISCUSSION
The sensitivity, specificity, positive predictive value, negative predictive value, and diagnostic accuracy of RP-EBUS-TBLB in patients with bronchus sign negative were 34.9%, 100%, 100%, 32.5%, and 50.5%, respectively. The diagnostic performance of RP-EBUS-TBLB was better (64.3%) in PPLs ≥ 20 mm. A solid lesion and an EBUS image with the probe within the lesion were independent factors affecting diagnostic success in bronchus sign negative PPLs. The complications of the procedures were comparable to those reported in previous studies conducted mainly in patients with bronchus sign positive PPLs.71112 To the best of our knowledge, this is the first study focusing on the utility of RP-EBUS-TBLB in bronchus sign negative PPLs.
Regarding the diagnostic yield, the presence of the bronchus sign on chest CT is one of the most important factors influencing diagnostic success. This sign means that a bronchus immediately connected with a PPL is detected on CT imaging. A meta-analysis revealed that the overall weighted diagnostic yield was 74.1% (95% CI, 68.3–79.5%) in bronchus sign positive PPLs but 49.6% (95% CI, 39.6–59.5%) in bronchus sign negative PPLs. The OR for diagnostic success in bronchus sign positive PPLs was 3.4 (95% CI, 2.4–5.0).13
Until now, no studies have focused on the utility of RP-EBUS-TBLB for bronchus sign negative PPLs. Two studies included more than 100 cases of bronchus sign negative PPLs, and we can assume the diagnostic yield of RP-EBUS-TBLB for bronchus sign negative PPLs in such studies. Chen et al.6 reported that the overall diagnostic yields of bronchus sign negative PPLs were 51.4% (90/175) and 74.3% (124/167) for PPLs < 3 cm and ≥ 3 cm, respectively, and the overall diagnostic yield was 62.4% (214/343). A previous study that included 146 bronchus sign negative PPLs demonstrated an overall diagnostic yield of 52.1% (76/146).1314 The diagnostic rate of 50.5% (55/109) in our study was comparable to previous studies,61314 and the diagnostic performance was better in PPLs ≥ 20 mm (64.3%) than in those < 20 mm (35.9%).
No studies have investigated the factors associated with diagnostic success in bronchus sign negative PPLs. Our study demonstrated that a solid lesion and an EBUS image with the probe within the lesion are factors affecting diagnostic success. In most previous studies, a solid lesion was not associated with diagnostic success in RP-EBUS-TBLB in multivariable logistic regression analyses.711151617 Although not statistically significant, solid lesions tended to have higher EBUS visualization in our study. We think that this is why a solid lesion was related to diagnostic success in the present study. An EBUS image with the probe within the lesion was very closely related to the success of the diagnosis (OR, 28.50) in the bronchus sign negative PPLs, which agrees with most previous studies, including those on bronchus sign positive PPLs.67121516
EBUS visualization is very important for diagnostic success in RP-EBUS-TBLB.61216 This can be predicted by whether a bronchus sign is present on chest CT. Minezawa et al.9 explored the relationship between CT bronchus sign and EBUS findings and found that they correlated strongly with each other. In that study, when the bronchus clearly reached the inside of the target lesion on chest CT, nearly 70% of lesions gave an EBUS image with the probe within the lesion and 20% of lesions gave one with the probe adjacent. However, when no bronchus could be detected in relation to the lesion on chest CT, only 50% of lesions gave an EBUS image with the probe within or adjacent to the lesion. In our study, the visualization yield (62.4%, 68/109) was a little higher than in the study by Minezawa et al.9
In our study, the EBUS visualization yield was 62.4%, lower than previous published studies, which achieved EBUS visualization in 72–79% of PPLs.1018 Our study only enrolled bronchus sign negative PPLs; thus, we expected that the EBUS visualization yield would be lower. Larger size (≥ 20 mm) and distance from the pleura > 10 mm were independent factors affecting EBUS visualization in our study, which agrees with previous studies.1018
This study has several limitations. First, because it was a retrospective study conducted at a single center with relatively few bronchus sign negative PPLs, the results cannot be generalized. External validation is needed in the future with a large cohort study. Second, the slice thickness of the chest CT varies by study; in those related to RP-EBUS, it varies from 0.5 to 1.0 mm. The slice thickness can affect whether the bronchus sign is present. Our study used 0.75 mm, which is quite similar to previous studies. Third, the diagnostic yield of RP-EBUS-TBLB can be affected by the use of additional modalities, such as GS, fluoroscopic guidance, and VBN. We performed TBLB using GS without fluoroscopic guidance or VBN. Thus, the diagnostic yield could be improved by combining the technique with fluoroscopic guidance and VBN in bronchus sign negative PPLs. Studies using multimodal investigation in bronchus sign negative PPLs are needed.
In conclusion, RP-EBUS-TBLB using a GS can be considered a diagnostic method in bronchus sign negative solid PPLs. EBUS visualization can be expected from PPLs with a larger size and from those that are far from the pleura on CT. Having the probe within the lesion and a solid lesion are important for diagnostic success.
Go to :
 XML Download