

 PDF
PDF Citation
 Print
Print


In patients undergoing liver transplantation (LT), neurological events are relatively common due to several underlying conditions such as the degree of preoperative hepatic encephalopathy (HE), metabolic impairments, history of alcoholism, and severe ascites. Impaired liver function due to liver cirrhosis causes frequent electrolyte imbalance, kidney injury, infection, and HE.1,2 In addition, long and complicated surgical procedures with extensive intraoperative blood loss and transfusion, long recovery periods in the intensive care unit (ICU) and postoperative use of narcotic analgesics and immunosuppression may contribute to postoperative neurological complications after LT.3,4 The incidence of delirium after LT has been reported to vary, between 13 % and 42 %.1,5–7 Post-transplant delirium is highly associated with mortality and morbidity, and increases medical expenses due to a prolonged intensive care unit stay and hospital stay.3,8 Cognitive impairment has been observed for at least several days to weeks, although the course is reversible. Therefore, it is important to identify a group of patients with a high risk of postoperative delirium and to correct the adjustable risk factors at an earlier stage. It is reported that the use of narcotic analgesics postoperatively decreases the activity of acetylcholine, while increase the activity of dopamine, thereby causing delirium.9 However, even if proper pain control is not performed, delirium is also likely to occur.10,11 Patient-controlled intravenous analgesia (PCIA) makes it easy to control pain after surgery thereby reducing the extent of usage of narcotic analgesics. The purpose of this study is to compare the incidence of delirium in patients with and without the PCIA after LT.
MATERIALS AND METHODS
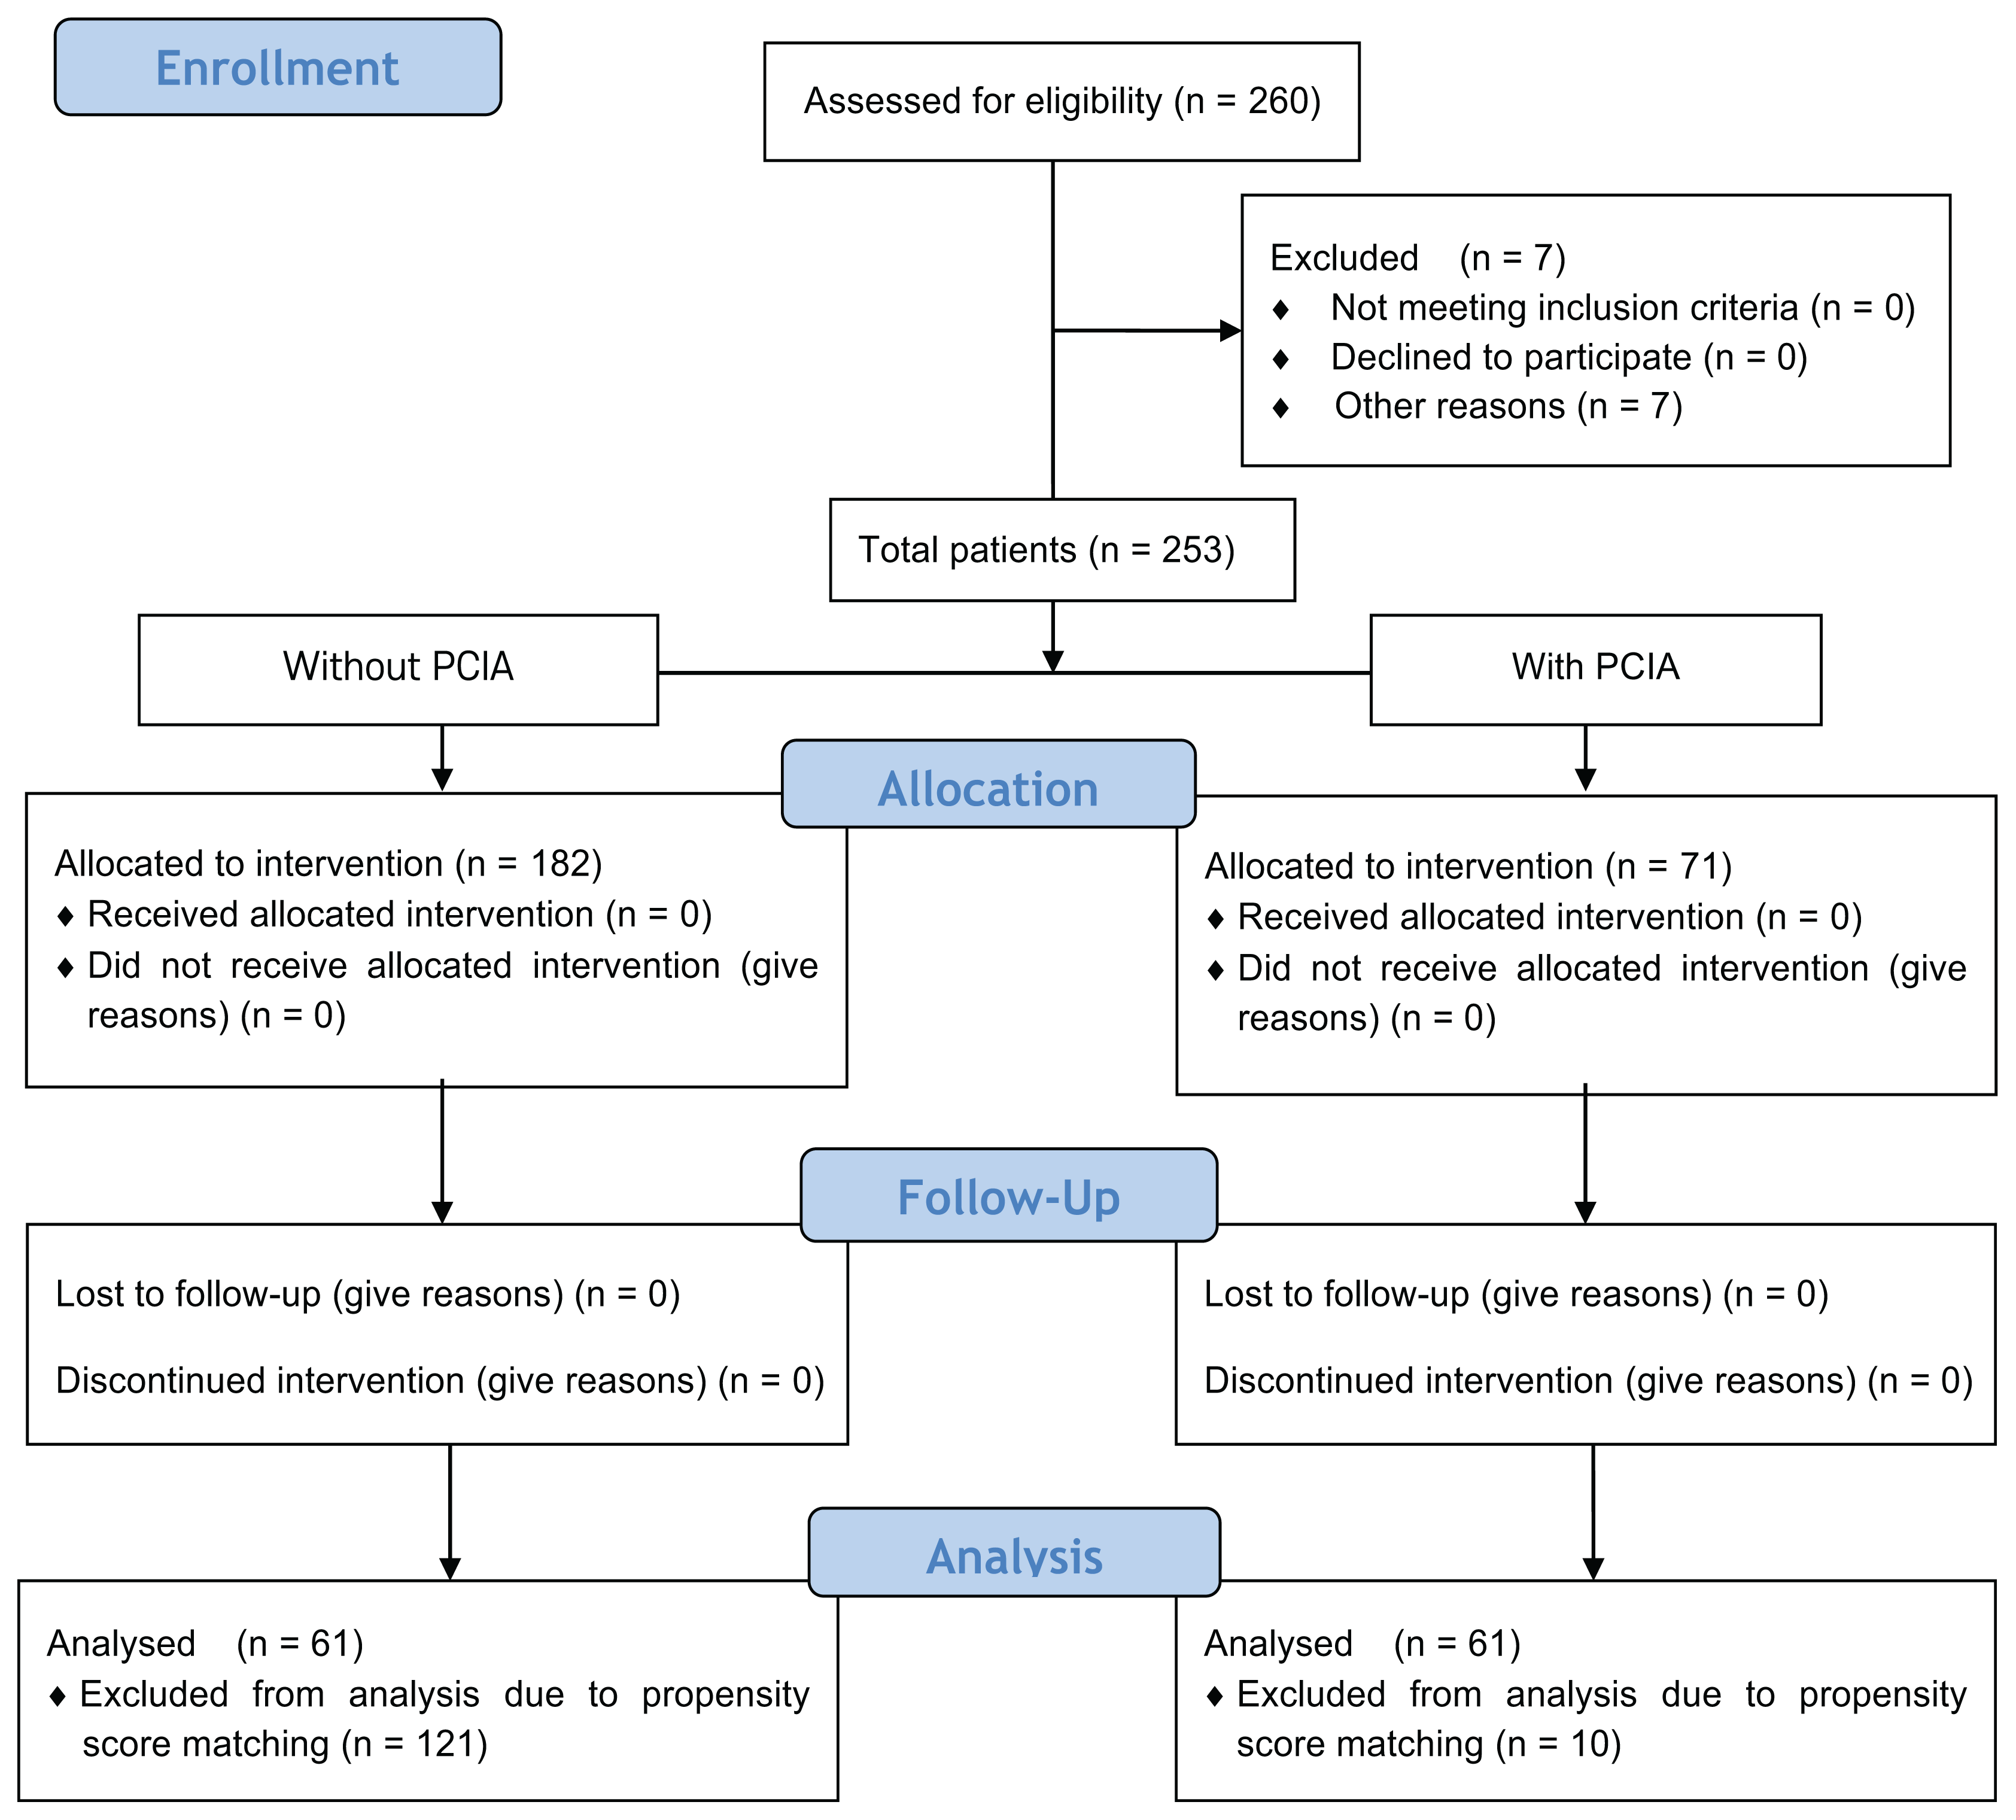
This study was approved by the hospital clinical research committee (IRB No. 05-2019-034) and the requirement for written informed consent was waived by the IRB. The computerized data of medical records of 260 patients who underwent LT from January 1, 2010 to July 31, 2017 were evaluated and the results are presented in Figure 1. After excluding 7 patients who underwent re-transplantation or additional surgery, and missing data, the study cohort consisted of 253 patients and was divided into two groups: patients who had used PCIA (P group, n = 71) and those who did not use PCIA (C group, n = 182) after LT in the ICU.
Data collection
Through computerized data collection, basic demographic information of patients, details of laboratory tests and treatments were extracted before, during, and after surgery. Patient records were collected through preoperative anesthetic records, anesthetic records, intensive care unit records, progress notes, nursing records and discharge notes.
The definitions of variables are as follows. For preoperative examination, tests performed within 1 day before surgery were used. Post-surgical laboratory tests used tests performed within 1 day of surgery. Postoperative complications were collected based on discharge records.
Delirium was defined as patients with symptoms and signs consistent with the DSM-IV criteria who were treated with a haloperidol or other medication, or patients who were diagnosed in psychiatry by using the mini-mental status examination and confusion assessment method in the nursing records, prescription records, and consulting records.
Cardiac complications were defined as cases of heart-related diseases such as arrhythmia and angina pectoris, and respiratory complications were defined as cases of respiratory infections such as pneumonia. Neurological complications were the cases with a record of treatment for a neurological problem such as brain hemorrhage. In the case of infection, it was defined as the occurrence of infection at the surgical site. Death was defined as death during hospitalization after surgery. Acute rejection after LT was confirmed by pathological examination within 6 months after transplantation.
Management Protocol
LT and anesthesia were performed using conventional methods. General anesthesia was induced using 1 – 2 mg/kg of propofol and muscle relaxant such as 0.6 – 1 mg/kg of rocuronium or 0.1 – 0.2 mg/kg of cisatracurium. Inhaled anesthetic gases of sevoflurane or desflurane were treated with an oxygen/air mixture of 40 – 50 % fraction of inspired oxygen. Remifentanil (range, 0.5 – 10 mcg/kg/h) and muscle relaxant (rocuronium: range, 0.3 – 0.6 mg/kg/h; or cisatracurium: range, 0.1 – 0.2 mg/kg/h) were infused during the operation. All patients had standard monitoring with electrocardiography, along with observation of end-tidal carbon dioxide concentration, bispectral index, peripheral oxygen saturation, and cerebral blood oxygenation, and invasive arterial monitoring with radial and femoral artery were applied. Central venous oxygen saturation monitoring (PreSep, Edwards Lifesciences, Irvine, Calif., USA) was performed to evaluate the volume status using an EV1000 monitoring platform (Edwards Lifesciences) to monitor stroke volume, stroke volume index, cardiac output, cardiac index, central venous oxygen saturation, and systemic vascular resistance. Blood transfusion was performed to maintain the hematocrit level at 25 – 30 %, and blood pressure was maintained with a systolic blood pressure of 90 mmHg and an average arterial pressure of 60 mmHg or more using norepinephrine (0.01 – 0.4 mcg/kg/min). If norepinephrine was ineffective, dobutamine, vasopressin and epinephrine were considered. After the completion of surgery, the patient was moved to the ICU.
The patients in group P used disposable PCIA device (Accufuser Plus®, WooYoung Medical, Korea) containing 1,500 μg of fentanyl diluted to 100 ml in normal saline; the basal rate was set to 1 ml/h, with a bolus of 1 ml and a lock-out time of 15 min. The patients in group C received intravenous fentanyl whenever pain control was needed. All patients were given enough fentanyl until the pain score on the numeric rating scale was 3 or less.
Statistical analysis
Data were analyzed using Statistical Analysis System version 9.3 (SAS Institute, USA) and R software version 3.3.2 (R Project for Statistical Computing, Austria). Data are expressed as mean ± standard deviation, median (25 to 75 percentile), or the number of patients (%). The normality test was performed with the Shapiro-Wilk W test or Kolmogorov-Smirnov. The independent t-test or Wilcoxon rank-sum test was used for continuous variables for comparison between the two groups. The chi-square test or Fisher's exact test was used for categorical variables. To investigate the effect of the PCIA on the incidence of delirium, 1:1 matching was performed using the nearest neighbour matching method using the propensity score. After 1:1 propensity score matching, continuous variables were compared by paired t-test or Wilcoxon signed-rank test, and categorical variables by McNemar’s test. The effect of the PCIA on the incidence of delirium was analysed using univariate analysis and multivariate analysis were analyzed. A P value < 0.05 was considered statistically significant.
RESULTS
The characteristics of patients undergoing LT were analyzed and presented in Table 1. Among patients who underwent LT, 36 / 253 (14.23%) patients were diagnosed with delirium after surgery. Typically, 26 / 182 (14.29 %) patients in Group C and 10/71 (14.09 %) patients in Group P developed postoperative delirium after LT. There was no difference between the two groups (P = 0.967). Patients in Group P had hypertension (P = 0.047) and diabetes mellitus (DM) (P = 0.017) more frequently than those in Group C, but there was no difference between the two groups after matching.
Preoperative laboratory data and perioperative factors in patients undergoing LT are shown in Table 2. Preoperative serum creatinine (Cr) was higher (P = 0.016) and anesthetic duration was longer (P = 0.014) in Group P compared to Group C, but preoperative sodium was higher (P = 0.030) in Group C than in Group P. However, there were no differences except for anesthetic duration (P < 0.0001) between the two groups after matching.
Postoperative data of patients undergoing LT are described in Table 3. Postoperative hemoglobin (Hb) (P = 0.001) and sodium (P = 0.001) were higher in Group C than in Group P and ICU stay was longer (P = 0.007) in Group C. However, after matching, no differences were observed between the groups except for postoperative Hb (P = 0.003) between the two groups. There were no differences in postoperative complications between the two groups.
A logistic regression analysis was performed and PCIA with a P value of 0.1 or less in univariate analysis, body mass index, DM, model for end-stage liver disease (MELD) score, diuretics, sleep disorder, psychiatric medication, Hb before surgery, serum Cr before surgery, intraoperative estimated blood loss, packed red blood cells usage, and bilirubin after surgery were defined (Table 4). Subsequently, multivariate analysis was performed and it was identified that PCIA was not associated with postoperative delirium in univariate analysis (P = 0.967) and multivariate analysis (P = 0.577) (Table 5).
DISCUSSION
In this retrospective review of LT recipients, it was identified that the use of PCIA after surgery was not associated with the incidence of postoperative delirium.
Delirium is an acute change in neurologic state with alteration in the levels of consciousness and attention. Risk factors for postoperative delirium include age 65 years and older, men, impaired cognitive function, hearing and vision impairment, dehydration, nutritional deficiency, psychiatric drugs, chronic internal disease, chronic kidney disease, chronic liver disease, pain, and sleep disorders.7,10,12,13 Furthermore, the condition might be triggered in cases of severe acute diseases such as infection, trauma, surgery, myocardial infarction, electrolyte imbalance, anemia, hypoglycemia, and emotional compression.4,14 Regulatory factors affecting postoperative delirium include postoperative body restraint placement, correcting metabolic and electrolyte abnormalities, use of suppressing drugs such as anesthetics, anticholinergics, benzodiazepine, narcotic analgesics, and anti-Parkinson drugs, controlling moderate pain, blood loss during surgery and blood transfusions, postoperative low albumin levels, less than 30% hematocrit, and oxygen deficiency.11
Postoperative delirium and cognitive decline occur frequently in the patients after LT and cause a prolonged stay at ICU and prolonged mechanical ventilation, as well as increased mortality. Longer stays on the bed, which slows the onset of post-operative exercise, thereby creates difficulties in getting early rehabilitation treatment. 15 Usually the course of postoperative delirium is reversible and has been demonstrated to be associated with long-term neurologic deterioration such as cognitive impairment and dementia. 16,17 As a result, delirium after LT is associated with an increase in post-transplant mortality and morbidity, and rising medical expenses. Recently, with an increase in the number of patients undergoing LT and the survival rate of recipients, interest in post-transplant management has also increased. It is necessary to predict a group of patients who are likely to develop postoperative delirium and to correct the adjustable risk factors at an earlier stage.
Both postoperative pain and the use of narcotic analgesics have been reported to cause postoperative delirium.18–20 Severe preoperative resting pain and an increase in the level of pain during postoperative day one were identified to be independently associated with the risk for the development of postoperative delirium. Reducing pain after surgery can help in reducing delirium. In clinical practice, narcotic analgesics are considered as the most appropriate drugs for acute postoperative pain despite the major side effects of respiratory depression, neurologic alteration including delirium, and constipation, etc. It is almost impossible to avoid the use of narcotic analgesics at all in the post-transplant period, as non-opioid analgesics are not potent enough to alleviate acute surgical pain. However, fentanyl undergoes hepatic biotransformation into inactive metabolites and eliminates through kidney, patients with hepatic and renal insufficiency have increased risk of side effects of this drug.21 Therefore, pain management by using PCIA can effectively control pain while reducing the side effects of bolus injected narcotic analgesics such as transient respiratory depression or hemodynamic instability. Also, using PCIA can reduce the time difference between when pain control is required and when pain medication is administered. It is controversial whether it is safe to use PCIA for postoperative pain control in patients undergoing LT. However, in our study, postoperative PCIA was not an issue in terms of safety in patients undergoing LT.
The prevention and early detection of delirium are important for the treatment and management of liver transplant patients to decrease post LT morbidity and mortality. One of the characteristic aspects of postoperative delirium is that there is a time difference between the operation and the delirium. The patients present with no apparent mental symptoms during the conscious clarity period, and delirium mainly develops within the first 24–48 hours after LT; recovery has been reported to occur within 5 days after surgery.22 There exist numerous diagnostic methods that serve as a standard for diagnosing postoperative delirium, among which DSM - IV and ICD - 10 are widely used.23 In this study, DSM-IV criteria were used to diagnose delirium along with psychiatric cooperation. The possible explanation behind recovery from delirium within 5 days is postoperative normalization of liver function and clearance of metabolites from the transplanted liver in the first few days.24
This study has some limitations. First, the study possibly lacks some variables that can potentially cause delirium after LT due to the retrospective nature of the study. The occurrence of postoperative delirium is likely a multifactorial phenomenon and it is not clear if the effects of various precipitating factors are additive or multiplicative. And total amount of fentanyl used was not investigated. Second, this is a single center study and the included number of cases is small which is insufficient to generalize the relation between PCIA and postoperative delirium. Third, as we focused on delirium in the early postoperative period, incidents of later onset delirium might have been neglected.
In conclusion, it was identified that patients with PCIA after LT were not related to postoperative delirium. Therefore, it is necessary to actively control postoperative pain using PCIA after LT. As our study was limited by its retrospective design, prospective randomized control studies are recommended in the future to confirm our results on PCIA and postoperative delirium in LT recipients. Further study is required to identify modifiable preoperative or postoperative risk factors of delirium after LT.
 XML Download