

 PDF
PDF Citation
 Print
Print


Body protective compound-157 (BPC-157), which is a partial sequence of the natural stable peptide BPC (isolated from human gastric fluid), consists of 15 amino acids (pentade-capeptide): Gly-Glu-en-Pro-Pro-Pro-Gly-Lys-Pro-Ala-Asp-Asp-Ala-Gly-Leu-Val. Many reports cite the abilities of BPC-157 to promote wound healing, increased collagen and new blood vessel formation, decreased myeloperoxidase (MPO) activity and inflammatory cell influx;1 therefore, we thought that BPC-157 could also influence healing after inflammatory pain.
The injection of formalin into the hindpaws of rats induces transient biphasic pain, which is a response that includes a first phase and second phase. The first phase is the direct stimulation of sensory nerve endings by formalin, causing acute pain, and the second phase is an inflammatory response, causing persistent pain.2 This subcutaneous chemical irritant activates peripheral nerves, leading to the activation of dorsal horn neurons.3 It is widely accepted that the initial wave of C-fiber activity in phase 1 leads to phase 2, which depends on the inflammatory response and central sensitization.4 This model is well-suited for reproducing inflammatory pain.
The purpose of this study was to determine whether BPC-157 has antinociceptive effects against formalin-induced transient inflammatory pain in rats. This study examined the following behavioral and histological parameters of inflammatory pain: formalin test results and proinflammatory cytokines (interleukin-1β (IL-1β), interleukin-6 (IL-6), and tumor necrosis factor-α (TNF-α)) contents measured by immunohistochemistry (IHC).
MATERIALS AND METHODS
Animals
The animals had free access to food and drinking water before the experiments. All the experiments followed the Guidelines of Ethical Standards for Investigation of Experimental Pain in Animals.5 Efforts were made to minimize the number of animals used. A total of 134 male Sprague Dawley rats weighing 250–300 g were included. The rats were housed separately at 22–25°C under a 12 h:12 h light cycle.
Drugs
All the drugs were purchased from Sigma Chemical Co. (St. Louis, MO). BPC-157, formalin, and morphine were prepared with physiological normal saline (0.9% weight/volume NaCl). All the drugs were prepared just before use. The pentadecapeptide BPC-157 peptide (a part of the sequence of the human gastric juice protein BPC, which is freely soluble in water at pH 7.0 and in saline) was manufactured with 99% (HPLC) purity (1-des-Gly peptide as an impurity) by Diagen, Ljubljana, Slovenia; the sequence of the peptide was GEPPPGKPADDAGLV, and the M.W. was 1419).1 Morphine was used based on the consideration that it represents the gold standard for potent analgesia.6
Formalin-induced nociceptive behavioral test
Male Sprague Dawley rats (250~300 g) (n = 35) were randomly divided into the control (n = 7), 5 mg/kg morphine (n = 7) and BPC-157 groups (n = 21) to establish the inflammatory pain model and conduct the behavior test. The rats in the BPC-157 group were randomly subdivided and received doses of 10, 20, or 40 μg/kg BPC-157 (n = 7 in each group). All experiments were prepared as in the previous formalin model study.7 These pretreatment doses and times were selected based on other previous studies1,7 and preliminary experiments in which the safety after injection was determined, since we used rats as the experimental animals.
The experimental group received 5 mg/kg morphine, the BPC-157 groups received 10, 20, or 40 μg/kg BPC-157, and the control group received normal saline (all the same volume). The drug administration methods were intraperitoneal (i.p.) injection 60 min before the formalin injection. All experiments were conducted as in the previous formalin model study.7 The number of flinches was counted for 1-min periods at 1 and 10 min (phase 1) and at 10-min intervals from 10 and 60 min (phase 2). The rats were euthanized in a CO2 chamber at the end of the experiment.
DRGs and spinal cords were harvested from the right lumbar segments
Each of 33 rats were used to examine 3 proinflammatory cytokines (IL-1β, IL-6, and TNF-α). These mice were injected with the drugs i.p. 60 min before the formalin injection.1 The sham group (n = 3) that had not been injected and treated with anything was sampled immediately after isoflurane anesthesia. Control (n = 6), 5 mg/kg morphine (n = 6) and 3 BPC-157 groups (n = 18 in each group) and were examined using IHC. It were analyzed by sampling the right lumbar level 4,5,6 dorsal root ganglion (RL4,5,6-DRG) and lumbar level 5 spinal cord (L5-SC) from 3 rats of control, morphine, 3 BPC-157 groups at 5 (representative value of phase 1) and 35 min (representative value of phase 2) after the formalin test.
Immunohistochemistry
Anesthesia was induced with 5% isoflurane in an induction box and maintained with 1.5% isoflurane via a face mask throughout the operation. The left ventricle was perfused intra-aortically with 250 ml of ice-cold, 0.1 M buffer phosphate [containing (mM): 137 NaCl, 2.7 KCl, 10 Na2HPO4, and 2 KH2PO4] with heparin (10000 U/L), pH 7.4, at a flow rate of 18–25 ml/min, followed by 4% paraformaldehyde +12% picric acid solution until transparent liquid flowed from the right ventricle. After decapitation, the RL4,5,6-DRG and L5-SC were extracted and fixed in 4% paraformaldehyde in 0.1 M phosphate buffer (pH 7.4). The samples were fixed in 10% neutral buffered formalin solution for 24 h. Then, the samples were placed inside histology cassettes and processed for permanent paraffin embedding. Paraffin-embedded sections (4 μm) were cut and mounted on a coated glass slide. The tissue sections were then processed by blocking the endogenous peroxidase activity for 10 min, followed by incubation with primary antibodies. The reaction was visualized with VECTOR ImmPRESS REAGENT for 30 min and finally incubated with di-aminobenzidine for 5 min. The primary antibodies used were anti-interleukin-6 (Abcam, Cambridge, UK), anti-interleukin-1β (Abcam, Cambridge, UK), and anti-tumor necrosis factor-α (GeneTex, CA, USA).
The stained cells of both the RL4,5,6-DRG and L5-SC were observed under an optical microscope (Nikon E600, Tokyo, Japan). An SC measurement was performed on the laminae site of the dorsal horn. The image magnification was 100..
Statistical analysis
Similar studies were used to determine the sample size of this study.8 The time-response data and dose-response data are presented as the number of flinches in each phase. The dose-response lines were fitted using least-squares linear regression, and their 95% confidence intervals were calculated according to the previously described method. The dose-response data are presented as % MPE in each phase. The data are presented as the percentage of control.
% MPE (% maximal possible effect) = (control group flinch number of times - experimental group flinch number of times) × 100 / control group flinch number of times
Statistical analysis was carried out by one-way analysis of variance (ANOVA) with a post hoc test. P values less than 0.05 were considered to indicate statistical significance.
Go to : 
RESULTS
Formalin-induced nociceptive behavioral test
The time-effect curves of the control, morphine, and BPC-157 (from 10 to 40 μg/kg) groups for the flinching response in the formalin test are shown in Figure 1. Morphine suppressed the flinches during both the 1st and 2nd phases. Compared with control, 10, 20, and 40 μg/kg BPC-157 suppressed the flinches during the 1st phase but did not suppress the flinches during the 2nd phase. On the dose-response curve of the effect of intraperitoneal BPC-157 on the flinching response in the formalin test, BPC-157 led to significant suppression of the flinches in a dose-dependent manner in phase 1 but showed little effect in phase 2 (Fig. 2).
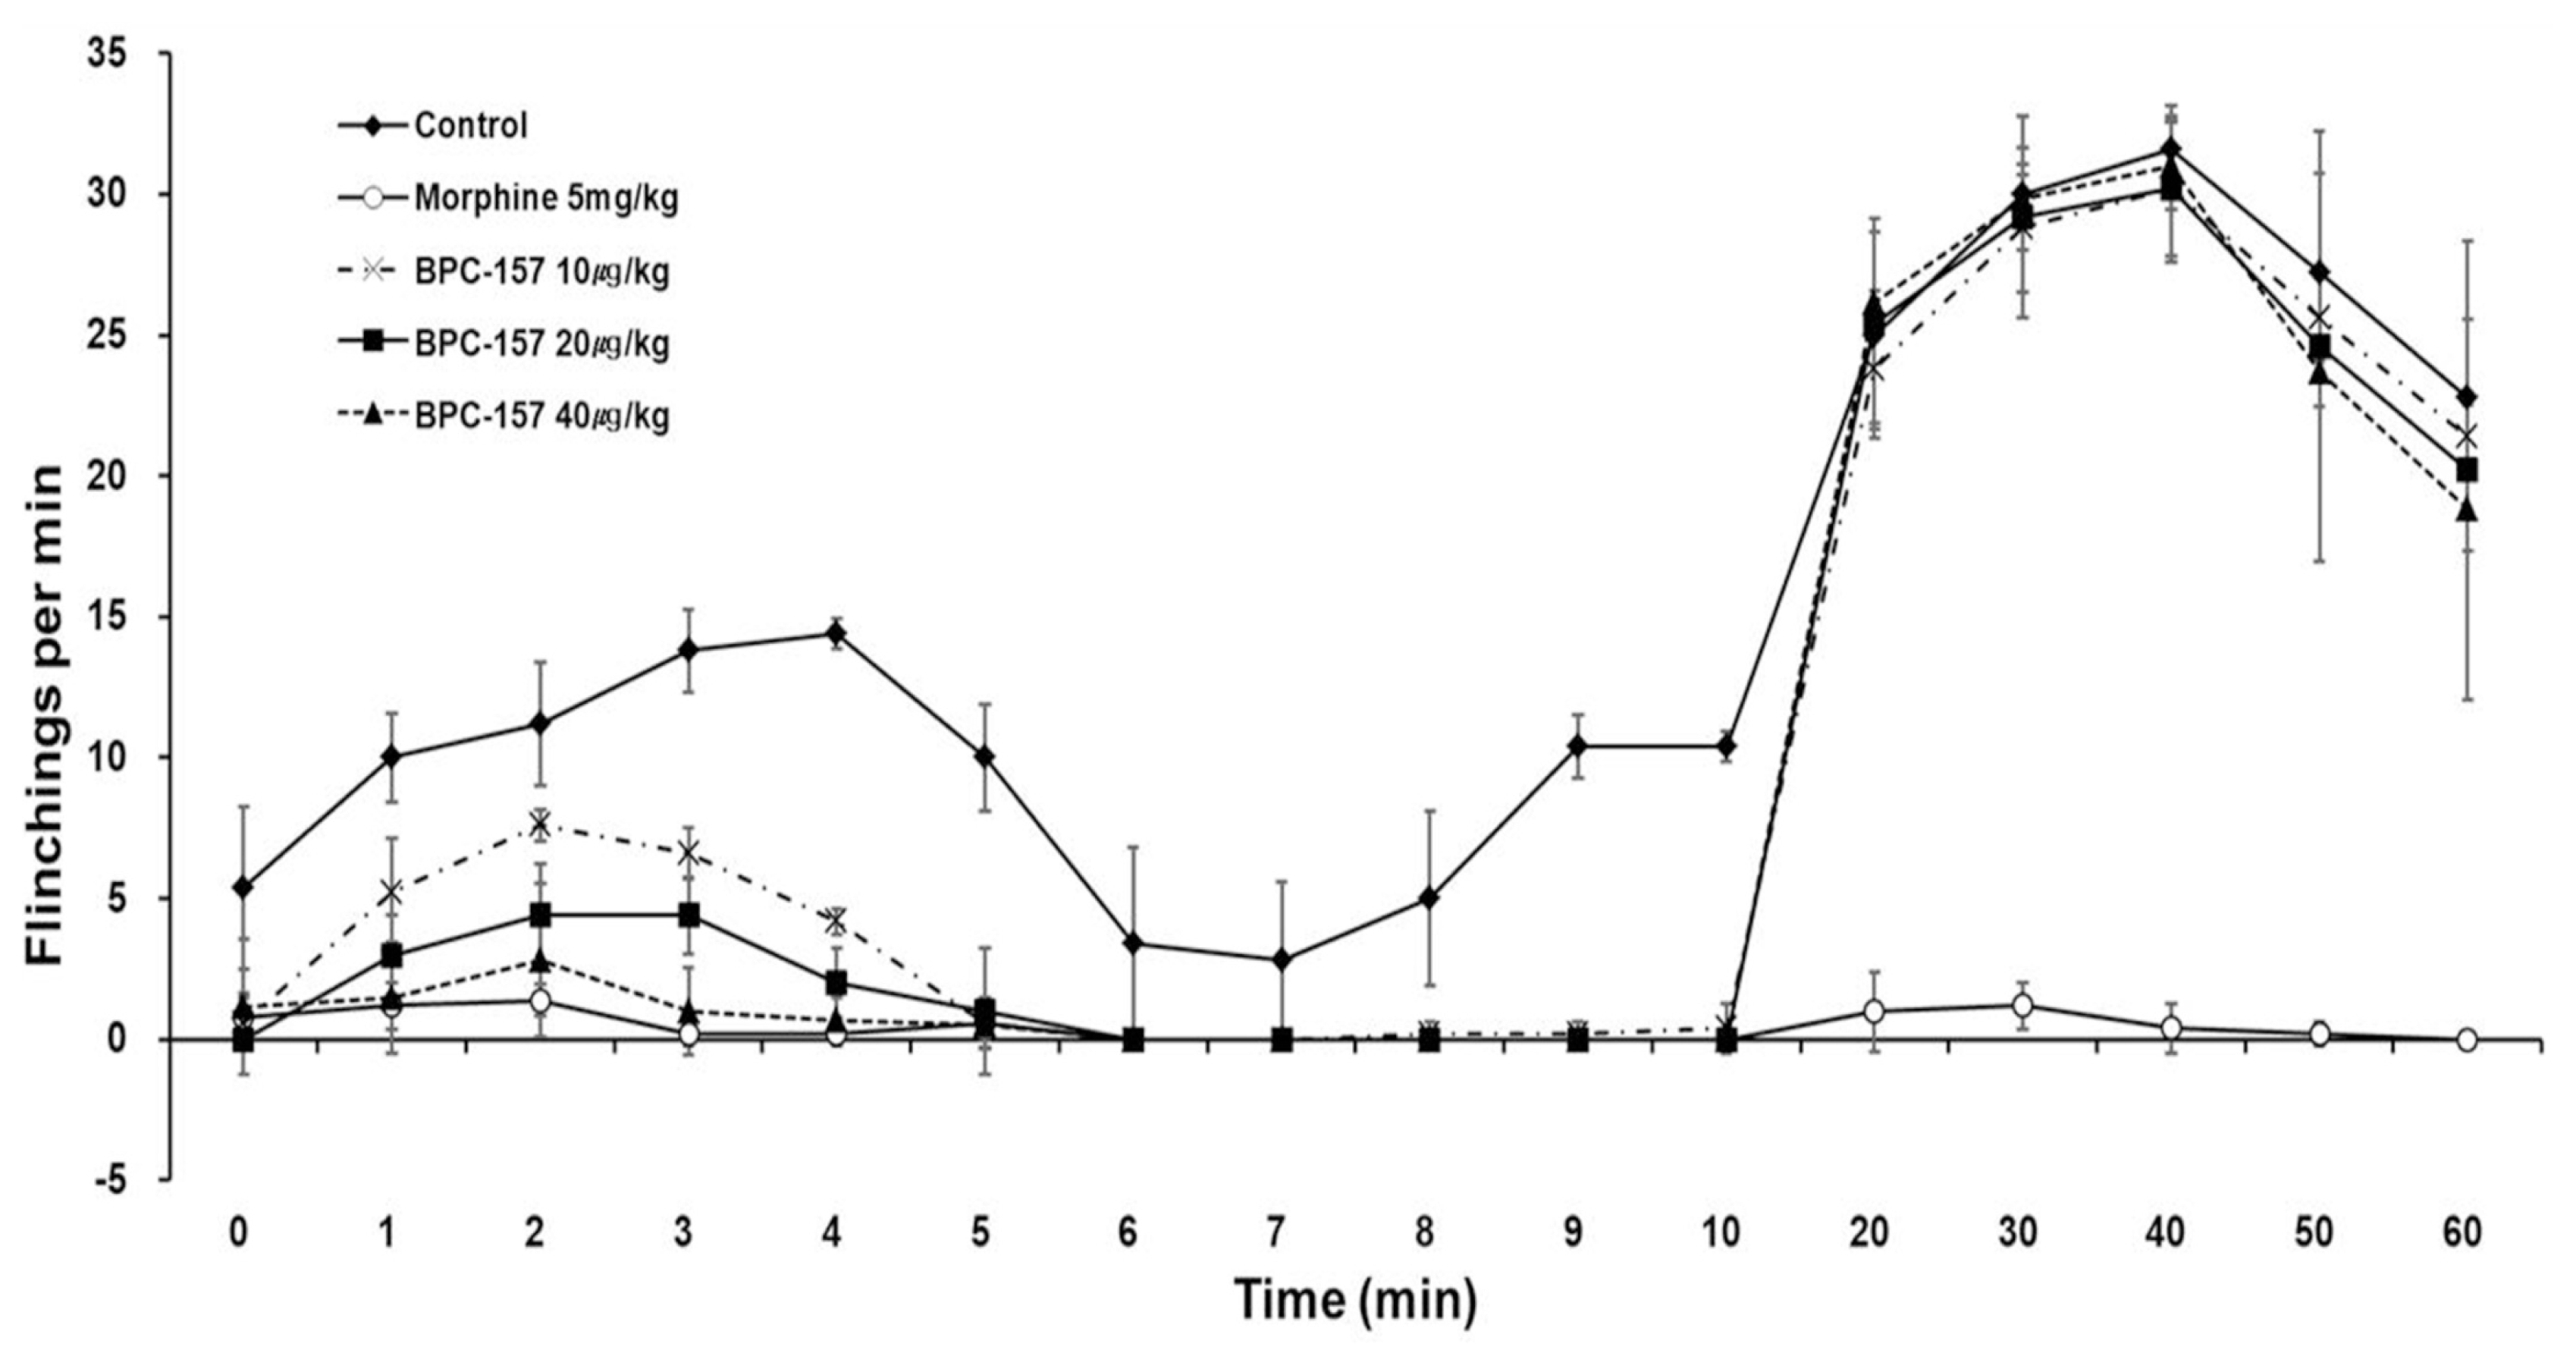 | Fig. 1Time-effect curve of the control, morphine, and BPC-157 (from 10 to 40 μg/kg) groups of the flinching response in the formalin testData are presented as the number of flinching and licking/biting. BPC-157 significantly suppressed flinches in a dose-dependent manner in phase 1. Each line represents the mean and standard error bars of 7 rats.
|
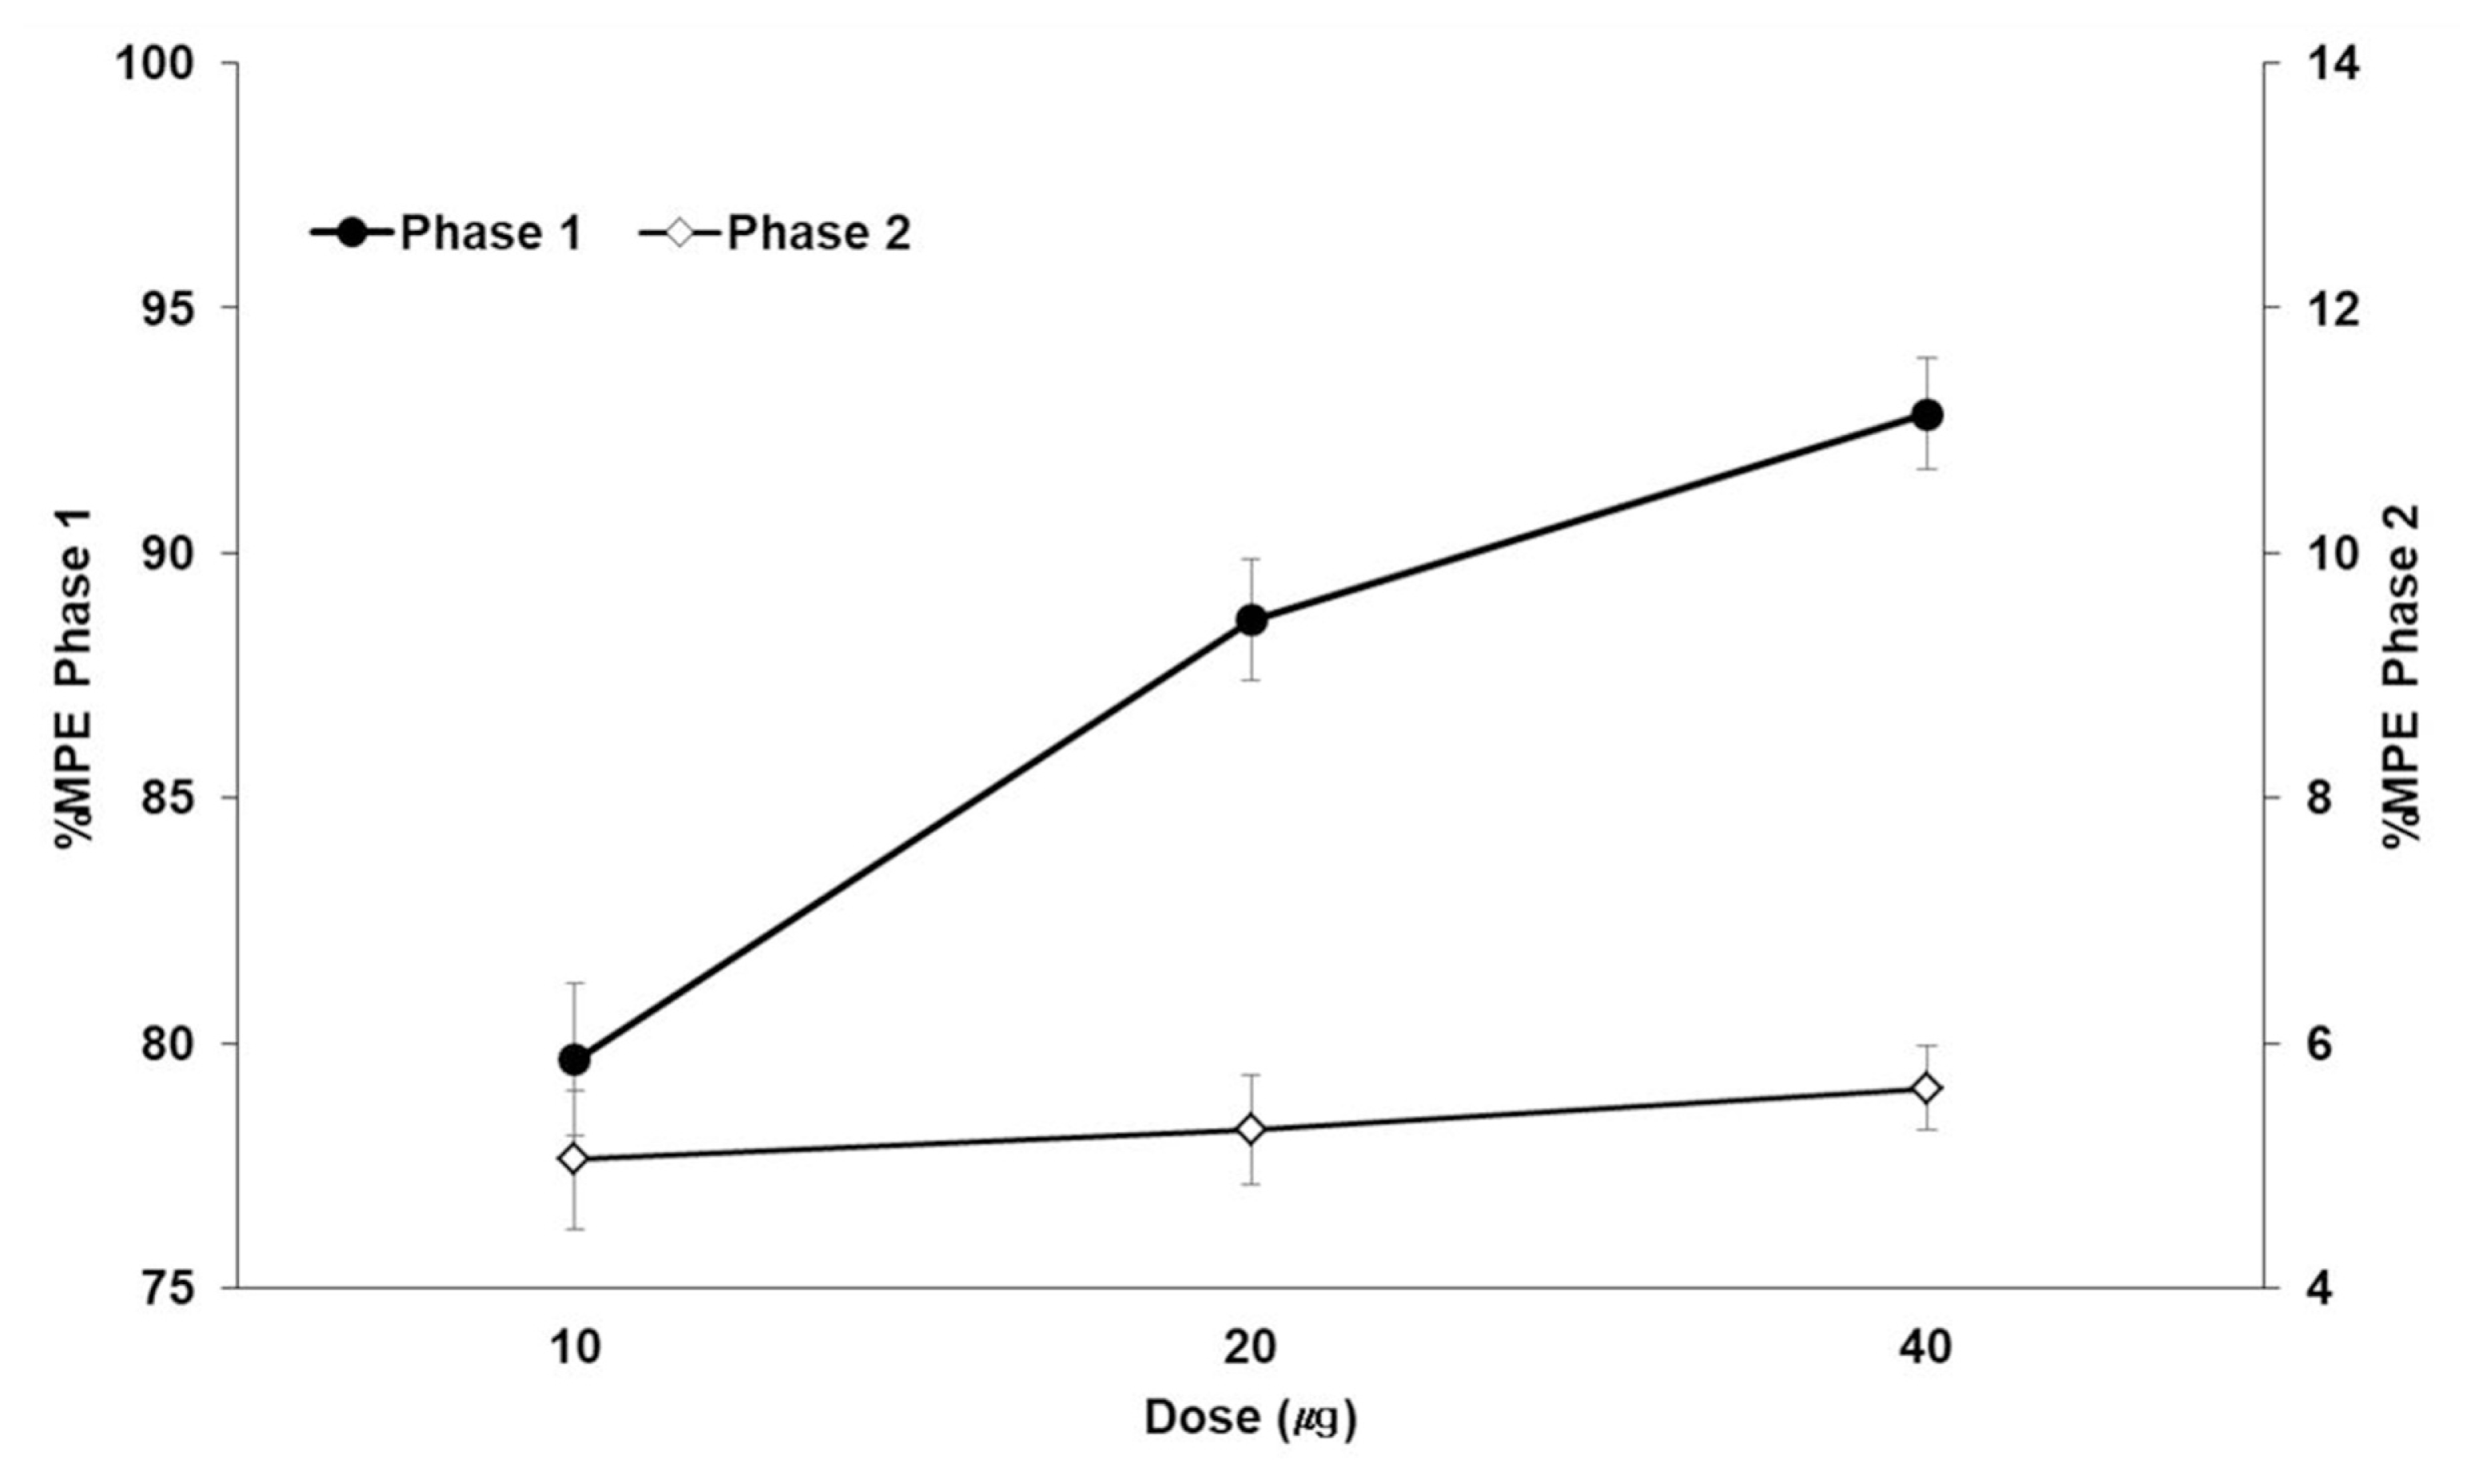 | Fig. 2Dose-response curve of the flinching response after intraperitoneal BPC-157 administration in the formalin testData are presented as the percentage of control. Pretreatment with BPC-157 significantly suppressed flinches in a dose-dependent manner in phase 1 but showed little effect in phase 2. Each line represents the mean % MPE (% maximal possible effect) and standard error bars of 7 rats.
|
Immunohistochemistry for cytokines
IL-1β in the DRG and SC at 5 min is representative of phase 1. Statistical significance was achieved for IL-1β expression in the DRG tissues from the morphine and sham groups (P < 0.001) and from the 10 and 20 μg/kg BPC-157 groups (P < 0.05) compared with those from the control group. Regarding SC tissue IL-1β expression, the morphine and sham groups showed significant differences from the control group (P < 0.05) (Fig. 3A).
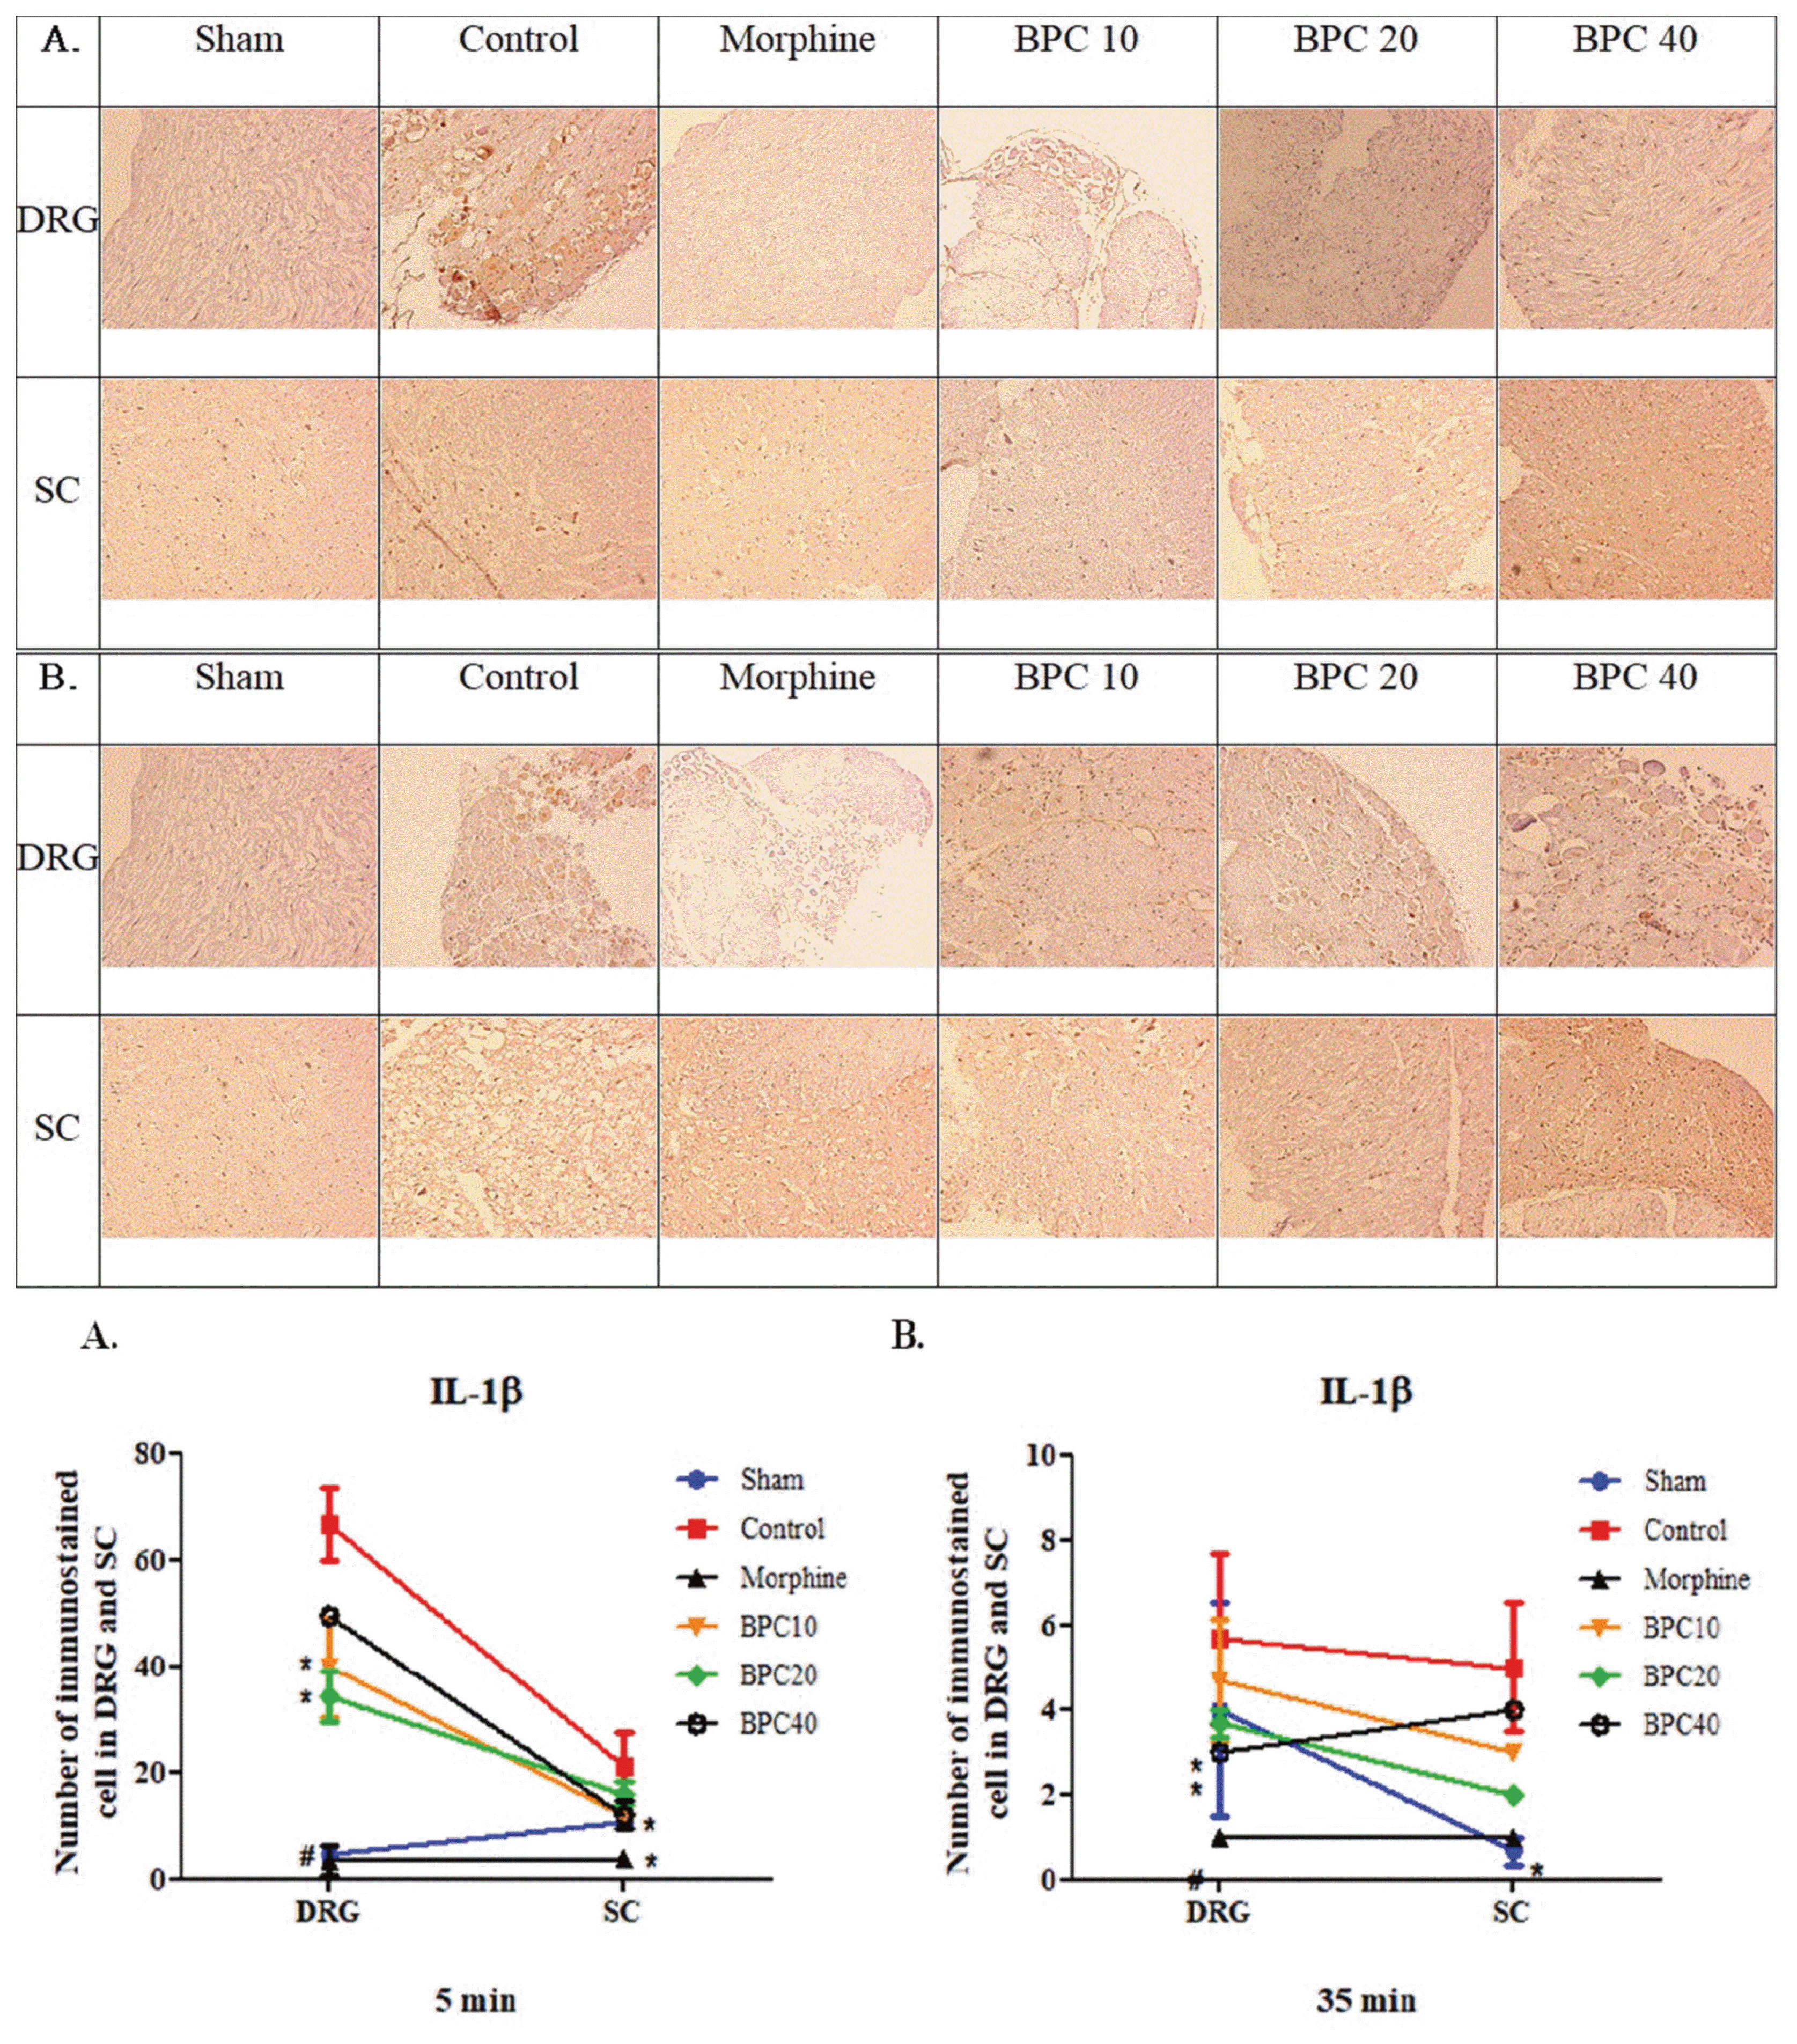 | Fig. 3Immunohistochemistry of interleukin-1β (IL-1β) in the dorsal root ganglion (DRG) and spinal cord (SC) at (A) 5 min (representative value of phase 1) and (B) 35 min (representative value of phase 2)Graph (bottom) represents the number of immunostained cells in the DRG and SC (mean ± SD). (A): Significant differences was achieved in the DRG tissues from the morphine and sham groups (#, P < 0.001) and from the 10 and 20 μg/kg BPC-157 groups (*, P < 0.05) compared those from the control group. The SC tissues of the morphine and sham groups showed significant differences from those of the control group (*, P < 0.05). (B): Statistical significance was achieved in the DRG tissues from the morphine and sham groups (#, P < 0.001) and the 20 and 40 μg/kg BPC-157 groups (*, P < 0.05) compared those from the control group. The SC tissues of the morphine and sham groups showed significant differences from those of the control group (*, P < 0.05).
|
IL-1β in the DRG and SC at 35 min is representative of phase 2. Statistical significance was achieved for IL-1β expression in the DRG tissues from the morphine and sham groups (P < 0.001) and from the 20 and 40 μg/kg BPC-157 groups (P < 0.05) compared with those from the control group. Regarding SC tissue IL-1β expression, the morphine and sham groups showed significant differences from the control group (P < 0.05) (Fig. 3B).
IL-6 was measured in the DRG and SC tissues during phase 1. Statistical significance was achieved for IL-6 expression in DRG tissues from the morphine and sham groups (P < 0.001) and from the 10 μg/kg BPC-157 group (P < 0.05) compared with those from the control group (Fig. 4A).
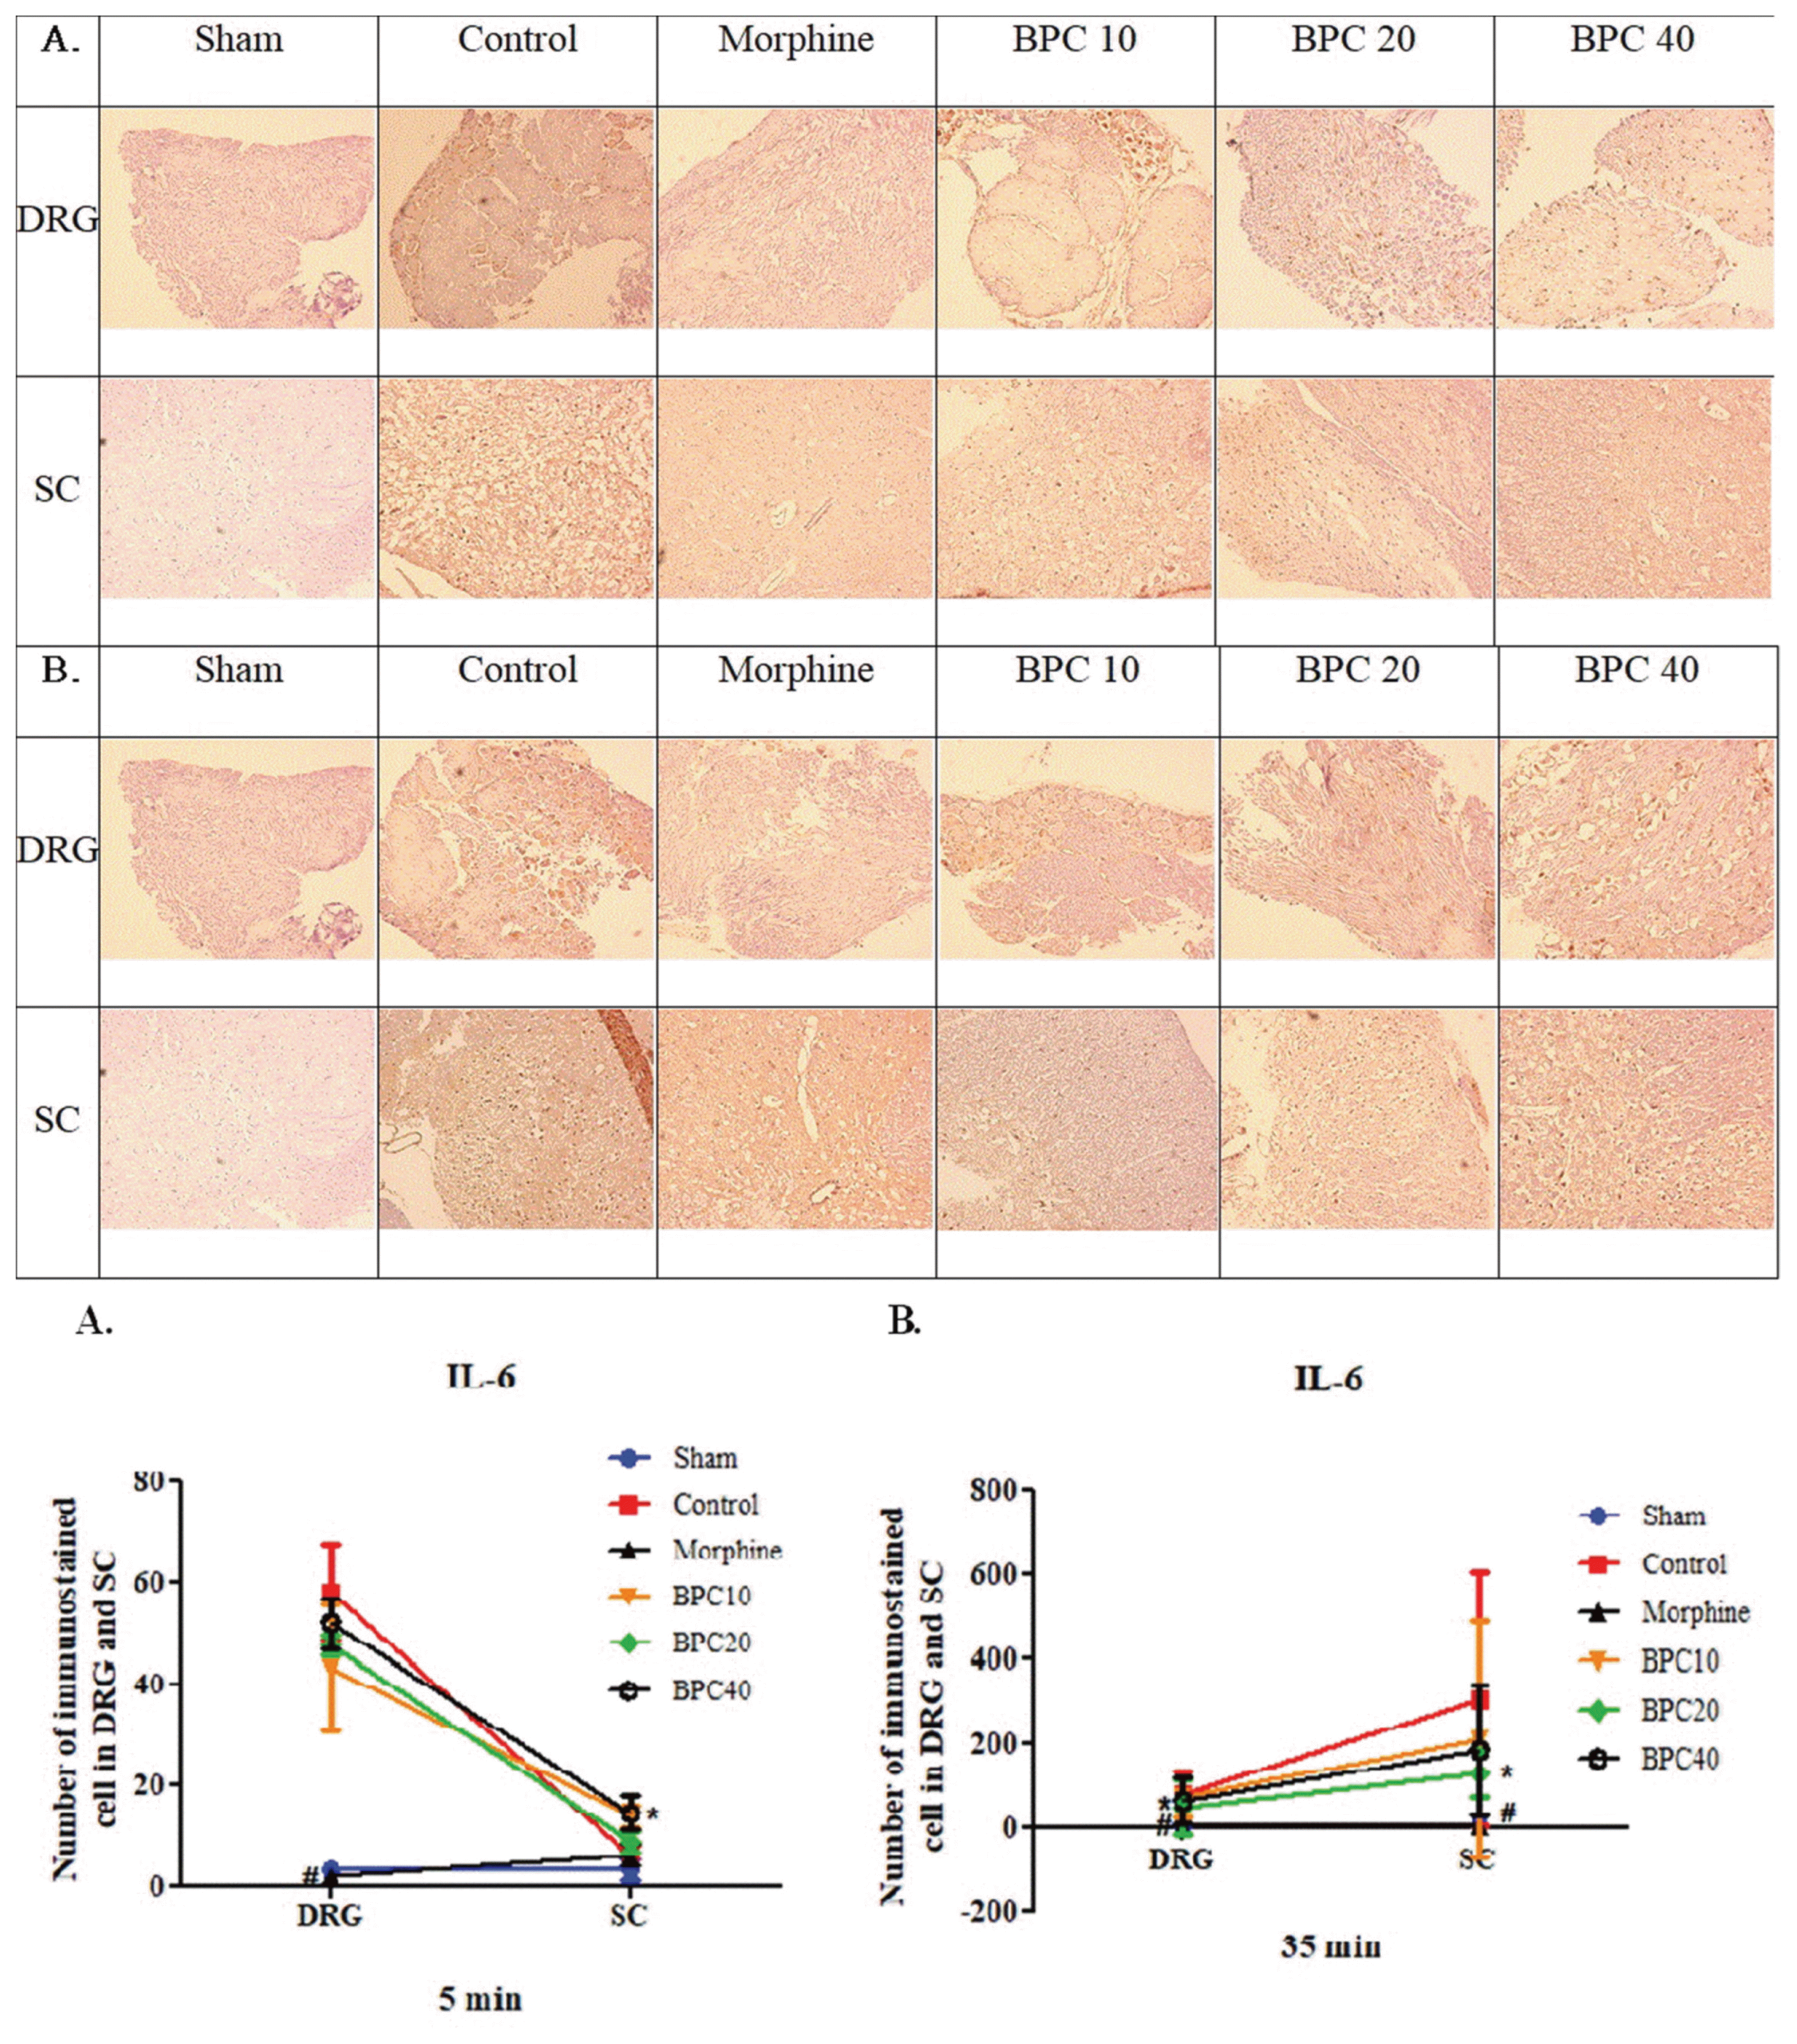 | Fig. 4Immunohistochemistry of interleukin-6 (IL-6) in the dorsal root ganglion (DRG) and spinal cord (SC) at phases (A) 1 and (B) 2Graph (bottom) represents the number of immunostained cells in the DRG and SC (mean ± SD). (A): Statistical significance was achieved in the DRG tissues from the morphine and sham groups (#, P < 0.001) and the BPC-157 10 μg/kg group (*, P < 0.05) compared with those from the control group. (B): Statistical significance was achieved in both the DRG with SC tissues from the morphine and sham groups (#, P < 0.001) and the 20 μg/kg BPC-157 group (*, P < 0.05) compared with those from the control group.
|
IL-6 was measured in the DRG and SC tissues during phase 2. Statistical significance was achieved for IL-6 expression in both the DRG and SC tissues from the morphine and sham groups (P < 0.001) and the 20 μg/kg BPC-157 group (P < 0.05) compared with those from the control group (Fig. 4B).
TNF-α was measured in the DRG and SC tissues during phases 1 and 2. There were no significant differences in the number of TNF-α-immunostained cells in the DRG and SC tissue cells between the control and experimental groups during either phase (Fig. 5A, B).
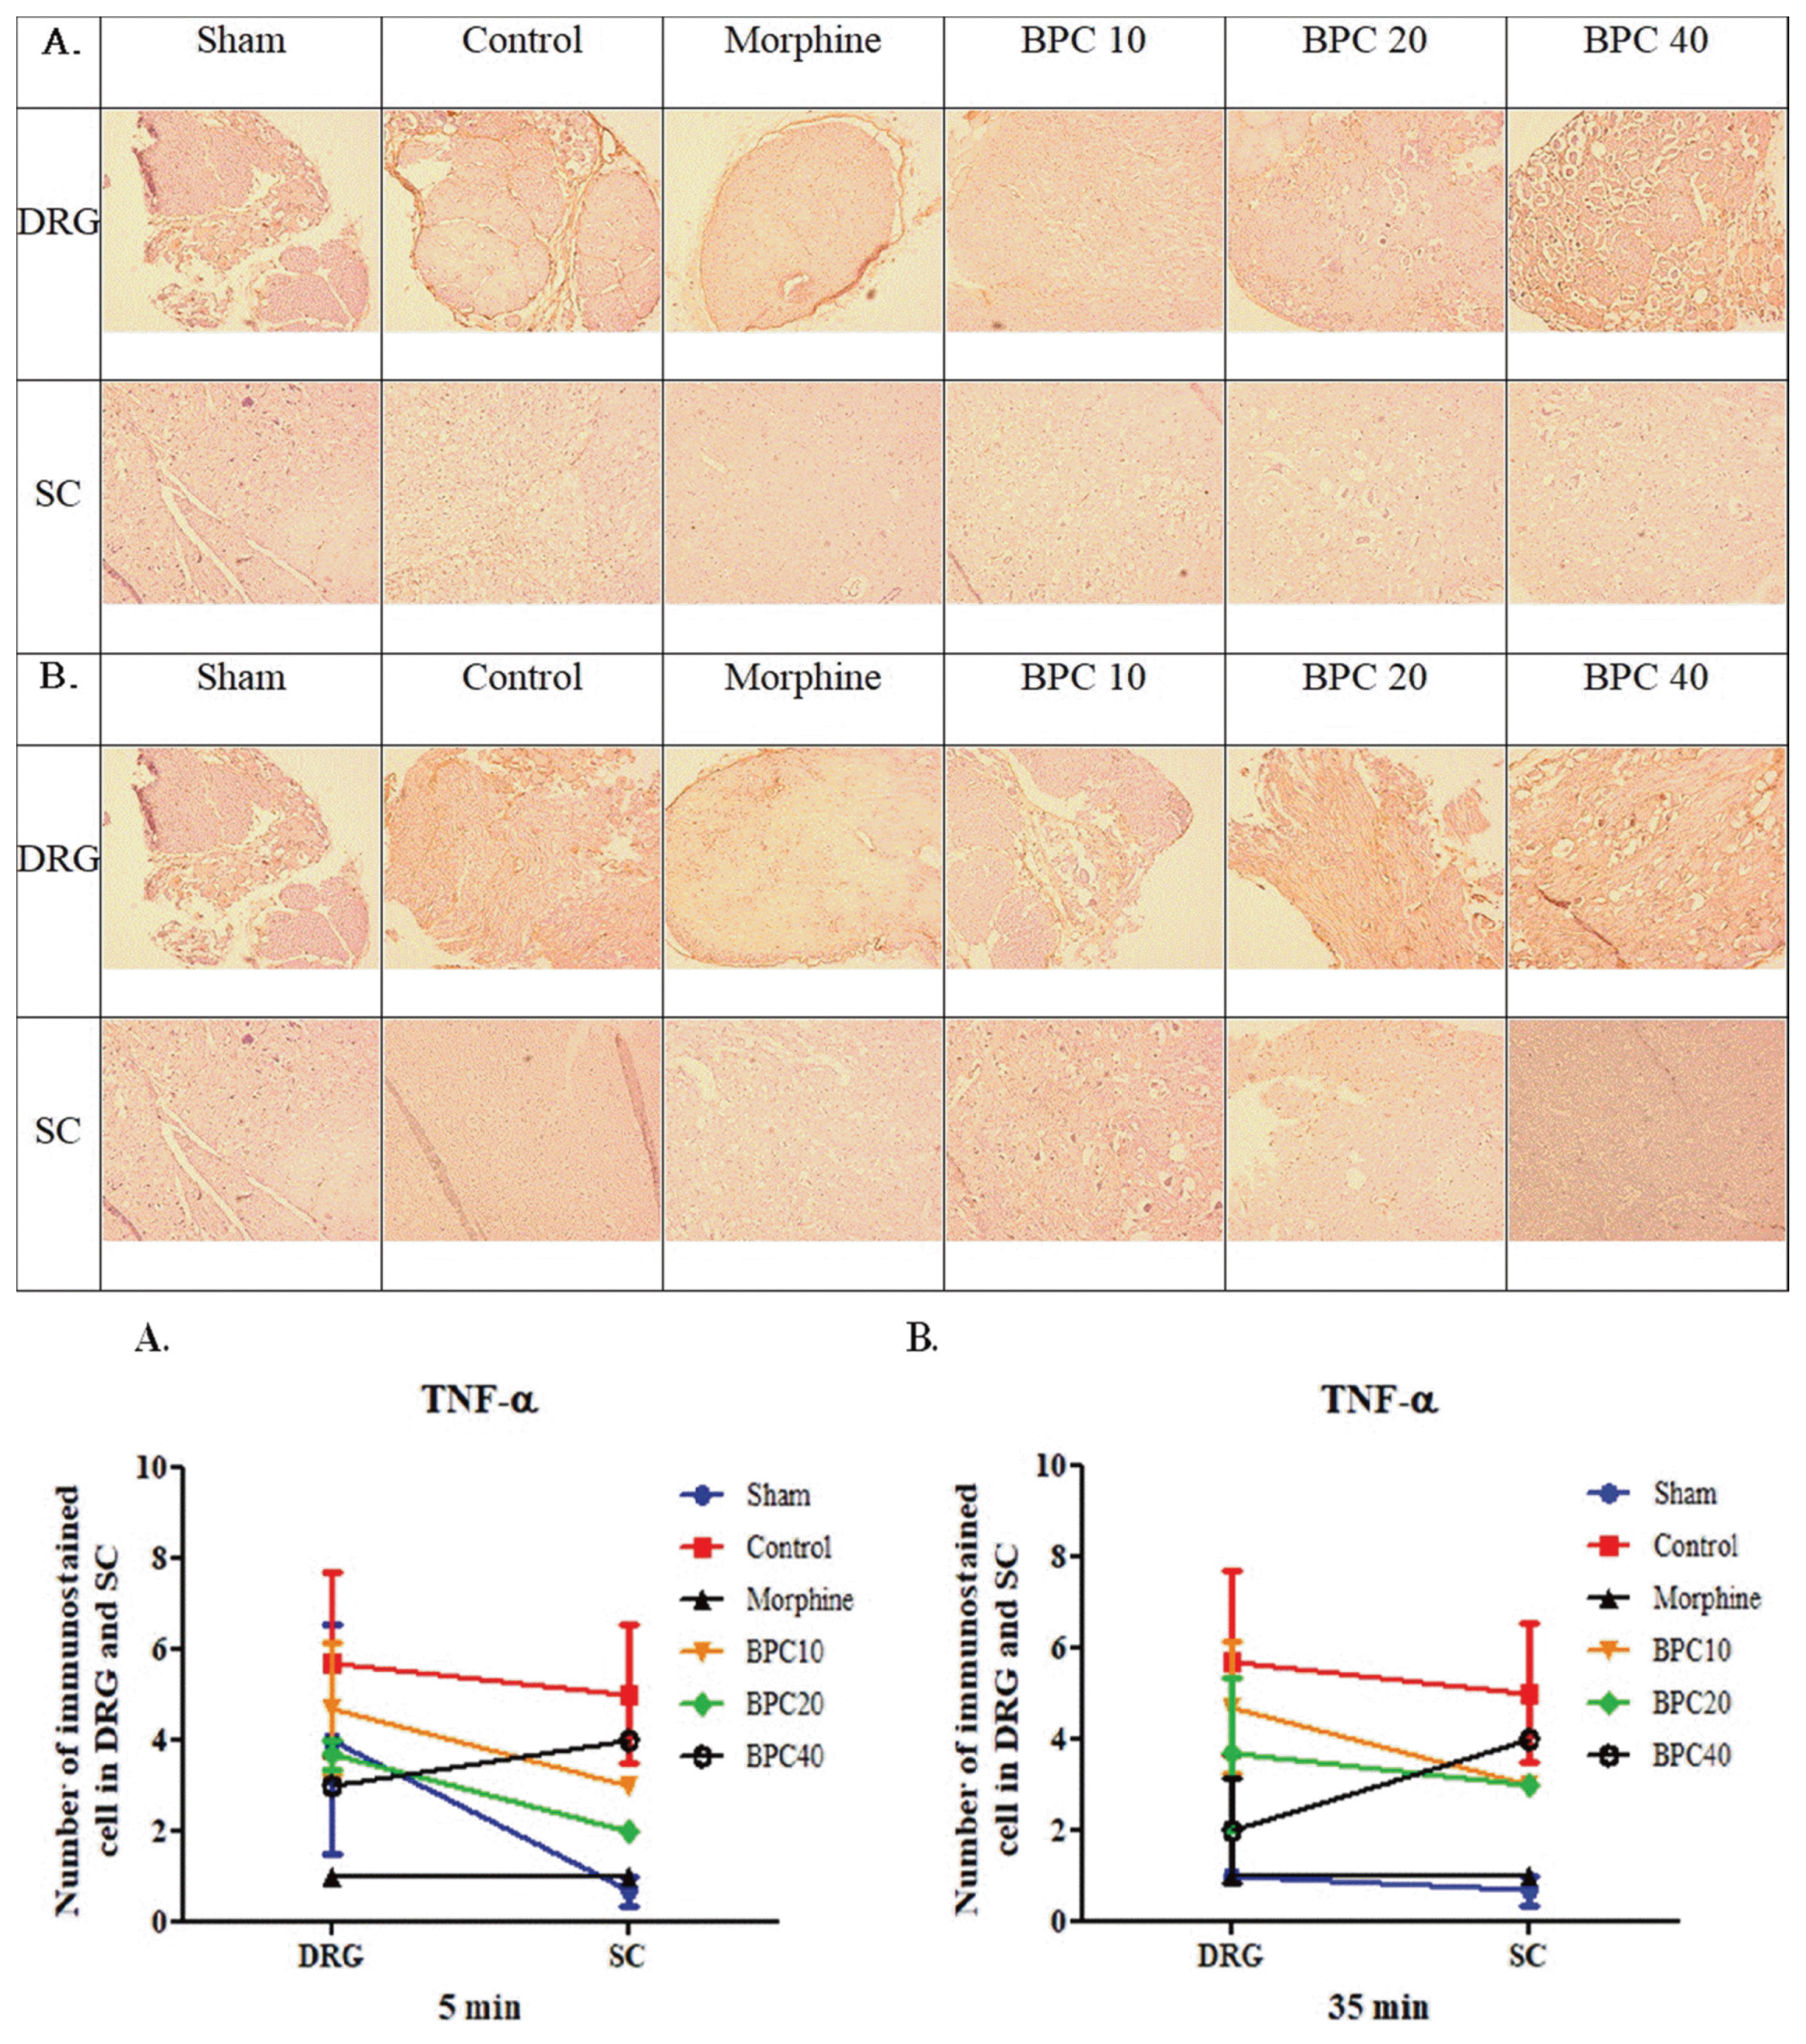 | Fig. 5Immunohistochemistry of tumor necrosis factor-α (TNF-α) in the dorsal root ganglion (DRG) and spinal cord (SC) at phases (A) 1 and (B) 2Graph (bottom) represents the number of immunostained cells in the DRG and SC (mean ± SD). There were no differences between the control and experimental groups during either phase.
|
Go to :
DISCUSSION
The behavioral response of the rats upon injection of a 5% formalin solution into the hindpaw was described more than 30 years ago “to assess pain and analgesia”.7 The formalin test has rapidly become the most widely used preclinical screening test, and annual publications still show a positive trend. The reasons for the wide-spread use of this test are the ease of performing the single intervention, the reproducible and spontaneous pain-related responses that can be observed in unrestrained animals, and finally, the 2 separately interpretable readouts. The responses to formalin-induced pain, such as licking and biting of the injected paw, are biphasic. Therefore, this test allows the analysis of drug actions that are relevant to acute (phase 1, 5 min) and intensified (phase 2, 35 min) pain during one test. Phase 1 is believed to correspond to the high level of activity in the primary afferent as by C-fiber activation due to peripheral stimulation,9 whereas phase 2 seems to result from the continuous low level of small afferent input, together with a facilitated state of spinal processing. The afferent input generated by formalin is believed to release excitatory amino acids and peptides as inflammatory signaling molecules, which, through NMDA and NK1 receptors, initiate a cascade. The resulting cascade is thought to underlie a state of facilitated processing.10 In this study, BPC-157 showed a dose-dependent effect compared to the control during phase 1, but it showed little effect during phase 2. The spinal action of BPC-157 on attenuates the acute nociceptive processing, but it has little effect facilitated component of the response evoked by persistent small afferent input. Thus, the acute thresholds or motor function induced by local tissue injury of inflammatory cytokines are reversed by i.p. BPC-157 that had no effect on thermal hyperalgesia or tactile allodynia.
The subsequent production of inflammatory cytokines, such as IL-1β, IL-6, and TNF-α, by these nociceptive free endings elicit spontaneous, repetitive action potentials in sensory afferents.11 Several studies of inflammatory pain suggest that the increase in IL-1β, IL-6, and TNF-α is related to the pathological pain status.12–14 To determine the histopathology of the effects of BPC-157 on the DRG and SC at 5 and 35 min, which represent phases 1 and 2, respectively, this study used the IHC technique to detect the cytokines IL-1β, IL-6, and TNF-α. Some theories suggest that the DRG are actually a component of the central nervous system. Similar to the SC, DRG are protected inside the vertebral bones. The synaptic terminals of DRG neurons extend inside the gray matter of the SC. DRG are enclosed within the dural sac,15 albeit at a uniquely permeable site of the blood-brain barrier.16 However, other evidence supports the notion that DRG are a component of the peripheral nervous system.17 DRG are separated from the SC by dorsal roots, and because their dendrites extend into the periphery, spinal ganglia have been categorically included in anatomical descriptions of the peripheral nervous system. As a result, IL-1β was shown to be statistically different in the DRG, but not statistically different in the SC, but it appeared that the products were decreasing. Regarding formalin experiments, the IHC method is used to recognize and identify abnormal behaviors during phase 1, such as inflammatory cytokine responses in DRG and a collection of responses in peripheral tissues. Abnormal behaviors during phase 2 are also considered to indicate inflammatory cytokine responses in the SC and a collection of responses in central tissues.
BPC-157 has been shown to have a beneficial effect on muscle healing with a suggested role in the regeneration of damaged intramuscular nerve branches.1 Similarly, it was demonstrated that BPC-157 could also influence the healing of the transected nerve.18 BPC-157 markedly improved rat sciatic nerve healing. The anti-ulcer peptidergic agent has a possible therapeutic effect in many neurological disturbances. Since BPC-157 is native and stable in human gastric juice, it is thought to be a potent mediator of Robert’s cytoprotection, maintaining GI mucosa integrity.1 The wound-healing effect of BPC-157 is related to nerve healing.18 BPC-157 has been studied for over two decades, and the mechanism of action is not clearly known. As far as is known, the beneficial effect on the periphery suggests a corresponding beneficial effect on central systems.1 The observed beneficial effects were obtained within the specifically overstimulated or damaged dopaminergic, serotoninergic, GABAergic and opioid systems.1 The ample evidence of the potential beneficial effects of BPC-157 includes its positive effect on many central disturbances, such as morphine-induced analgesia, morphine, and naloxone.19 As a control for comparison with the experimental treatments, this study used morphine. Opiates such as morphine reliably inhibit the behavioral, electrophysiological and biochemical responses evoked by acute thermal, mechanical and other noxious stimuli in rats.20 Several reports have demonstrated the antinociceptive-like effects of morphine and related compounds on formalin-induced behaviors. For instance, systemic morphine inhibited both the early and late phases of the formalin-induced licking response, and this activity was naloxone-sensitive.7 In this study, morphine was used as a control with which to compare BPC-157. In the future, the use of naloxone will be added to study the association with opioid systems in BPC-157.
Rivot et al. demonstrated direct in vivo monitoring of nitric oxide (NO) shows that relatively short lasting inflammatory processes of the paw are correlated with a spinal increase in NO production. 21 The study confirms which demonstrate the utility of an in vivo electrochemical method to follow modifications in the NO oxidation current within the spinal dorsal horn in situations related to nociception. In the superficial spinal dorsal horn and over short time periods NO is likely to be produced essentially by NOS localized in dorsal root ganglia and primary afferent terminals.22 The relationship between NO and phenomena related to the spinal transmission of nociceptive inputs has been generally studied using the effects of NOS inhibitors (NOSIs) on nociception-related electrophysiological responses of dorsal horn cells after formalin. 23 It is interesting to emphasize that the onset of increase in NO-dependent oxidation current took place in a few minutes after formalin injection. This is in keeping with the rapid onset of the behavioural signs of nociception7 and rapid changes in the responses of dorsal horn cells23 following formalin. Formalin administration may lead to an increase of NO which in turn would lead to formation of cyclic guanosine monophosphate (cGMP) by activation of guanylyl cyclase. Intracellular cGMP concentrations are regulated by the action of guanylyl cyclases and the rate of degradation by cGMP-specific phosphodiesterases. BPC-157 mainly interacts with the NO system, both NOS-substrate (L-arginine) and NOS-blocker (L-NAME), in different models and species.24 BPC-157 modulates NO synthesis. These findings are very interesting, considering the essential role of NO in healing, and suggest the possibility of overriding of this negative effect and the neuroprotective capabilities of BPC-157.18 BPC-157 is claimed to have beneficial effects even outside the gastrointestinal tract. Like many other gut peptides, BPC-157 is present in different organs and its possible special role in the interaction with the endothelium derived NO system.25 It is also likely that BPC-157 can inhibit the effect of a calcium ionophore A23187, which is known to stimulate NO release.26 For instance, the pentadecapeptide could dose-dependently reduce the release of leukotriene B4 in human blood stimulated by A23187. Besides this, BPC-157 could also inhibit other inflammatory mediators, i.e., myeloperoxidase, tromboxane B2.27 This action should probably also be considered because NO can also be produced by the inducible NO synthase of activated macrophages and neutrophils.26 It was clearly shown that BPC-157 could interfere with the effect of NO agents in both gastric mucosal integrity and blood pressure maintenance in a specific way.28
Further studies are needed to observe the changes in movement and expression of cytokines as a result of different routes of BPC-157 administration. Yaksh et al. reviewed spinal nociceptive processing from this point of view.10 These authors found that stimulation of spinal neurokinin 1, NMDA, and non-NMDA receptors enhances spinal release of PGE2, which facilitates the release of spinal amino acids and peptides. Our findings of the present study may be consistent with this hypothesis. Therefore, drug delivery by different routes of administration may differentially affect behavior in the formalin test. Little is known concerning this brain-to-SC pathway activated by the direct effects of s.c. administration. Glutamate, aspartate, and SP released in the SC in response to formalin s.c. are critical in producing hyperalgesia.29 Considering these two proven hypotheses, what happens if BPC-157 is administered directly to a site damaged by s.c. formalin treatment?
It was meaningful to suggest that BPC-157 prevents the expression of cytokines in phase 1 as an antinociceptive effect on dose dependently, elucidating exactly how BPC-157 effects the DRG or SC. A more detailed study of the antinociceptive action of BPC-157 should be performed further in the future.
Go to :
 XML Download