

 PDF
PDF Citation
 Print
Print


INTRODUCTION
Coronary artery disease is a leading cause of death worldwide.1) One feasible treatment option is coronary artery bypass grafting (CABG), which has been performed with percutaneous coronary intervention for coronary revascularization.2)3) Approximately 400,000 CABG surgeries are performed annually in the United States,4) and studies have revealed that patients undergoing CABG have a higher mortality rate than the general population.5) Consequently, improving the mortality rate after CABG is critical for patients with coronary artery disease.6)7)
Surgical quality has been evaluated by measuring the annual hospital case volume. Previous studies have also investigated the relationship between the case volume of hospitals and the surgical outcomes.8)9) These studies have revealed that a higher case volume is associated with better survival after surgery for esophageal cancer, gastric cancer,10) pancreatic cancer,11)12) and intracranial brain tumors.13) Regarding CABG, while some reports have indicated that a higher hospital case volume is associated with better outcomes,14)15)16)17) one study reported that the annual volume was not significantly associated with outcomes after CABG.18) Thus, the relationship between the annual case volume and outcomes after CABG remains undefined. In South Korea, 92.6% of the total CABG surgeries from 2003 to 2013 were performed in Seoul (capital city) alone, which indicates that a majority of the CABG cases were concentrated in hospitals in Seoul.19) Because CABG cases centralized to specific areas or hospitals might affect the surgical quality, it is speculated that the hospital case volume in South Korea may affect the outcomes after CABG. However, such a relationship has not yet been identified in South Korea. Moreover, previous studies have not evaluated the effects of surgeons and health care providers, such as physicians (trainees and specialists), nurses, and pharmacists, on the outcomes after CABG. Maximizing the quality of hospital care is critical for achieving better outcomes after CABG.14) Furthermore, cooperation and consultation between all departments in the hospital are necessary while caring for patients undergoing surgery. Thus, the effects of health care providers and case volume on CABG outcomes should be considered.
Therefore, we aimed to determine if the annual case volume of CABG was associated with a 90-day mortality after CABG. Furthermore, we also investigated whether number of health care providers per hospital bed affected the 90-day mortality after CABG. If there were significant associations, we determined the optimal cut-off values of the annual CABG case volume and health care providers associated with an improvement in the 90-day mortality after CABG.
METHODS
Ethical statement
The study protocol was approved by both, the Institutional Review Board (IRB) of the Seoul National University Bundang Hospital (IRB number: X-1908-556-901) and the Health Insurance Review and Assessment Service (NHIS-2019-1-505). The requirement for informed consent was waived, because the data analyses were performed retrospectively using anonymous data derived from the South Korean National Health Insurance Service (NHIS) database.
Study design
This population-based cohort study was conducted in accordance with the guidelines of the “strengthening the reporting of observational studies in epidemiology” checklist.20)
Data source: NHIS database
The NHIS database was used as the sole database in this study. In South Korea, all disease diagnoses and prescription information regarding drugs and/or procedures provided under the public insurance system should be registered with the NHIS database. The study data were extracted by an independent medical record technician at the NHIS center who had no conflicts of interest relevant to this study. The data extraction was performed on November 1, 2019. Additionally, the dates of death of all study participants, as of May 16, 2019, were extracted from the NHIS database.
Study population
The study cohort included all adult patients diagnosed with ischemic heart disease (International Classification of Diseases [ICD]-10 codes: I20–I25) who underwent isolated CABG between January 2012 and December 2017. We excluded patients who: 1) underwent multiple CABG surgeries, 2) were under the age of 18 years (i.e., pediatric patients), and 3) did not have complete medical records.
Main independent variable
Annual case volume
As an independent variable, the annual surgical volume of the CABG cases was collected for each hospital where the patients received CABG. According to the quartile ratio, this figure was divided into 4 groups, namely Q1–Q4.
Health care providers
The NHIS database provides the annual hospital information, which includes the officially registered data on the total number of hospital beds, physicians (trainees and specialists), nurses (registered nurses and nurse assistants), and pharmacists. A specialist physician is defined as a doctor who has completed advanced education and training in a specific field of medicine. The physicians include not only cardiovascular surgeons, but also physicians from all departments of the hospitals (for e.g., anesthesiology, internal medicine, and radiology). Furthermore, physicians and nurses include not only those who care for the patients directly, but also those at administrative positions. For this study, we initially screened the hospital codes where CABG surgeries had been performed, and information on the health care providers in the NHIS database was matched for inclusion in the analysis. Next, the ratios of the total number of physicians to 100 hospital beds, total number of specialist physicians to 100 hospital beds, total number of trainees to 100 hospital beds, total number of nurses to 100 hospital beds, and total number of pharmacists to 100 hospital beds were calculated to reflect the overall hospital capacity.
Endpoint
The primary endpoint of this study was the 90-day mortality after CABG, which was defined as any mortality occurring within 90 days from the CABG surgery.
Confounding variables
In this study, we identified the following variables as confounders: 1) demographic variables (age and sex), 2) socioeconomic variables (residence [capital city, other metropolitan cities, or other areas] and economic status [4 groups in the quartile ratio] at the time of CABG), 3) the Charlson comorbidity index (CCI) at the time of CABG, which was calculated using the registered ICD-10 diagnostic codes (Supplementary Table 1) from 1 year before CABG to the date of CABG, 4) use of an intraoperative cardiopulmonary bypass pump (off-pump CABG/on-pump CABG), 5) number of coronary artery grafts (1 or ≥2), 6) year in which CABG was performed, and 7) absolute hospital volume, defined by the total number of hospital beds (4 groups in the quartile ratio). Data on the patients' residences were collected on the basis of their home addresses, which were registered in the national database at the time of CABG. Therefore, if a patient living in the rural area underwent CABG at a hospital in Seoul, the rural area was considered as the residence of the patient. The NHIS had information regarding the economic status of its subscribers to determine the insurance premium; thus, the economic status of the individuals at the time of CABG was collected in this study. In South Korea, physicians are required to register any underlying diseases, such as diabetes and hypertension, in the NHIS database to receive insurance coverage; therefore, the ICD-10 codes of all registered underlying diseases were extracted and used to calculate the CCI in this study. Furthermore, data on the use of an intraoperative cardiopulmonary bypass pump and the number of coronary artery grafts were also extracted using the procedural prescription codes that had been registered in the NHIS database to receive the insurance coverage.
Statistical analyses
For demographic, socioeconomic, clinical, and hospital data of all patients, categorical variables were presented as numbers with percentages, while continuous variables were presented as medians with interquartile ranges (IQR). The continuous variables had a non-normal distribution, according to the results of the Kolmogorov-Smirnov test.
We performed univariable and multivariable Cox regression analyses to investigate if the annual CABG volume and health care providers were associated with the 90-day mortality.
The 90-day mortality was set as the event, and the duration between the date of CABG and the date of death or May 16, 2019 for survivors was calculated for these time-to-event analyses (Cox regression analyses). In addition to the main independent variables (i.e., the annual case volume and variables regarding the effect of the health care providers), all confounders such as the age, sex, residence, economic status, CCI, on-pump or off-pump CABG, emergency CABG, absolute hospital volume (bed number), number of coronary artery grafts, and year of CABG were included in the multivariable model for adjustment. To avoid multicollinearity in a multivariable model, the ratios of the total number of specialist physicians and trainees to 100 hospital beds were included in a multivariable model separate from the one including the ratio of the total number of physicians to 100 hospital beds. Furthermore, the CCI, as well as the individual underlying diseases that were used to calculate the CCI, were also included in a separate multivariable model to avoid multicollinearity.
Next, after investigating which main independent variables (i.e., the annual case volume and variables regarding the effects of the health care providers) were associated with the 90-day mortality after CABG in multivariable models, we performed additional receiver operating characteristic (ROC) analysis for 2 objectives. First, using the area under the curve (AUC), we examined the predictive abilities of the main independent variables (which were significant in multivariable models) for the 90-day mortality. Second, we intended to determine the optimal cut-off values of the independent variables using the Youden index method after the ROC analyses.21) After determining the cut-off points, we included the main independent variables in the multivariable models as categorical variables by dividing the values using the cut-off points. All confounders were also included for adjustment in the models using the same method as that for the main analyses.
The log-log plots were used to confirm that the central assumption of the Cox proportional hazard models was satisfied and that there was no multicollinearity with a variance inflation factor <2.0. The results of the Cox regression analyses were presented as hazard ratios (HRs) with 95% confidence intervals (CIs). All statistical analyses were performed using SAS 9.4 (SAS Institute Inc., Cary, NC, USA) and the R software (version 3.6.2; R Foundation for Statistical Computing, Vienna, Austria). The p<0.05 was considered statistically significant.
RESULTS
A total of 16,582 patients received isolated CABG for the treatment of ischemic heart disease between January 2012 and December 2017. Of these, we excluded 270 patients who underwent a repeat CABG surgery, 11 patients who were younger than 18 years of age, and 511 patients who had incomplete medical records. Of the 15,790 patients finally included in the analysis, 1,039 (6.6%) died within 90 days after CABG, as shown in Figure 1. The demographic, socioeconomic, clinical, and hospital data of all patients are shown in Table 1. The median (IQR) annual number of CABG cases was 86.4 (32.8–223.4); accordingly, the annual CABG volume in a year was divided into 4 groups (Q1: ≤33 [n=4,049], Q2: 34–86 [n=3,564], Q3: 87–223 [n=4,194], and Q4: ≥224 [n=3,983]). The median values (IQR) of the total number of hospital beds, physicians, trainee physicians, specialist physicians, nurses, and pharmacists were 1,119 (904–2,413), 409 (271–967), 205 (81–365), 199 (137–602), 644 (383–1,620), and 31 (17–98), respectively.
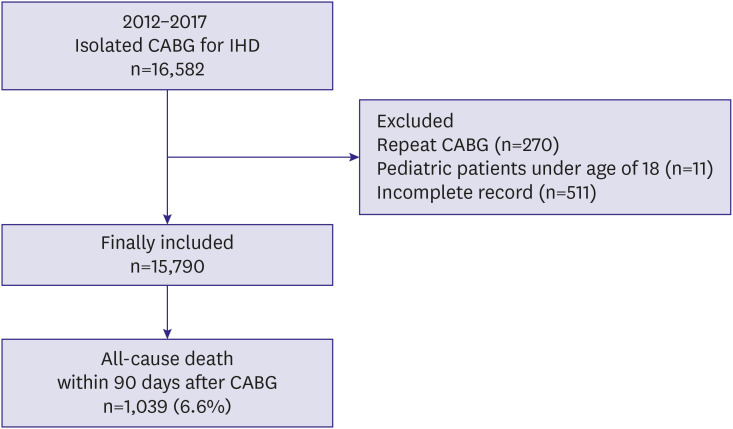
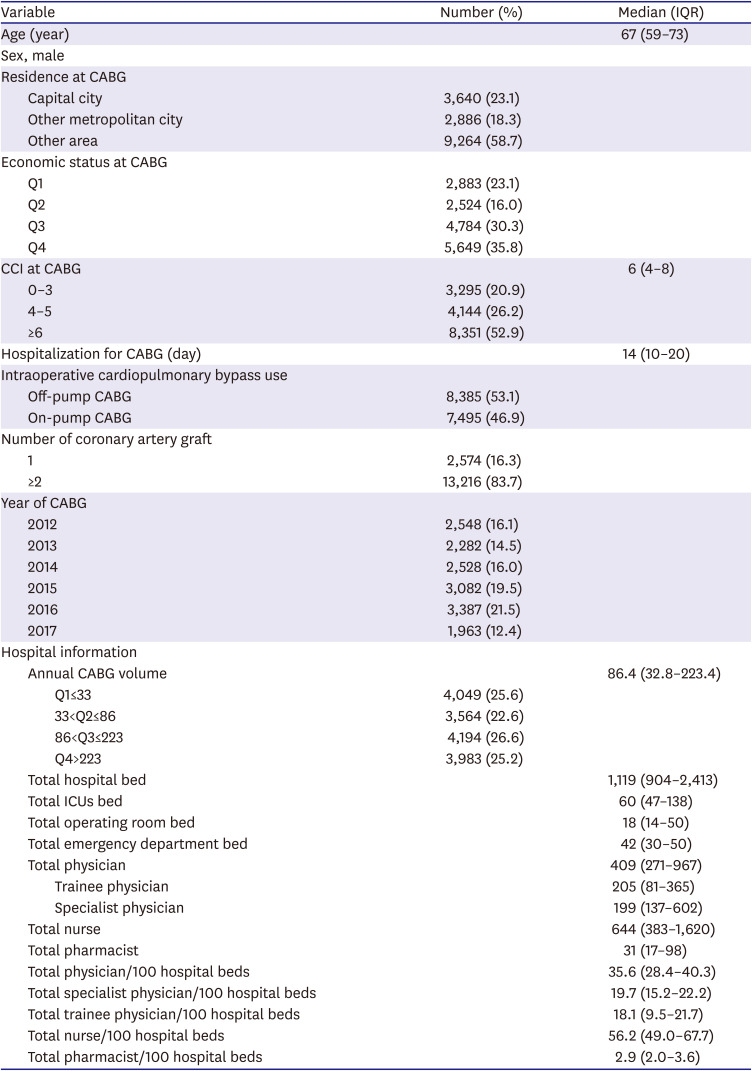
Figure 1
Flowchart of the study design.
CABG = coronary artery bypass grafting; IHD = ischemic heart disease.
![]()
Table 1
Demographic, socioeconomic, clinical and hospital information of patients who received CABG from 2012 to 2017 in South Korea (n=15,790)
CABG = coronary artery bypass grafting; CCI = Charlson comorbidity index; IQR = interquartile ranges.
![]()
The 90-day mortality after CABG
The results of the univariable and multivariable Cox regression analyses are shown in Supplementary Table 2 and Table 2. In multivariable model 1, compared to the Q1 group, the 90-day mortality rates were lower by 31%, 32%, and 75% in the Q2 (HR, 0.69; 95% CI, 0.59–0.82; p<0.001), Q3 (HR, 0.68; 95% CI, 0.56–0.83; p<0.001), and Q4 (HR, 0.25; 95% CI, 0.16–0.60; p<0.001) groups, respectively. The survival plot derived from this multivariable model is shown in Figure 2. The ratio of the total number of physicians to 100 hospital beds was not associated with the 90-day mortality (p=0.863 in model 1); however, a lower rate of 90-day mortality after isolated CABG was observed in hospitals with a higher ratio of the total number of specialist physicians to 100 hospital beds (HR, 0.96; 95% CI, 0.94–0.98; p≤0.001; model 2). The ratios of the total number of trainees to 100 hospital beds, total number of nurses to 100 hospital beds, and total number of pharmacists to 100 hospital beds were not associated with the 90-day mortality (all p>0.05). The C-index of multivariable models 1 and 2 was 0.84 (95% CI, 0.83–0.85).
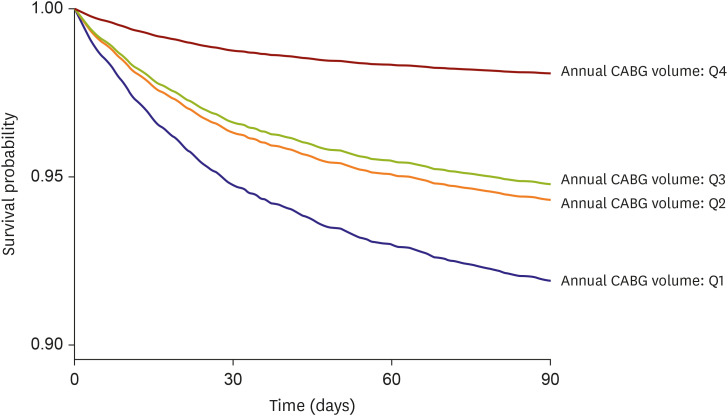
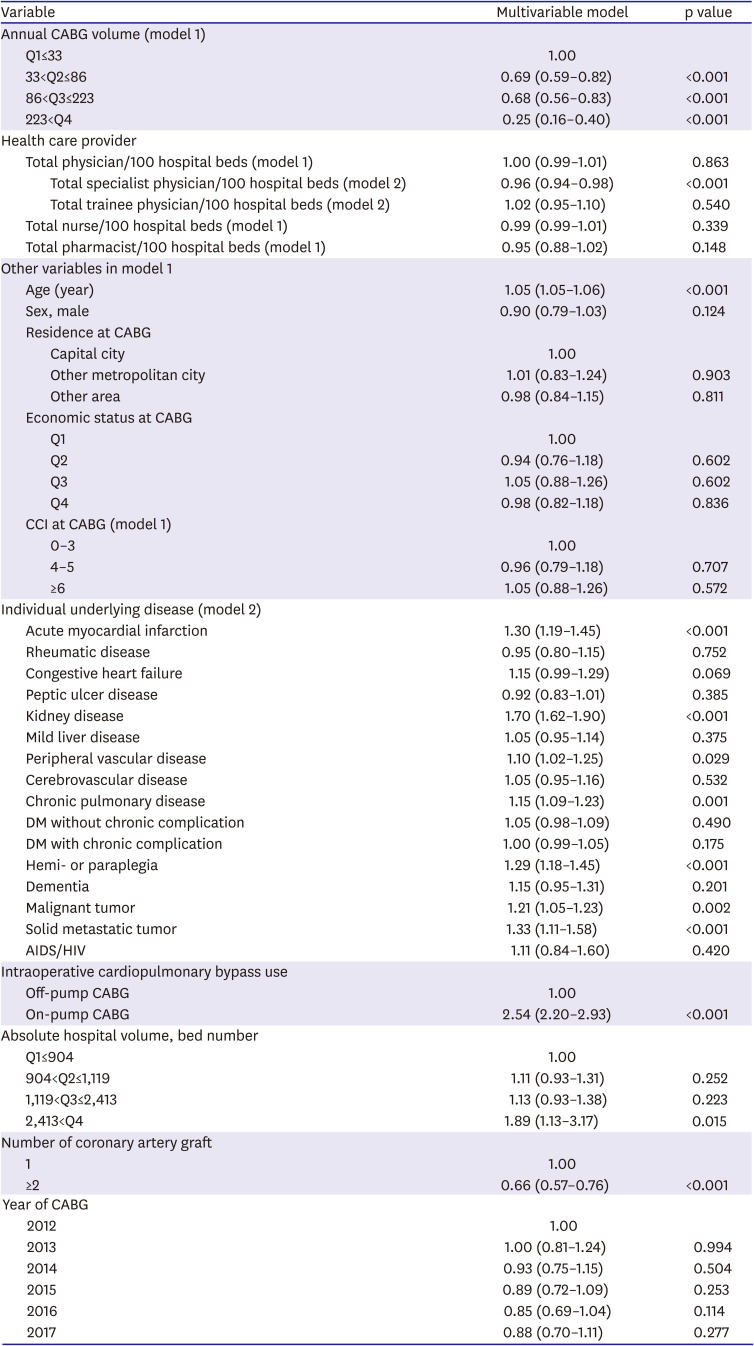
Figure 2
Analysis of survival after isolated CABG surgery according to the annual case-volume of hospital. The plot of survival probability after CABG was derived from a multivariable Cox regression model.
CABG = coronary artery bypass grafting.
![]()
Table 2
Multivariable Cox regression analysis for 90-day all-cause mortality after CABG
Values are presented as HR (95% CI). C-index 0.84 (95% CI, 0.83–0.85).
AIDS = acquired immunodeficiency syndrome; CABG = coronary artery bypass grafting; CCI = Charlson comorbidity index; CI = confidence interval; DM = diabetes mellitus; HIV = human immunodeficiency virus; HR = hazard ratio.
![]()
ROC analysis and cut-off values
According to the results of the ROC analysis (Table 3), the AUCs for the annual CABG volume and the ratio of the total number of specialist physicians to 100 hospital beds for the 90-day mortality, were 0.64 (95% CI, 0.62–0.66) and 0.61 (95% CI, 0.59–0.62), respectively. For achieving improvements in the 90-day mortality, the cut-off values of the annual CABG volume and the ratio of the total number of specialist physicians to 100 hospital beds were 65 and 18, respectively. When applying these cut-off values, after multivariable adjustment, an annual CABG volume ≥65 was associated with a 17% decrease in the 90-day mortality as compared to a cut-off value of ≤64 (HR, 0.83; 95% CI, 0.70–0.97; p=0.023). Furthermore, a ratio of the total number of specialist physicians to 100 hospital beds ≥18 was also associated with a 17% decrease in the 90-day mortality as compared to a cut-off value of ≤17 (HR, 0.83; 95% CI, 0.71– 0.97; p=0.017).
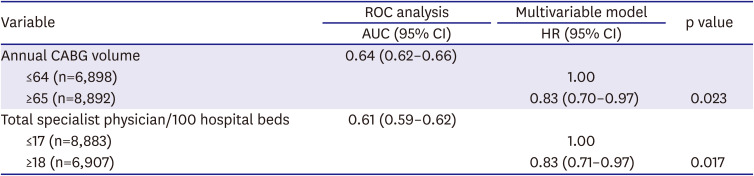
Table 3
ROC analysis for 90-day mortality after CABG, and multivariable Cox regression analysis
AUC = area under curve; CABG = coronary artery bypass grafting; CI = confidence interval; HR = hazard ratio; ROC = receiver operating characteristic.
![]()
DISCUSSION
This population-based cohort study showed that a higher annual hospital case volume and a higher ratio of the total number of specialist physicians to 100 hospital beds were associated with a lower 90-day mortality after CABG. Using the Youden index and ROC analysis, the cut-off values of the annual case volume of CABG and the ratio of the total number of specialist physicians to 100 hospital beds were reported to be ≥65 and ≥18, respectively, for better outcomes after CABG.
Previous studies have focused on the relationship between the annual hospital case volume and outcomes after CABG.14)15)16)17)18) While these studies have focused on relatively short-term outcomes such as the length of the hospital stay, cost,14) operative mortality rates,18) and in-hospital mortality rates,15)16)17) our study has focused on the relatively long-term mortality (i.e., 90-day mortality) after CABG. Furthermore, our study suggested that an optimal cut-off value of ≥65 for the annual case volume was associated with improved outcomes after CABG. The current American College of Cardiology, American Heart Association, and Society for Cardiovascular Angiography and Intervention clinical competency guidelines recommend that surgeons perform a minimum of 50 interventional procedures per year to maintain competency for performing percutaneous coronary intervention.22) Our results also suggest the minimum requirements for maintaining competency for CABG in order to improve the postoperative survival outcomes. However, because only few studies have addressed this issue and the AUC in our study was not sufficiently high (0.64), more studies are needed to confirm our cut-off value for the annual case volume of CABG and determine its effect on postoperative outcomes.
The health care provider effect was also investigated in this study. First, we evaluated the effects of the ratios of the total number of physicians to 100 hospital beds, total number of specialist physicians to 100 hospital beds, total number of trainees to 100 hospital beds, total number of nurses to 100 hospital beds, and total number of pharmacists to 100 hospital beds. Multivariable analyses revealed that among these, the ratio of the total number of specialist physicians to 100 hospital beds was an independently significant factor that influenced the 90-day mortality. Kilic et al.23) reported that a higher surgeon volume was associated with better operative outcomes after mitral valve surgery, independent of the hospital case volume. The discrepancy between their results and our findings might be because they only included the surgeon volumes for evaluating the outcomes after mitral valve surgery. Furthermore, Joynt et al.24) reported that a higher physician volume was associated with a lower mortality rate in patients with heart failure in the United States. Interestingly, they included specialist physicians from the fields of cardiology, family or general medicine, and internal medicine for the analysis. They concluded that the mortality-lowering effect of a higher physician volume in patients with heart failure was more pronounced among non-cardiologists, i.e., internists and generalists. Conversely, we included all-specialist physicians in South Korean hospitals in addition to cardiothoracic surgeons, cardiologists, or anesthesiologists in this study. Our results suggested that the general hospital quality of patient care might be influenced by the overall number of specialist physicians per hospital bed.
From another perspective, the 90-day mortality after CABG might be affected by the overall specialist physician volumes per hospital bed, because patients who undergo CABG require delicate and careful hospital management. A previous observational study reported a safe and effective approach for patients with coronary artery disease, which was established by a multidisciplinary heart team including board-certified attending physicians from various specialties.25) Furthermore, a previous study reported that 14.8% of the patients experienced postoperative complications after cardiac surgery, which were associated with an increased risk of mortality.26) The complications after CABG included sternal wound infections, pneumonia, thromboembolic phenomena, graft failure, atrial fibrillation, pulmonary hypertension, pericardial effusion, stroke, renal injury, gastrointestinal insult, and hemodynamic instability27); therefore, many specialist physicians from various departments might be involved in the treatment of such postoperative complications after CABG.
Our study has some limitations. First, we were unable to include some important physiological variables, such as the body mass index at the time of CABG, because they were not included in the NHIS database. Second, some important operative characteristics, such as the preoperative American Society of Anesthesiologists' physical status, duration of surgery, and anesthesia for CABG, were not evaluated; again, this was because these data were not included in the NHIS database. Third, we defined comorbidities using the ICD-10 codes registered in the NHIS database. However, these diseases, as registered by their ICD-10 codes, might have differed from the actual comorbidities in the patients. Fourth, our adjustment of the multivariable analysis only controlled the known confounders. Thus, residual or unmeasured confounders might have affected the results of the analysis. Fifth, although we used the CCI to reflect the comorbidity status at the time of CABG, we were unable to evaluate other important comorbidity status parameters in detail. Particularly, we could not evaluate the heart function in detail, because this information was not included in the NHIS database. Lastly, regarding the health-care provider-effect, we could not assess the number of cardiac surgeries, intensive care unit (ICU) beds, intensivists or nurses in the ICU, and cardiologists who cared for the CABG patients postoperatively, as well as the turnover rate of the hospital beds, because the NHIS database did not provide this information in detail. Furthermore, the outcomes of CABG might have differed depending upon who performed the surgery (for e.g., senior or junior surgeons); but we did not assess this. Therefore, our results regarding the effects of health-care providers should be interpreted carefully, and more research is needed to confirm these findings.
In conclusion, our South Korean population-based cohort study showed that a higher annual hospital case volume was associated with a lower 90-day mortality after isolated CABG. Additionally, a higher overall specialist physician volume was independently associated with a lower 90-day mortality. We reported cut-off values of ≥65 and ≥18 for the annual case volume of CABG and the total number of overall specialist physicians per 100 hospital beds, respectively, for achieving better outcomes after CABG. Additional studies are needed to confirm these findings.
 XML Download