

 PDF
PDF Citation
 Print
Print


INTRODUCTION
Cataracts are a leading cause of visual impairment and cause lens clouding in one or both eyes and result in vision impairments such as double vision and difficulties with bright lights and night vision.1 Furthermore, cataracts make reading, driving, and recognizing faces difficult and increase the risks of falling and depression. Age-related cataracts (ARC) are defined as having cataracts in adults ≥ 50 years old, and they are classified as nuclear sclerotic, cortical, or posterior subcapsular. Nuclear cataracts are the most common, in which dense nuclear sclerosis occurs at the center of the lens, which becomes sclerotic due to the intra-lens deposition of brown pigmentation.2 Cortical cataracts cause opacity at lens cortices due to changes in fluid content at lens peripheries, whereas posterior subcapsular cataracts develop as a cloud at the back of the lens adjacent to the lens capsule.3 Although types of cataracts differ, they all result in lens opacity and may have similar risk factors.4 ARC needs to be prevented by reducing the impacts of the risk factors.
ARC's overall prevalence is 69.5% in Asian adults aged 60–69 years3 and 33% in Europeans aged 60–69.2 Thus, the prevalence of ARC in Asians is much higher than that in Europeans, suggesting that ARC incidence may be related to lifestyles.5 Since life-expectancy has globally increased, and over 80% of elderly aged over 70 have an ARC, ARC's prevalence will undoubtedly increase.1 The common causes of ARC are aging, gender, trauma, and radiation exposure. Some of these factors, such as age and gender, are not modifiable, but others are accessible. In European countries, men have a higher ARC incidence than women,6 but the Korea National Health Nutrition Examination Survey (KNHANES) 2008–2010 found no gender predilection.7 Furthermore, ARC prevalence has been reported to be inversely associated with socioeconomic factors, education level, income, and residence in a rural area.8
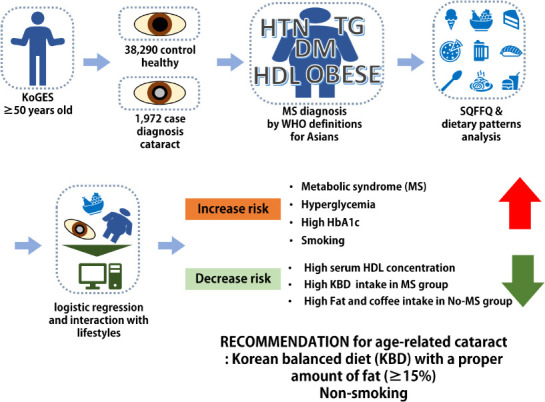
Alteration of modifiable risk factors prevents ARC. Environmental risk factors include hyperglycemia, smoking, long-term exposure to sunlight, and heavy alcohol consumption,91011 though reports on relations between alcohol consumption and smoking and ARC have been somewhat inconsistent. Lipid profiles have also been reported to affect ARC incidence, but the relationship remains controversial. Since ARC formation is known to be associated with oxidative stress, the influence of vitamin C on ARC development has attracted attention,12 but its effects are not noticeable. Furthermore, these risk factors have been largely studied in Western countries, and studies on Asians are relatively recent. However, relations between dietary intakes (e.g., nutrient intakes and dietary patterns) and ARC risk have not been studied in Asians. We hypothesized that adults aged > 50 having ARC displayed an association with metabolic syndrome (MS) and its components, dietary habits, and lifestyles, whereas MS had an interaction with lifestyles to influence ARC risk. The present study was performed using data from a large, annual, hospital-based cohort study in the Korean Genome and Epidemiology Study (KoGES).
METHODS
Participant characteristics and biochemical results
A total of 40,262 Korean adults aged 51–77 years participated from 2004–2013 in the KoGES, organized by the Korean Center for Disease and Control.13
General characteristics, including socioeconomic factors, were acquired using survey responses.14 Anthropometric, biochemical, and dietary parameters were assessed. Weight, height, and waist and hip circumferences were measured, and body mass indices were calculated, as previously described.15 Serum and plasma were separated from blood collected after an overnight fast.16 Serum glucose and plasma total and high-density lipoprotein (HDL) cholesterol and triglyceride concentrations in a fasting state were measured using a Hitachi 7600 Automatic Analyzer (Hitachi, Tokyo, Japan), and plasma low-density lipoprotein (LDL) concentrations were calculated using the Friedewald Equation (plasma LDL concentration = plasma total cholesterol concentration – plasma HDL concentration – plasma triglyceride concentration/5). Blood hemoglobin A1c (HbA1c) contents were determined using a ZEUS 9.9 automatic analyzer (Takeda, Tokyo, Japan).
Education status was classified as less than high school, high school, and college or higher while smoking status as current-smokers, past-smoker, and non-smoker. The types, amounts, and frequencies of alcohol intake were reported in the participants in KoGES. Daily alcohol intakes were calculated by multiplying the frequencies of alcohol drinking by the average amount of alcohol consumed daily. Participants were classified as light drinkers (< 3 g/day), moderate drinkers (3–20 g/day), or heavy drinkers (> 20 g/day). Daily coffee intake was assessed in the same manner, and participants were categorized into three groups using daily coffee intake tertiles. Daily physical activity was estimated by summing physical activities, and daily physical activity levels were classified as light, moderate, or heavy using tertiles.
ARC diagnosis
In the KoGES survey, subjects > 50 years old were asked the question, “Have you ever been diagnosed with a cataract by a physician?” Those that answered “yes” were assigned to the case group, and the others were included in the control group.
Definition of MS
MS was defined as the presence of a cluster of ≥ 3 of the following: 1) abdominal obesity (waist circumference ≥ 90 cm for men and ≥ 85 cm for women); 2) elevated blood pressure (average systolic blood pressure ≥ 130 mmHg or diastolic blood pressure ≥ 85 mmHg); 3) low HDL-cholesterol level (< 40 mg/dL for men and < 50 mg/dL for women); 4) elevated serum triglyceride level (≥ 150 mg/dL); and 5) elevated fasting blood glucose level (≥ 110 mg/dL).17 Participants taking medication for dyslipidemia, hyperglycemia, or hypertension were included in the MS group.
Dietary assessment and dietary patterns
Food intakes were calculated using responses to a semi-quantitative food frequency questionnaire (SQFFQ) composed of 106 food items Koreans mainly consume. The participants checked the frequencies and average serving sizes in each 106 food items in SQFFQ. Each SQFFQ food item was rated as 0.5, 1, or 2-fold of each food item reference serving size. The average intake of each food item was calculated by multiplying the average daily intake frequency by its selected serving size. The quality of the SQFFQ was validated using 3-day food records conducted by subjects.1718 Daily intakes of energy and nutrients (e.g., protein, carbohydrate, and fat) were calculated using Can-Pro 2.0 nutrient assessment software developed by the Korean Nutrition Society.17
The 106 food items in SQFFQ were categorized into 30 predefined food groups (Supplementary Table 1), and principal component analysis (PCA) was conducted with food groups using proc principal component and proc factor procedure. The selected number of factors retained eigenvalues of > 1.5 in the proc principle component procedure, and in this study, the number of factors was 3.19 The orthogonal rotation procedure (varimax) and post-rotated factor loadings were used with PCA. The selected factors described distinct dietary patterns comprised of specific foods, and significant contributory foods were indicated by factor-loading values of ≥ 0.40.20 Factor scores for each dietary pattern were determined by summing the intakes of all food groups weighted by factor loading. Factor scores of each dietary pattern were categorized into tertiles (33th and 66th percentiles) to compare lifestyle factors and nutrient intakes. Dietary patterns were classified into a traditional Korean balanced diet (KBD), a Western-style diet (WD), and a rice-based diet. TB contained high beans, tubers, kimchi, and other fermented foods, vegetables, and seaweeds (Supplementary Table 2). WD had high in bread, cakes, cookies, fast foods, noodles, soups, and red meats. RB mainly contained rice.
Statistical analysis
Statistical analysis was performed using SAS version 9.4 (SAS Institute, Cary, NC, USA). According to MS status, frequency distributions of classification variables were calculated, and statistical analysis was conducted using the chi-squared test. Means and standard errors of general characteristics were calculated, and their statistical differences were analyzed with two-way analysis of variance with main effects of ARC and MS. Adjusted means and standard errors of continuous variables were determined in the ARC and control groups to adjust the ARC and MS-related covariates. The covariates included age, sex, residence area, body mass index, family income, education, smoking, physical activity, menopause, and energy, fat, protein, carbohydrate, alcohol, coffee, and cholesterol intake. A variable to be analyzed was excluded from the covariates. According to MS and ARC, the significance of MS components was determined by a two-way analysis of covariance (ANCOVA) with covariates' adjustments. Intergroup multiple comparisons were performed using the Tukey test. The adjusted odds ratios (ORs) and 95% confidence intervals (CI) for ARC risk were analyzed with the multivariate logistic regression with the adjustment of covariates in each non-MS and MS group. The participants were categorized into higher and lower groups to make the continuous variables into the categorical variables to determine the interaction between MS and demographic and dietary intake parameters to influence ARC incidence. The known criteria for MS were used for the cutoffs to make continuous variables into categorical variables, but the 70th percentile was used as the cutoff values if the criteria were not specified. Interactions between MS and lifestyle parameters to influence ARC incidence were determined using a two-way analysis of covariance (ANCOVA) with an interaction term after adjusting for covariates. Statistical differences were analyzed by two-way ANCOVA containing main effects and their interaction term. We accepted the statistical significance of each analysis at the level of P values < 0.05.
RESULTS
General characteristics of the study population according to the presence of ARC
According to the MS status, ARC's demographic characteristics are summarized in Table 1. 4.63% and 7.69% among the participants aged ≥ 50 years had ARC with the non-MS and MS groups (P < 0.001). Age was higher in the participants with MS (P < 0.001) and ARC (P < 0.001; Table 1). Women had much more ARC than men only in the MS participants (P < 0.001; Table 1). The ARC prevalence was higher about 4 times in low-income (< $1,500) and medium-income ($1,500–4,000) than in those with high-income (≥ $4,000) in both non-MS and MS groups (P < 0.001). It was more significant in subjects educated to middle school than those educated with high school, college, or more level (P < 0.001), regardless of MS (Table 1). The ARC presence did not exhibit the difference in physical activity status in non-MS and MS groups (Table 1). However, the ARC incidence had a significant difference in smoking and alcohol drinking status in non-MS (P < 0.01) and MS groups (P < 0.05). ARC incidence showed an opposite trend according to MS presence, which might be related to quitting smoking due to MS. The ARC participants had lower energy (P < 0.01), fat (P < 0.001), fiber (P < 0.05), vitamin A (P < 0.01), and Na intake (P < 0.01) and higher carbohydrate intake (P < 0.05) than those without ARC regardless of non-MS and MS (Table 1).
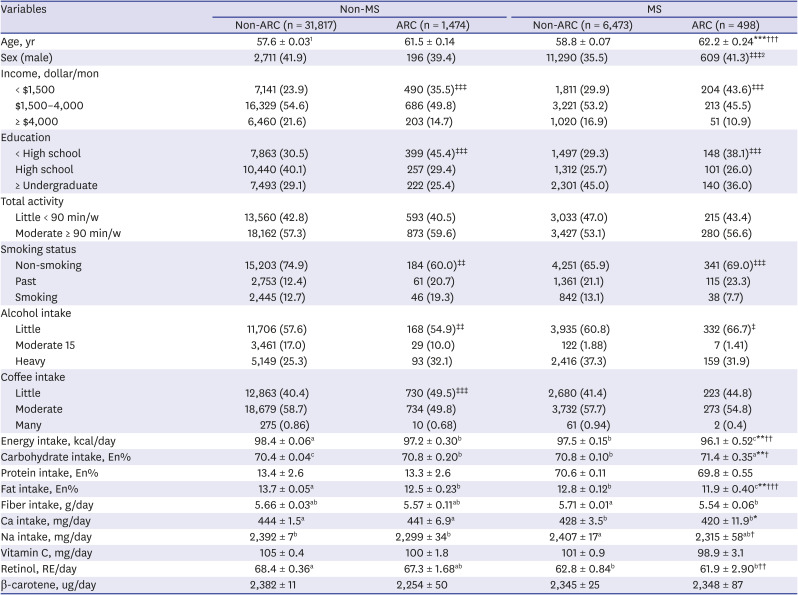
Table 1
General characteristics of ARC prevalence over key variables
Results are means ± standard errors for continuous variables or number (%) for categorical variables.
ARC = age-related cataract, MS = metabolic syndrome.
1Significant difference of each parameter according to ARC and MS incidence were determined using a two-way analysis of variance test with main effects (ARC and MS) in continuous variables.
*Significant differences by ARC incidence at P < 0.05, ** at P < 0.01, and *** at P < 0.001.
†Significant differences by MS incidence at P < 0.05, ** at P < 0.01, and ††† at P < 0.001.
a,b,cDifferent letters indicated significant differences among the groups in the Tukey test at P < 0.05.
2‡Significantly different between non-ARC and ARC groups using χ2 test in the participants having Non-MS or MS at P < 0.05, ‡‡P < 0.01, and ‡‡‡P < 0.001.
![]()
Adjusted means of metabolic parameters related to MS
The frequencies of ARC were higher in the MS group (7.14%) than the non-MS group (4.43%, P < 0.001), and they were also higher in the obese group (body mass index [BMI] ≥ 25 kg/m2; 5.44%) than the lean group (4.61%, P < 0.001; Table 2). However, adjusted means of BMI significantly influenced, and BMI interacted with MS with ARC (P < 0.05; Table 2). The ARC and MS-related covariates included age, sex, residence area, body mass index, family income, education, smoke, physical activity, menopause, and intake of energy, alcohol, coffee, fat, protein, carbohydrate, and cholesterol. Waist and hip circumferences were significantly influenced with MS (P < 0.001 and P < 0.05, respectively), but not ARC risk. Fasting plasma glucose concentrations and blood HbA1c levels were much higher in the ARC group (97.5 vs. 94.3 mg/dL and 5.86 vs. 5.71%, respectively; P < 0.001; Table 2) and MS and ARC significantly affected their concentrations (P < 0.001 and P < 0.001, respectively). However, the other MS components, including serum total, HDL, and LDL cholesterol levels, and diastolic blood pressure, were significantly affected by ARC and MS (P < 0.05; Table 2). However, serum triglyceride and C-reactive peptide levels (an index of inflammation) and systolic blood pressure showed a significant impact by ARC incidence (P < 0.05) but not by MS (Table 2).
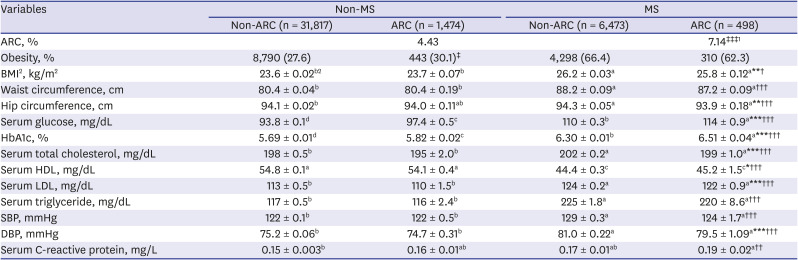
Table 2
Adjusted means and standard errors of metabolic parameters according to ARC status
Results are adjusted means ± standard errors.
ARC = age-related cataract, MS = metabolic syndrome, BMI = body mass index, HbA1c = hemoglobin A1c, HDL= high-density lipoprotein, LDL = low-density lipoprotein, SBP = systolic blood pressure, DBP = diastolic blood pressure.
1‡Significantly different between Non-ARC and ARC groups using χ2 test in the participants having Non-MS or MS at P < 0.05 and ‡‡‡P < 0.001.
2Statistically significant differences of each variable according to ARC and MSincidence were determined using two-way analysis of covariance test with main effects (ARC and MS) in continuous variables after adjusting for covariates including age, sex, residence area, body mass index, family income, education, smoke, physical activity, menopause, and intake of energy, alcohol, coffee, fat, protein, carbohydrate, and cholesterol. When a variable was included in the covariates, it was excluded from the covariates.
**Significant differences by ARC incidence at P < 0.01 and ***P < 0.001.
†Significant differences by MS incidence at P < 0.05 and †††P < 0.001.
a,b,cDifferent letters indicated significant differences among the groups in the Tukey test at P < 0.05.
![]()
Associations between ARC risk and socioeconomic and metabolic parameters
According to the binary groups of socioeconomic and metabolic parameters after adjusting covariates, the adjusted ORs and 95% CIs of ARC risk were exhibited in models 1 and 2 (Table 3). The covariates used age, sex, residence area, body mass index, family income, education, smoking, physical activity, menopause, and energy, fat, protein, carbohydrate, alcohol, coffee, and cholesterol intake. ARC had a positive association with MS with 1.309 (1.163–1.473)-fold after adjusting for age, sex, residence area, body mass index, and energy intake and 1.317 (1.172–1.480)-fold after adjusting for all indicated covariates. Subjects ≥ 60 years old had a 3.5- and a 4.3-fold higher risk of ARC than subjects < 60 years old in non-MS (P < 0.001) and MS groups (P < 0.001), respectively (Table 3). Sex, education, and income had no significant association with ARC risk in non-MS and MS groups (Table 3). Among MS components, BMI and waist circumference, blood pressure, and serum triglyceride concentration were not associated with ARC risk in non-MS and MS groups. Interestingly, fasting plasma glucose and HbA1c levels had a positive association with ARC in both non-MS (OR, 1.500; 95% CI, 1.211–1.858; P < 0.001) and MS groups (OR, 1.917; 95% CI, 1.514–2.426; P < 0.001) (Table 3). Moreover, serum concentrations of total cholesterol, LDL, and HDL concentrations were associated with ARC only in the MS group but not in non-MS. Higher concentrations of serum total cholesterol and LDL cholesterol and lower serum HDL concentration increased the ARC risk by 1.29 (P < 0.05), 1.37 (P < 0.01), and 1.49 folds (P < 0.001), respectively, in the participants with MS (Table 3). However, serum C-reactive peptide concentrations were not associated with ARC risk (Table 3).
Table 3
Adjusted ORs1 and 95% CI of the parameters to affect ARC risk
Values represent adjusted odds ratio and 95% CI.
OR = odds ratio, CI = confidence interval, ARC = age-related cataract, MS = metabolic syndrome, BMI = body mass index, LDL = low-density lipoprotein, HDL= high-density lipoprotein, TG = triglyceride.
Non-MS, not having MS; MS, having MS; Non-ARC, not having ARC.
1In each MS or non-MS group, the adjusted ORs and 95% CI were analyzed with multivariate logistic regression of each variable for ARC risk after adjusting for age, sex, residence area, body mass index, family income, education, smoke, physical activity, menopause, and intake of energy, alcohol, coffee, fat, protein, carbohydrate, and cholesterol. When a variable was used as an independent variable, it was excluded from the covariates.
2The criteria of the high group when the values of each variable were dichotomized into two groups.
3,4The non-ARC group was the reference in Non-MS and MS group.
*Significant association of each variable for ARC risk in either Non-MS or MS group at P < 0.05, **P < 0.01, and *** at P < 0.001.
![]()
Association between ARC risk and dietary patterns
The present study evaluated the association of lifestyle-related risk factors with ARC and the interaction between the risk factors (Table 4) and MS status to influence ARC (Fig. 1). KBD interacted with MS presence for ARC risk (P = 0.045; Table 4, Fig. 1A). Those who consumed a high KBD diet had significantly lower ORs (0.801; 95% CI, 0.696–0.999; P < 0.01) for ARC risk than those who had a low KBD diet only in the MS groups (Table 4). In the MS participants, only KBD intake was negatively associated with the ARC risk. Other lifestyle-related parameters did not influence ARC incidence in MS participants (Table 4). Rice-based diet and WD diet patterns did not exhibit an association with ARC risk regardless of MS presence, and they did not interact with MS to influence ARC risk (Table 4).
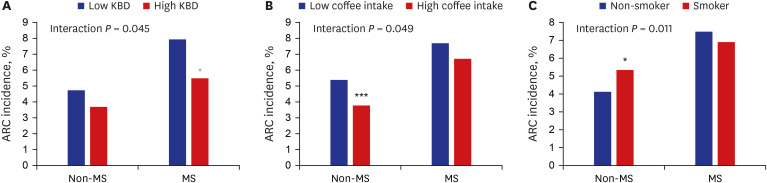
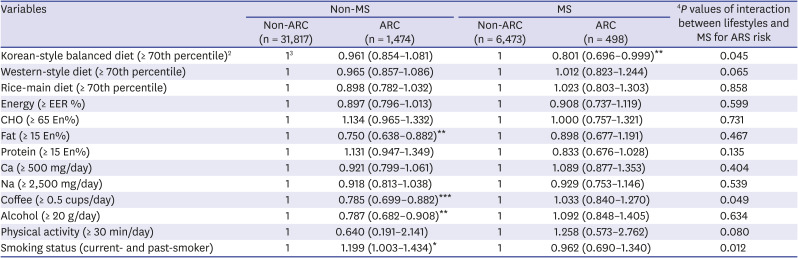
Fig. 1
ARC frequencies among participants according to the MS status.
(A) ARC frequencies of participants consumed low- and high-Korean-balanced diet according to MS status. (B) ARC frequencies of participants who consumed low- and high-coffee intake according to MS status. (C) ARC frequencies of non-smokers and smokers according to MS status.
ARC = Age-related cataracts, KBD = Korean-balanced diet, MS = metabolic syndrome.
Interaction P value: Statistically significant differences of interaction term of MS and each parameter for ARC incidence using two-way analysis of covariance test with main effects (MS and lifestyle-related variables) and their interaction term after adjusting for covariates including age, sex, residence area, and body mass index, smoking status, income, education, steroid medicine intake, energy intake.
Statistically significant differences of ARC frequencies between high and low groups were determined by χ2 test in non-MS and MS groups.
*Significant differences of ARC incidences between low and high groups in the participants without MS (Non-MS) at P = 0.05 and *** at P < 0.001.
+Significant differences of ARC incidences between low and high groups in the participants with MS.
![]()
Table 4
Adjusted ORs1 and 95% CIs of dietary patterns and nutrients to affect ARC risk
Values represent adjusted ORs and 95% CI.
OR = odds ratio, CI = confidence interval, ARC = age-related cataract, MS = metabolic syndrome, EER = estimated energy requirement, CHO = carbohydrates.
Non-MS, not having MS; MS, having MS; Non-ARC, not having ARC.
1In each MS or non-MS group, the adjusted ORs and 95% CI were analyzed with multivariate logistic regression of each variable for ARC risk after adjusting for age, sex, residence area, body mass index, family income, education, smoke, physical activity, menopause, and intake of energy, alcohol, coffee, fat, protein, carbohydrate, and cholesterol. When an independent variable was included in the covariates, it was excluded in the covariates.
2The criteria of the high group when the values of each variable were dichotomized into two groups.
3The non-ARC group was the reference in Non-MS and MS group.
4P value for the interactions between MS and lifestyle parameters to influence ARC incidence using two-way analysis of covariance with an interaction term after covariates' adjustments.
*Significant association of each variable for ARC risk in either Non-MS or MS group at P < 0.05, **P < 0.01, and *** at P < 0.001.
![]()
Daily energy intake was not associated with ARC risk in the non-MS and MS groups. In the percentage of macronutrient intake, only fat intake had an association with ARC risk. A fat intake had a negative association with ARC risk (in ≥ 15 energy %, OR, 0.750; 95% CI, 0.638–0.882; P < 0.01) only in non-MS, not in the MS group. However, there was no significant interaction of fat intake with MS for ARC risk. Ca and Na intake had no significant association with ARC risk regardless of MS (Table 4). High intakes of coffee (≥ 1 cup/day) and alcohol (≥ 20 g/day) were associated with lower ARC risks by 0.785 (95% CI, 0.699–0.882; P < 0.001) and 0.787 (95% CI, 0.682–0.908; P < 0.01) only in the non-MS group, but not MS group (Table 4). There was a significant interaction of coffee intake with MS to influence ARC risk, and ARC incidence was lower in a high coffee intake than in a low coffee intake only in the non-MS group (Fig. 1B). However, no significant association was observed between ARC risk and physical activity regardless of MS incidence (Table 4). Interestingly, former smokers and current smokers had a higher risk of ARC than non-smokers only in the non-MS group (Table 4). Smoking had an interaction with MS to develop ARC (P = 0.012), and smoking increased ARC incidence only in the non-MS group, but not the MS group (Fig. 1C).
DISCUSSION
The prevalence of cataracts among the elderly has increased worldwide, and cataract surgery is the primary therapeutic method to prevent vision loss.21 In the present study, we found that MS was positively associated with ARC prevalence after adjusting for confounding factors. Furthermore, ARC prevalence was positively associated with rice-main dietary patterns and negatively associated with a balanced diet. High carbohydrate intake was associated with a 1.4-fold increase in ARC risk, and high fat, protein, and Ca intake had an association with a 0.74-fold decrease in model 1. These results suggest that a balanced diet containing sufficient protein and Ca protects against ARC prevalence in middle-aged and elderly adults.
Previous studies have reported that obesity,2223 diabetes,2425 dyslipidemia,2627 and hypertension28 are associated with ARC incidence. Our study supports these previous results. However, further analysis of results showed that relations between ARC prevalence and the components of MS differed from earlier findings. Of the four MS features, hyperglycemia is the most critical risk factor for ARC prevalence because ORs of Hb1Ac are over 2. Hypertension was a moderate risk factor, given that only systemic blood pressure increases the risk for ARC by 12 to 15%. Obesity and hypertension did not affect ARC risk in the present study.
For example, in the present study, BMI, waist circumferences, systolic and diastolic blood pressures, hypertension, lipid profiles (LDL, HDL, and triglyceride) were not significantly associated with ARC prevalence. Total cholesterol and LDL levels were significantly lower in the ARC group than in the non-ARC group, although this association disappeared after adjusting for confounding factors in logistic regression analysis. Although the exact reason is unclear, one possible explanation for this observation is that patients with ARC might have taken cholesterol-lowering drugs (e.g., statins), given that patients with an ARC may also have dyslipidemia. However, the pathogenic and protective effects of statins on ARC are poorly documented and widely debated.2930 Recent reports have suggested that the prolonged use of statins might predispose ARC development,31 but others failed to identify an association.32 Further studies are needed to determine whether cholesterol-lowering drugs might be associated with cataractogenesis.
BMI and abdominal obesity (as determined by waist circumference) have been suggested to be risk factors of ARC. Cheung and Wond have reported that obesity was positively associated with ARC's presence,33 but other studies disagreed. A study conducted in Singapore has demonstrated that obesity is positively related to the prevalence of cortical cataracts but negatively linked to nuclear cataracts.22 Another study based on the Korean National Health and Nutritional Examination Survey data showed that overweight was significantly associated with a lower ARC risk.23 However, we found no association between obesity and ARC prevalence.
The present study revealed significant associations of ARC prevalence with serum glucose levels and hemoglobin A1c levels, consistent with previous findings.3435 In particular, we observed linear associations between hemoglobin A1c and fasting serum glucose levels and the presence of ARC using generalized linear models, which suggests high fasting glucose levels and diabetes are risk factors of ARC prevalence. It has also been suggested that advanced glycation of lens fiber proteins,36 hyperosmotic pressure, and the sorbitol pathway are possible mechanisms of ARC formation.37
The unique anatomy and avascularity of the lens by ARC supported this present study. Lens metabolism is mainly dependent upon the presence of glucose, not oxygen.38 The levels of enzymes for aerobic oxidation of glucose are low, restricting the lens metabolism mainly to anaerobic glycolysis. Even in the epithelium, anaerobic glycolysis seems to be the principal source of biological energy. Thus, the lens's transparency would relatively depend on glucose metabolism among the four MS components.
Tryptophan/selenium imbalance and calcium, vitamin C, vitamin A, and excessive energy intakes are generally considered ARC risk factors.39 However, we found vitamin C, vitamin A, and carotene intakes were not associated and that calcium intake was negatively associated with ARC risk. The average intake of vitamins A and C and carotene was higher than dietary reference intake (DRI) in both case and control groups. However, the average intake of calcium intake (about 449 mg/day) in our subjects was ~50% of DRI, and calcium intakes were too low to enhance ARC risk.40 Furthermore, in the present study, macronutrient intake was associated with ARC risk consistent with MS risk.4142 A high carbohydrate diet (> 70 energy %) and a low-fat diet (< 15 energy %) were found to be associated with MS in a previous study using KNHANES data.424344 The present study showed a consistent result in ARC risk. Metabolic syndrome is associated with ARC risk,45 and macronutrient nutrient intake showed similar patterns for the risk of both diseases. The present study shows that high carbohydrate, low fat, and low protein diets increased ARC risk in middle-aged and elderly adults.
The present study has several limitations. First, the physician's ARC diagnosis was evaluated based on self-reports rather than clinical examinations, which may have caused bias. Second, KoGES data did not include current ARC status or information on the cataract severity or subtype. Third, the results could not interpret cause and effect because of the data from the cross-sectional design of KoGES. Fourth, nutrient intakes and lifestyles were determined using self-reported questionnaires, and thus, were prone to subjective errors. However, it should be added that the semi-quantitative food questionnaire used contained 106 commonly consumed food items and was validated using three-day food records over four seasons.
In conclusion, an association exists between MS and ARC incidence in a large hospital-based cohort, hyperglycemia was a strong and independent risk factor of ARC, and dyslipidemia except serum triglyceride had a positive association with ARC risk only in MS patients. However, other MS components (i.e., obesity and hypertension) were not associated with ARC risk. A traditional Korean balanced diet pattern containing fermented foods and an optimal fat intake (≥ 15 energy %) should be recommended to reduce ARC risk only in persons with MS. These results can be applied to prevent ARC in middle-aged and older adults.
 XML Download